. 2024 May 1;17(5):dmm050638.
doi: 10.1242/dmm.050638. Epub 2024 May 29.

An ALS-associated mutation dysregulates microglia-derived extracellular microRNAs in a sex-specific manner

Affiliations

An ALS-associated mutation dysregulates microglia-derived extracellular microRNAs in a sex-specific manner

Eleni Christoforidou et al. Dis Model Mech. .

Abstract

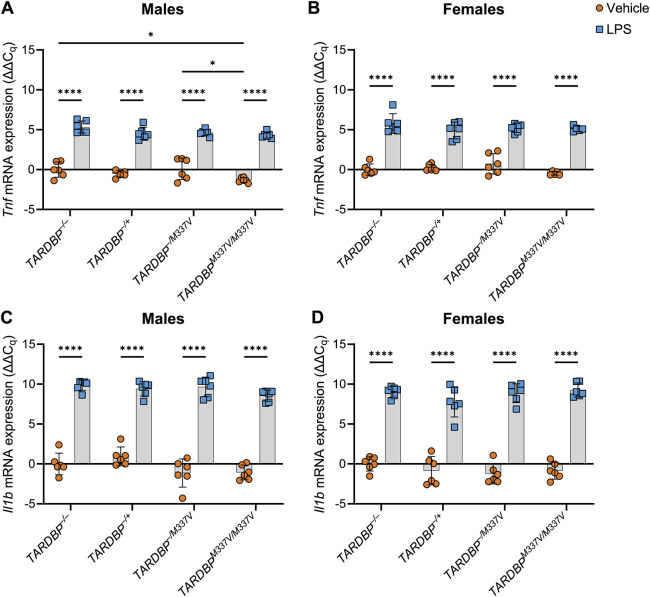
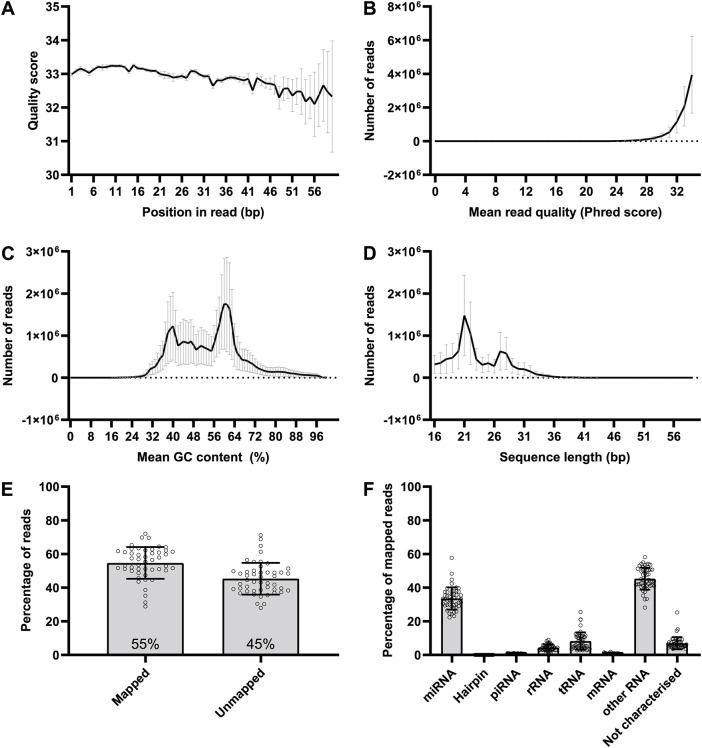
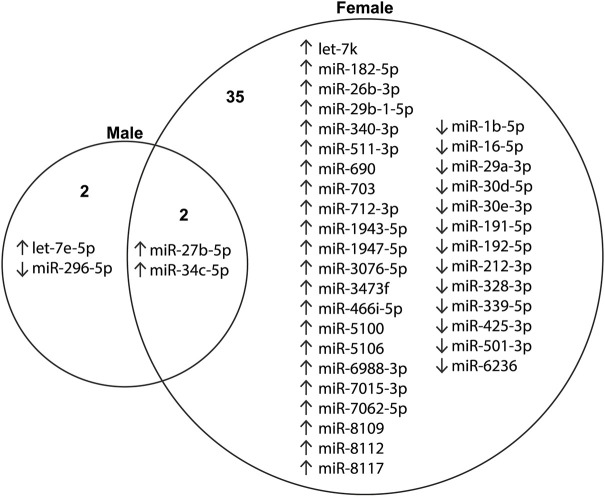
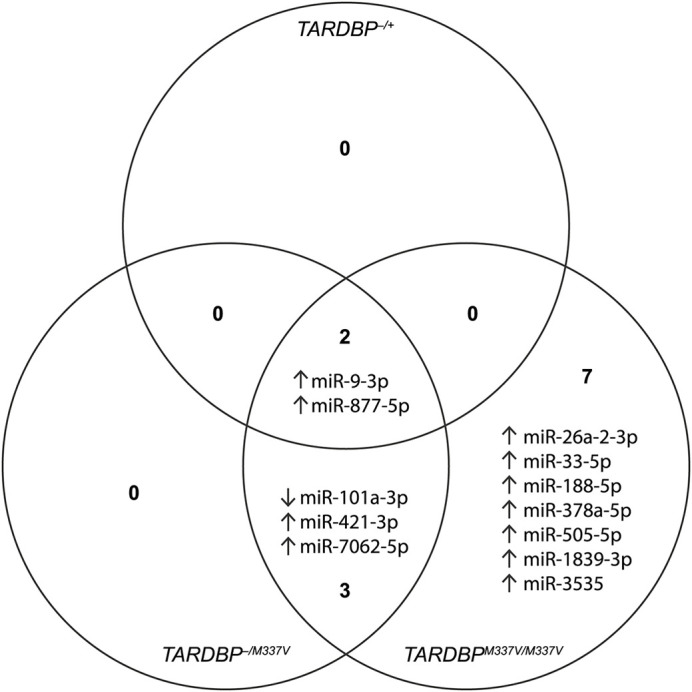
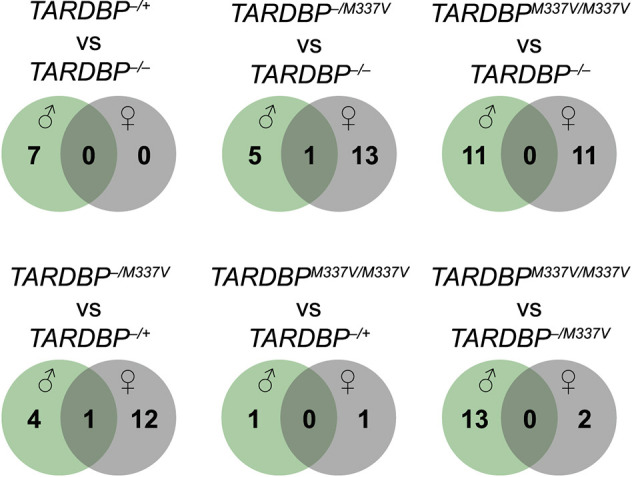
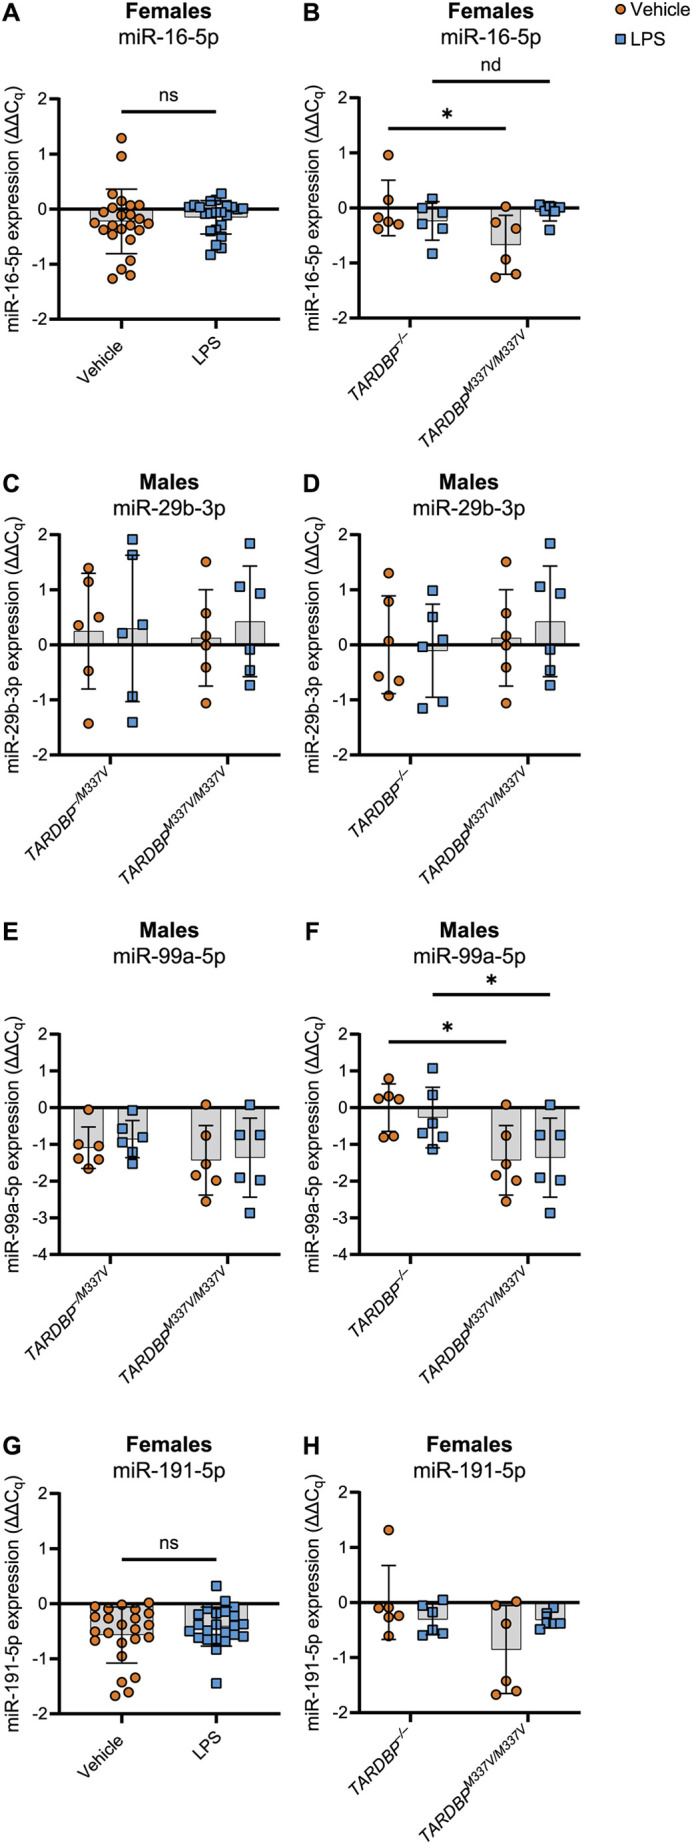
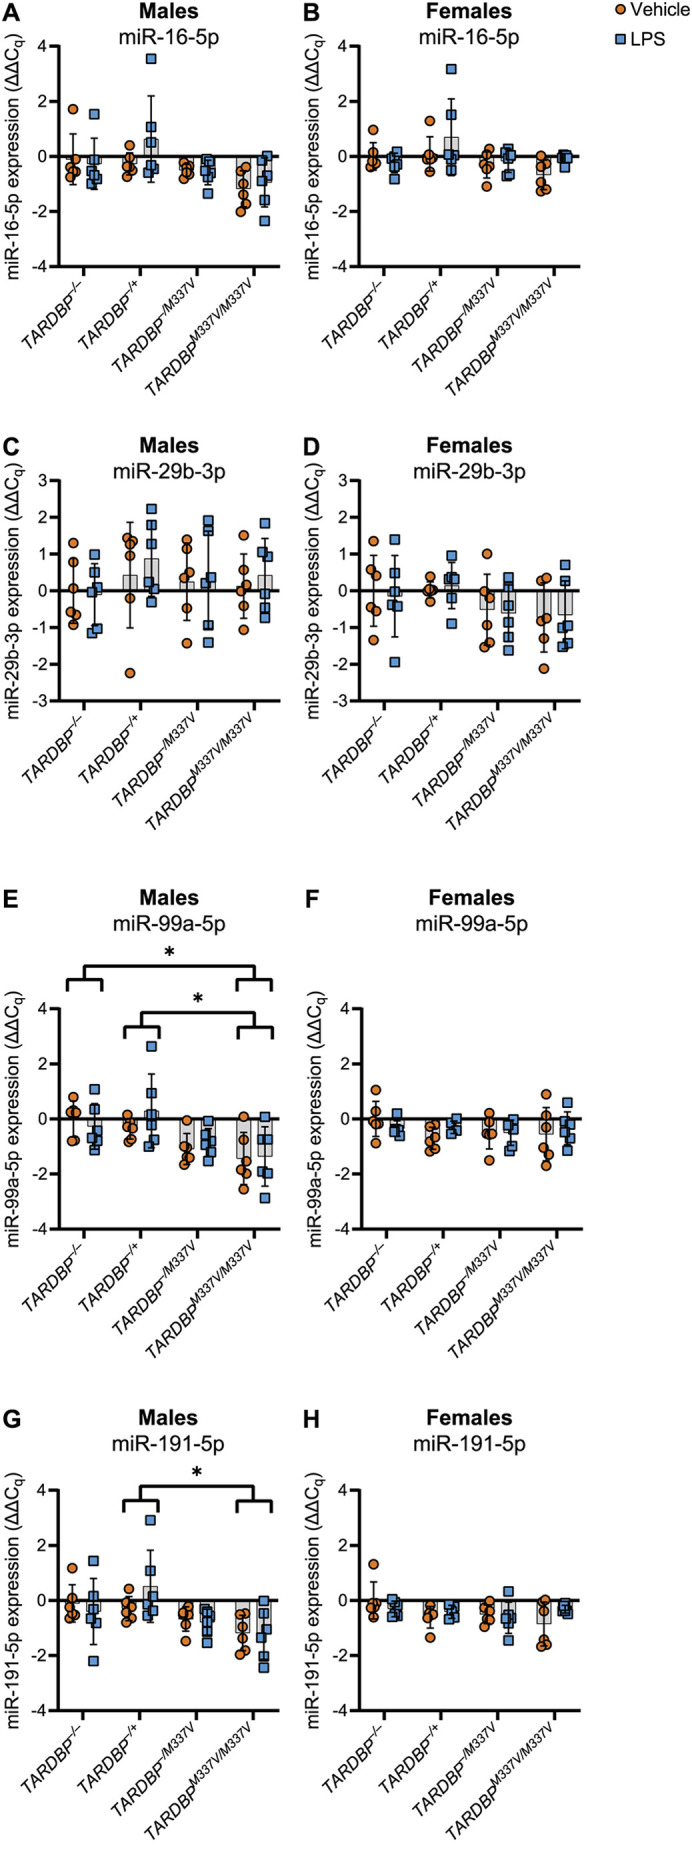
Evidence suggests the presence of microglial activation and microRNA (miRNA) dysregulation in amyotrophic lateral sclerosis (ALS), the most common form of adult motor neuron disease. However, few studies have investigated whether the miRNA dysregulation originates from microglia. Furthermore, TDP-43 (encoded by TARDBP), involved in miRNA biogenesis, aggregates in tissues of ∼98% of ALS cases. Thus, this study aimed to determine whether expression of the ALS-linked TDP-43M337V mutation in a transgenic mouse model dysregulates microglia-derived miRNAs. RNA sequencing identified several dysregulated miRNAs released by transgenic microglia and a differential miRNA release by lipopolysaccharide-stimulated microglia, which was more pronounced in cells from female mice. We validated the downregulation of three candidate miRNAs, namely, miR-16-5p, miR-99a-5p and miR-191-5p, by reverse transcription quantitative polymerase chain reaction (RT-qPCR) and identified their predicted targets, which primarily include genes involved in neuronal development and function. These results suggest that altered TDP-43 function leads to changes in the miRNA population released by microglia, which may in turn be a source of the miRNA dysregulation observed in the disease. This has important implications for the role of neuroinflammation in ALS pathology and could provide potential therapeutic targets.

Keywords: Amyotrophic lateral sclerosis; MicroRNA; Microglia; Motor neuron disease; TDP-43.


Conflict of interest statement

Competing interests E.C. holds shares in Thermo Fisher Scientific and various index funds, which may include companies whose products were used in the research reported in this article. Additionally, E.C. has been engaged in a compensated collaboration with Thermo Fisher Scientific for promotional activities unrelated to this research. These potential financial interests do not influence the design, execution or interpretation of the research findings presented in this article. All other authors declare no competing interests.

Figures

Fig. 1.
Fig. 1.
Tnf and Il1b expression is induced within microglia upon LPS treatment. (A,B) Tnf mRNA expression. One outlier was removed from the female TARDBPM337V/M337V data. (C,D) Il1b mRNA expression. Following normalisation to housekeeping genes (Gapdh and Pgk1), expression values (ΔCq) were normalised to the mean of values from the vehicle-treated samples from TARDBP−/− animals within each sex group to obtain ΔΔCq values [i.e. ΔΔCq values were calculated as (vehicle-treated TARDBP−/− ΔCq mean) minus (individual ΔCq value)]. This normalisation process resulted in some vehicle sample values being slightly above or below zero. Data are shown as mean±s.d. n=6 biological replicates per genotype per sex. Two-way ANOVA with Šidák's post-hoc was used. Main effect of treatment (A-D): P<0.0001. Main effect of genotype (A): P=0.0090. Genotype×treatment interaction (D): P=0.0254. Pairwise comparisons: *P<0.05; ****P<0.0001.
Fig. 2.
Fig. 2.
Quality control of sequencing reads and mapping information. (A) Per-base sequence quality. (B) Per-sequence quality scores. (C) Per-sequence GC content. (D) Sequence length distribution. (E) Percentage of mapped and unmapped reads in each sample sequenced (mean percentage value is indicated within the bars). (F) Percentage of mapped reads. ‘Not characterised’ reads are those that aligned to the genome but in a location that does not correspond to currently known RNA sequences. Data are shown as mean±s.d. n=48 samples.
Fig. 3.
Fig. 3.
miRNAs with dysregulated release into the culture medium upon LPS stimulation, after adjusting for genotype effects. ‘Up’ arrows indicate upregulation and ‘down’ arrows indicate downregulation of miRNA levels in the culture medium following LPS stimulation, compared to those for vehicle treatment. n=3 biological replicates per genotype per sex. A list of these dysregulated miRNAs and associated significance values is also provided in Table S1.
Fig. 4.
Fig. 4.
miRNAs with dysregulated release into the culture medium in female transgenic samples, after adjusting for treatment effects. ‘Up’ arrows indicate upregulation and ‘down’ arrows indicate downregulation of miRNA levels for the indicated genotype, compared to those for non-transgenic controls. n=3 biological replicates per genotype per sex. A list of these dysregulated miRNAs and associated significance values is also provided in Table S2.
Fig. 5.
Fig. 5.
Comparison of miRNAs with dysregulated release into the culture medium upon LPS treatment between male and female samples. n=3 biological replicates per genotype per sex. A list of the dysregulated miRNAs and associated significance values is provided in Table S3.
Fig. 6.
Fig. 6.
RT-qPCR analysis confirms the dysregulated release of miRNAs from microglia into the culture medium as identified by sequencing. Expression values (ΔΔCq) were normalised to the geometric mean of the miRNA expression for the vehicle-treated samples from TARDBP−/− animals within each sex group, following normalisation to the three least variable miRNAs identified by geNorm (miR-28a-3p, miR-32-5p and miR-190a-5p). Data are shown as mean±s.d. (A) Expression of miR-16-5p in female samples (all genotypes pooled). (B) Expression of miR-16-5p in female TARDBP−/− and TARDBPM337V/M337V samples. Significant genotype×treatment interaction: P=0.0206. (C) Expression of miR-29b-3p in male TARDBP−/M337V and TARDBPM337V/M337V samples. No significant main effects. (D) Expression of miR-29b-3p in male TARDBP−/− and TARDBPM337V/M337V samples. No significant main effects. (E) Expression of miR-99a-5p in male TARDBP−/M337V and TARDBPM337V/M337V samples. No significant main effects. (F) Expression of miR-99a-5p in male TARDBP−/− and TARDBPM337V/M337V samples. Significant main effect of genotype: P=0.0250. (G) Expression of miR-191-5p in female samples (all genotypes pooled). (H) Expression of miR-29b-3p in female TARDBP−/− and TARDBPM337V/M337V samples. No significant main effects. n=24 (A,G) or 6 (B-F,H) biological replicates per genotype. ns, not significant, P≥0.05; nd, no discovery (FDR≥0.05); * indicates discovery (FDR<0.05). Statistical tests: paired two-tailed t-test (A,G); repeated-measures two-way ANOVA (C-E,G); repeated-measures two-way ANOVA with two-stage step-up post hoc test (B,F);
Fig. 7.
Fig. 7.
RT-qPCR analysis of miRNAs released from microglia into the culture medium for all genotypes. Expression values (ΔΔCq) are normalised to the geometric mean of the miRNA expression for the vehicle-treated samples from TARDBP−/− animals within each sex group, following normalisation to the three least variable miRNAs identified by geNorm (miR-28a-3p, miR-32-5p and miR-190a-5p). Data are shown as mean±s.d. (A,B) Expression of miR-16-5p in male (A) and female (B) samples. No significant main effects. (C,D) Expression of miR-29b-3p in male (C) and female (D) samples. No significant main effects. (E,F) Expression of miR-99a-5p in male (E) and female (F) samples. Males (E): significant main effect of genotype (P=0.0116). Females (F): no significant main effects. (G,H) Expression of miR-191-5p in male (G) and female (H) samples. Males (G): significant main effect of genotype (P=0.0192). Females (H): no significant main effects. n=6 biological replicates per genotype paired across treatments. *FDR<0.05. Statistical tests: repeated measures two-way ANOVA (A-D); repeated-measures two-way ANOVA with two-stage step-up post-hoc (E,G); mixed-effects model (due to one outlier removed from TARDBP−/+) (F,H).

Similar articles

References

    1. Afgan, E., Baker, D., Batut, B., van den beek, M., Bouvier, D., Čech, M., Chilton, J., Clements, D., Coraor, N., Grüning, B. A.et al. (2018). The Galaxy platform for accessible, reproducible and collaborative biomedical analyses: 2018 update. Nucleic Acids Res. 46, W537-W544. 10.1093/nar/gky379 - DOI - PMC - PubMed
    1. Agarwal, V., Bell, G. W., Nam, J.-W. and Bartel, D. P. (2015). Predicting effective microRNA target sites in mammalian mRNAs. eLife 4, e05005. 10.7554/eLife.05005 - DOI - PMC - PubMed
    1. Ashburner, M., Ball, C. A., Blake, J. A., Botstein, D., Butler, H., Cherry, J. M., Davis, A. P., Dolinski, K., Dwight, S. S., Eppig, J. T.et al. (2000). Gene Ontology: tool for the unification of biology. Nat. Genet. 25, 25-29. 10.1038/75556 - DOI - PMC - PubMed
    1. Aucher, A., Rudnicka, D. and Davis, D. M. (2013). MicroRNAs transfer from human macrophages to hepato-carcinoma cells and inhibit proliferation. J. Immunol. 191, 6250. 10.4049/jimmunol.1301728 - DOI - PMC - PubMed
    1. Bandi, N. and Vassella, E. (2011). miR-34a and miR-15a/16 are co-regulated in non-small cell lung cancer and control cell cycle progression in a synergistic and Rb-dependent manner. Mol. Cancer 10, 55. 10.1186/1476-4598-10-55 - DOI - PMC - PubMed