[Preprint]. 2024 Apr 18:rs.3.rs-4164642.
doi: 10.21203/rs.3.rs-4164642/v1.

A first comprehensive analysis of Transcribed Ultra Conserved Regions uncovers important regulatory functions of novel non-coding transcripts in gliomas

Affiliations

A first comprehensive analysis of Transcribed Ultra Conserved Regions uncovers important regulatory functions of novel non-coding transcripts in gliomas

Myron K Gibert Jr et al. Res Sq. .

Abstract

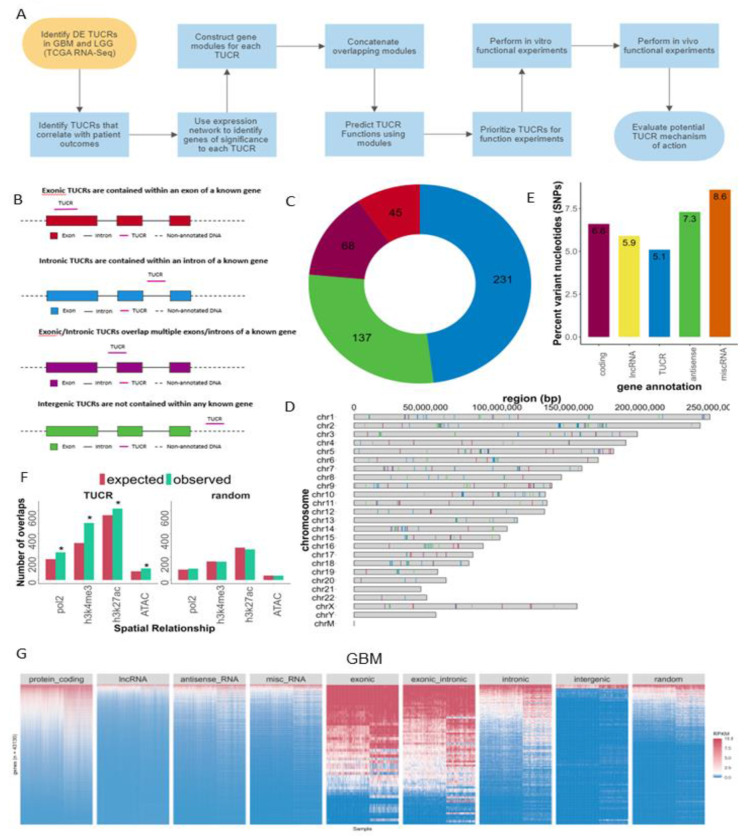
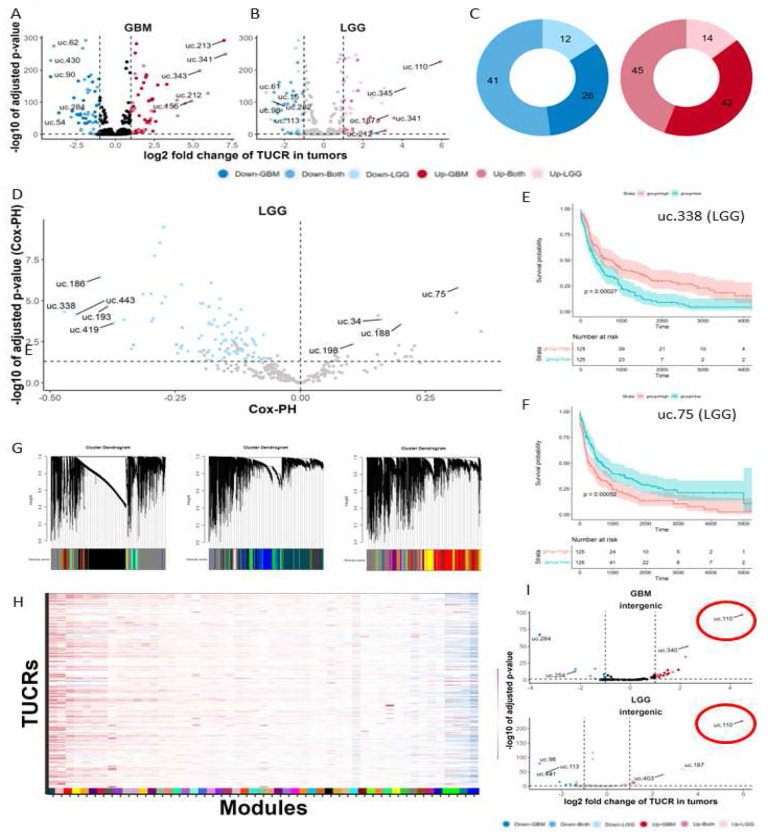
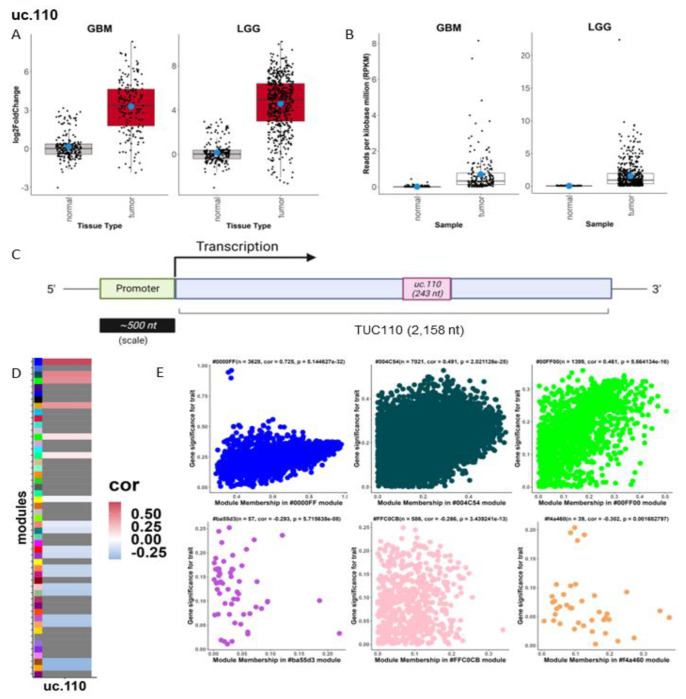
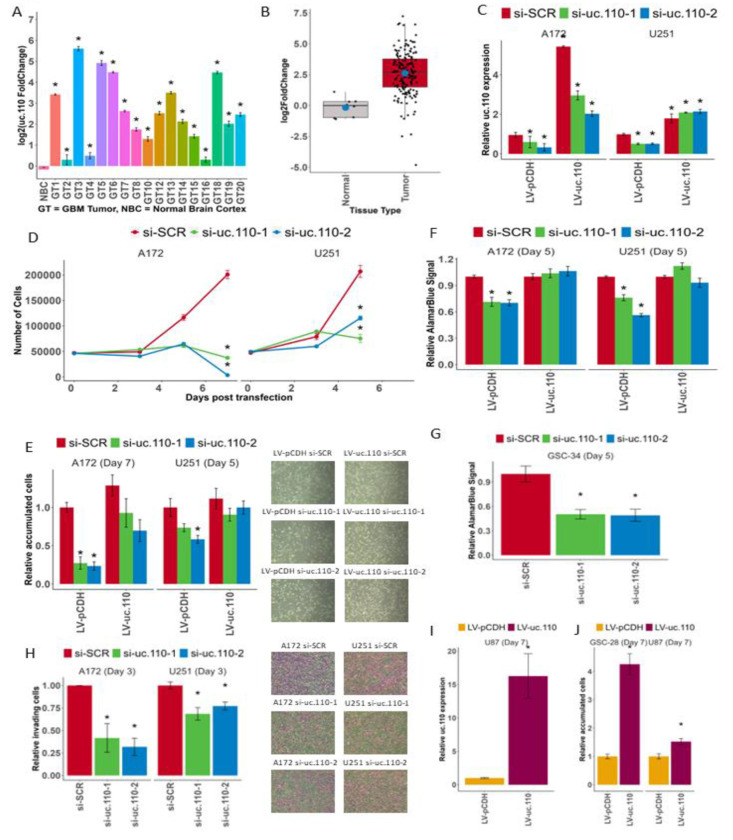
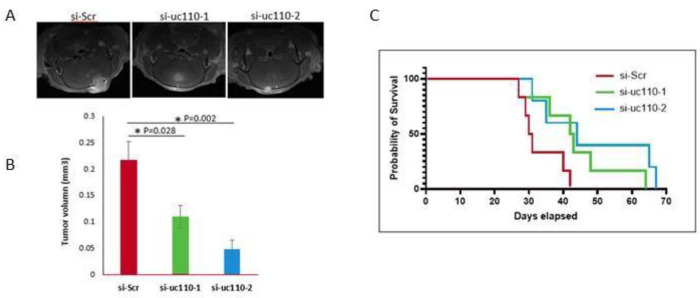
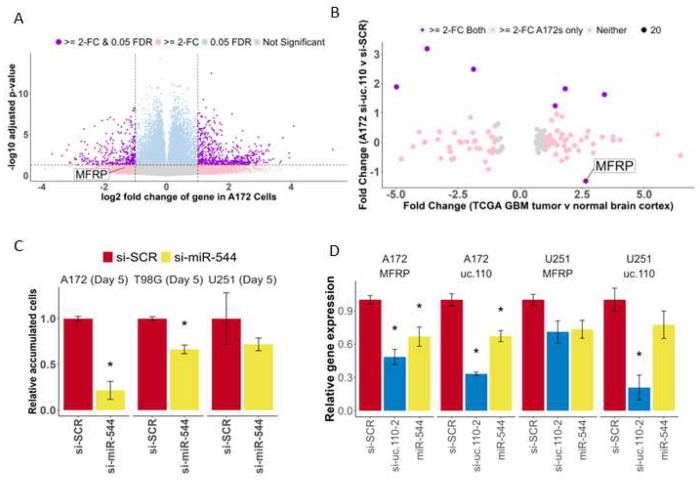
Transcribed Ultra-Conserved Regions (TUCRs) represent a severely understudied class of putative non-coding RNAs (ncRNAs) that are 100% conserved across multiple species. We performed the first-ever analysis of TUCRs in glioblastoma (GBM) and low-grade gliomas (LGG). We leveraged large human datasets to identify the genomic locations, chromatin accessibility, transcription, differential expression, correlation with survival, and predicted functions of all 481 TUCRs, and identified TUCRs that are relevant to glioma biology. Of these, we investigated the expression, function, and mechanism of action of the most highly upregulated intergenic TUCR, uc.110, identifying it as a new oncogene. Uc.110 was highly overexpressed in GBM and LGG, where it promoted malignancy and tumor growth. Uc.110 activated the WNT pathway by upregulating the expression of membrane frizzled-related protein (MFRP), by sponging the tumor suppressor microRNA miR-544. This pioneering study shows important roles for TUCRs in gliomas and provides an extensive database and novel methods for future TUCR research.


Conflict of interest statement

Additional Declarations: There is NO Competing Interest.

Figures

Figure 1.
Figure 1.. Annotation, localization, and expression of TUCRs in GBM and LGG.
A) Experimental workflow for identifying and studying TUCRs of interest. B) TCGA analysis shows that TUCRs can be exonic (red), intronic (blue), exonic/intronic (purple) or intergenic (green). C) Circle graph showing the distribution of genomic annotations across all 481 TUCRs, with colors matching 1B. D) Karyoplot showing that TUCRs exist on all chromosomes except for Chr21, the Y chromosome and mitochondrial DNA, vertical lines show TUCRs with colors matching 1B. E) Bar chart demonstrating that TUCRs are more resistant to single nucleotide variants (SNVs/SNPs) than other gene annotation categories. F) Bar chart showing that TUCRs are enriched for markers for open and active chromatin in GBM cells, suggesting that they represent transcriptionally active sites. Red bars represent chi-square expected overlaps, and teal bars represent observed values. G) Heatmap representing TUCR absolute expression (RPKM) across multiple gene annotations. Blue represents poorly expressed genes (<1 RPKM), White/Pink genes are moderately expressed (>=1 RPKM) and Red represents highly expressed genes (RPKM >=10). TUCRs demonstrate an expression profile that is most comparable with protein coding genes. * = p < 0.05
Figure 2.
Figure 2.. TUCRs are deregulated and associated with patient outcomes in GBM and LGG and may have broad functional roles.
All experiments were performed using TCGA GBM and LGG and GTEx normal brain RNA-Seq data. A) Volcano plot showing that 87 TUCRs are upregulated >=2-fold (1-log2FC) and 67 are downregulated in GBM. Red dots are upregulated. Blue dots are downregulated. B) Volcano plot showing that 59 TUCRs are upregulated >=2-fold in LGG, and 53 are downregulated in LGG. C) Circle graph demonstrating that of the 154 deregulated TUCRs in GBM, 86 were also deregulated in LGG, a 56% overlap. Dark Red/Blue are TUCRs deregulated in GBM. Light Pink/Blue are TUCRs deregulated in LGG. Intermediate Red/Blue represent TUCRs deregulated in both. D) Volcano plot showing that several TUCRs are significantly associated with patient outcomes in LGG. Pink dots represent TUCRs significantly associated with poor prognosis. Blue dots represent TUCRs significantly associated with good prognosis. E) Kaplan-Meier showing that TUCR uc.338 is significantly associated with good prognosis. Red line represents the uc.338 high expression group. Teal line represents the uc.338 low expression group. F) Kaplan-Meier showing that uc.75 is significantly associated with poor prognosis (Line colors as described in E). G) Gene similarity dendrograms from weighted gene correlation network analysis (WGCNA). 42,644 genes were aggregated into 3 "blocks" by gene similarity and were then further aggregated into 51 linkage modules using TUCR expression as trait data. Modules are denoted with distinct color hex codes. (e.g. #004C54 is the “midnight green” module). H) Heatmap showing that TUCRs demonstrate association with all 60 modules, suggesting broad potential functions. Red and Blue represent positive and negative correlations, respectively. I) Volcano plot showing that the uc.110 TUCR is the most upregulated TUCR in GBM and LGG (Line colors as described in E). * = p < 0.05
Figure 3.
Figure 3.. The uc.110 TUCR is the most upregulated intergenic TUCR in gliomas and is predicted to bind nucleic acids.
A) Box- and dotplot showing that uc.110 is 30-fold upregulated in GBM and ~60-fold upregulated in LGG based on TCGA and GTEx data analyses. Red boxes represent upregulated TUCRs. B) Box- and dotplot showing that uc.110 is expressed in tumors but is poorly expressed in normal brain cortex based on TCGA and GTEx data analyses. C) Cartoon showing that uc.110 is a 243 nt region in a 2,158 nt transcript. D) Heatmap depicting uc.110 gene module association. Positive correlations are red, while negative correlations are blue, with weak correlations in white. Modules with no linkage are gray. E) Scatter plots depicting uc.110 association with top 3 positive (top row) and negative (bottom row) correlation modules. Caption lists the module name, number of genes in the module, and the significance of uc.110 association with the module.
Figure 4.
Figure 4.. The uc.110 TUCR operates as an oncogene.
A) Bar graph depicting uc.110 upregulation in banked UVA GBM tumors versus normal brain cortex. B) Boxplot representing uc.110 expression in pooled tumors versus normal brain. Red boxes indicate an upregulated TUCR. C) Bar graph depicting qPCR validation of uc.110 siRNA knockdown and rescue in A172 and U251 cell lines. Facets represent cell lines. si-SCR = scrambled control siRNA (red), si-uc. 110-1 = siRNA targeting uc. 110 at nucleotide 96/243 (green), si-uc.110-2 = siRNA targeting uc.110 at nucleotide 195/243 (blue). D) Line graph showing that knockdown of uc.110 reduces A172 and U251 cell accumulation over a 5–7 day period. Facets represent cell lines. E) Bar graph depicting that the cell accumulation phenotype is rescued when uc.110 is overexpressed in the presence of siRNA. Facets represent cell lines. Images are representative of the listed sample. F) Bar graph showing that knockdown of uc.110 reduces A172 and U251 cell viability via Alamar Blue assay and can be rescued with uc.110 overexpression. Facets represent cell lines. G) Bar graph showing that knockdown of uc.110 reduces GSC-34 glioma stem cell viability via Alamar Blue. H) Bar graph showing knockdown of uc.110 reduces A172 and U251 cell invasion and migration. Images are representative of the listed sample. I) Bar graph showing the qPCR validation of overexpression in U87 cells. J) Bar graph showing that overexpression of uc.110 increases cell accumulation in U87 and GSC-28 cells. Facets represent cell lines. * = p < 0.05
Figure 5.
Figure 5.. The uc.110 TUCR promotes tumor growth in vivo.
A) MRI images reveal a reduction in tumor size when uc.110 is knocked down via siRNAs. B) Bar graph showing that knockdown of uc.110 leads to a reduction in tumor volume. si-SCR = scrambled control siRNA (red), si-uc.110-1 = siRNA targeting uc. 110 at nucleotide 96/243 (green), si-uc.110-2 = siRNA targeting uc.110 at nucleotide 195/243 (blue). C) Kaplan-Meier plot showing that knockdown of uc.110 leads to increased mouse survival.
Figure 6.
Figure 6.. The uc.110 TUCR activates Wnt-signaling by sponging miR-544 from membrane frizzled related protein (MFRP) 3’UTR.
A) Volcano plot depicting transcriptome deregulation in RNA-Seq data on A172 GBM cells transfected with si-uc.110. Purple dots represent genes that are significantly deregulated >= 2-fold. Blue dots represent genes that are significantly deregulated. Pink dots represent genes that are deregulated >= 2-fold. Gray dots are neither deregulated nor significant. B) Dot plot showing that, of the genes that are predicted miR-544 targets, MFRP is the only gene that is upregulated in GBM Tumors and downregulated when uc.110 is downregulated. Purple dots represent predicted miR-544 targets that are deregulated in A172 cells from 6A and TCGA RNA-Seq data. Pink dots represent predicted miR-544 targets that are deregulated in A172s from 6A only. C) Bar graph showing that miR-544 transfection reduces cell accumulation in A172, T98G, and U251 cells, confirming its tumor suppressor role. Facets represent cell lines. si-SCR = scrambled control siRNA (red), si-uc. 110-2 = siRNA targeting uc.110 at nucleotide 195/243 (blue). miR-544 = miR-544 (yellow). D) Bar graph showing that transfection with miR-544 or si-uc.110-2 reduces uc.110 and MFRP expression. Facets represent genes and cell lines. * = p < 0.05
Figure 7.
Figure 7.. The uc.110 TUCR activates Wnt-signaling by sponging miR-544 from membrane frizzled related protein (MFRP) 3’UTR.
A) Schematic depicting the uc.110 luciferase construct used to demonstrate binding to miR-544 and si-uc.110-2. Binding of miR-544 to binding sites (orange) leads to a degradation of construct and a reduction in Renilla signal (Green) B) Schematic depicting the MFRP luciferase construct used to demonstrate binding miR-544. C) Schematic depicting miR-544 binding site mutations for uc.110 (two sites) and MFRP (one site). Top row represents wild-type binding sites. Middle row is the miR-544 binding region. Bottom row are mutated sites. D) Bar graph showing that transfection of miR-544 reduces uc.110 and MFRP luciferase expression signal in A172 and E) U251 glioma cells, and that mutating miR-544 binding sites rescues luciferase signal. Facets represent cell lines and miR-544 binding site mutation status. F) Schematic depiction of TCF/LEF luciferase reporter construct used to measure downstream Wnt-signaling pathway activation. TCF/LEF binds to the reporter region (green) and activates luciferase (yellow). F) Bar graph showing that transfection of si-uc.110-2 and miR-544 reduces TCF/LEF reporter signal in A172 and H) U251 glioma cells. Signal is rescued when uc.110 is overexpressed in the presence of siRNA or miR-544. * = p< 0.05 the letters.

Similar articles

References

    1. Bejerano G., et al., Ultraconserved elements in the human genome. Science, 2004. 304(5675): p. 1321–5. - PubMed
    1. Gibert M.K. Jr., et al., Transcribed Ultraconserved Regions in Cancer Cells, 2022. 11(10). - PMC - PubMed
    1. Calin G.A. and Croce C.M., Chronic lymphocytic leukemia: interplay between noncoding RNAs and protein-coding genes. Blood, 2009. 114(23): p. 4761–70. - PMC - PubMed
    1. Calin G.A., et al., Ultraconserved regions encoding ncRNAs are altered in human leukemias and carcinomas. Cancer Cell, 2007. 12(3): p. 215–29. - PubMed
    1. Colwell M., et al., Evolutionary conservation of DNA methylation in CpG sites within ultraconserved noncoding elements. Epigenetics, 2018. 13(1): p. 49–60. - PMC - PubMed

Publication types

LinkOut - more resources