. 2024 Apr 29;15(1):3637.
doi: 10.1038/s41467-024-47430-1.

Antigen presentation plays positive roles in the regenerative response to cardiac injury in zebrafish

Affiliations

Antigen presentation plays positive roles in the regenerative response to cardiac injury in zebrafish

João Cardeira-da-Silva et al. Nat Commun. .

Abstract

In contrast to adult mammals, adult zebrafish can fully regenerate injured cardiac tissue, and this regeneration process requires an adequate and tightly controlled immune response. However, which components of the immune response are required during regeneration is unclear. Here, we report positive roles for the antigen presentation-adaptive immunity axis during zebrafish cardiac regeneration. We find that following the initial innate immune response, activated endocardial cells (EdCs), as well as immune cells, start expressing antigen presentation genes. We also observe that T helper cells, a.k.a. Cd4+ T cells, lie in close physical proximity to these antigen-presenting EdCs. We targeted Major Histocompatibility Complex (MHC) class II antigen presentation by generating cd74a; cd74b mutants, which display a defective immune response. In these mutants, Cd4+ T cells and activated EdCs fail to efficiently populate the injured tissue and EdC proliferation is significantly decreased. cd74a; cd74b mutants exhibit additional defects in cardiac regeneration including reduced cardiomyocyte dedifferentiation and proliferation. Notably, Cd74 also becomes activated in neonatal mouse EdCs following cardiac injury. Altogether, these findings point to positive roles for antigen presentation during cardiac regeneration, potentially involving interactions between activated EdCs, classical antigen-presenting cells, and Cd4+ T cells.


Conflict of interest statement

The authors declare no competing interests.

Figures
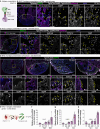
Fig. 1
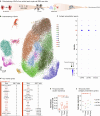
Fig. 1. Antigen presentation genes are activated in leukocytes and endocardial cells during zebrafish cardiac regeneration.
a Schematic illustration of the classical model of MHC class II antigen presentation and the activation of CD4+ T cells. b Confocal images of a cryosectioned ventricle from an adult Tg(cd74a:Gal4ff); Tg(UAS:NTR-mCherry); Tg(mpeg1:EGFP) zebrafish at 120 hpci, immunostained for mCherry and EGFP, showing cd74a:mCherry expression in macrophages (yellow arrowheads); two independent experiments with similar results. c Confocal images of a cryosectioned ventricle from an adult Tg(cd74a:Gal4ff); Tg(UAS:NTR-mCherry) zebrafish at 120 hpci, immunostained for mCherry and Aldh1a2, showing cd74a:mCherry expression also in activated EdCs (yellow arrowheads); two independent experiments with similar results. d Confocal images of cryosectioned ventricles from Tg(mhc2dab:EGFP) uninjured adult zebrafish and at various time points after cryoinjury, immunostained for EGFP and Aldh1a2, showing transgene expression in activated EdCs (yellow arrowheads, EGFPhigh; white arrows, EGFPlow), especially starting at 120 hpci; two independent experiments with similar results. eh Experimental design (e) and graphs showing the relative mRNA levels of the antigen presentation genes mhc2a (f), cd74a (g), and cd74b (h) in the absence of injury and at various time points after injury in sorted Et(krt4:EGFP)+ EdCs, revealing an initial decrease in expression upon cryoinjury followed by an increase starting at 120 hpci. Dots in the graphs represent individual ventricles, and the bars represent the mean ± SD; n = 3 biologically independent samples for all time points; two-tailed Welch’s t test between 72 and 120 hpci (P values included in the graphs); Ct values included in Supplementary Table 6. Yellow dashed rectangles and squares outline the magnified areas; dashed lines mark the border of the injured tissue. Scale bars: 100 µm (low magnification); 20 µm (high magnification). UI uninjured, APC antigen-presenting cell, MHC II major histocompatibility complex class II.
Fig. 2
Fig. 2. One endocardial cell subcluster exhibits an antigen presentation and immune-like transcriptome.
a Experimental design for subclustering analysis of EdCs from a published scRNA-seq dataset of the whole regenerating zebrafish heart. b UMAP plot showing 12 different EdC subclusters. c Dot plot showing enriched expression of antigen presentation genes in at least subcluster 10. d List of top 40 marker genes in subcluster 10, showing strong enrichment in immune-related genes (red). Wilcoxon Rank Sum Test; adjusted P value based on Bonferroni correction. e Box plot showing the increased relative abundance of cells in subcluster 10 during regeneration compared with uninjured; box plot represents the median, Q1, Q3, the minimum, and the maximum; dots represent potential outliers; n = 5, 10, 13, 5 independent datasets for UI, 72 hpci, and 7 and 14 dpci, respectively (see); one-way ANOVA (P value included in the graph). f Plot showing the average expression of antigen presentation genes within subcluster 10 at different time points, revealing increased levels during regeneration. UI uninjured.
Fig. 3
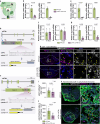
Fig. 3. Cd4+ T cells are present in the injured cardiac tissue and associate with the activated endocardium.
a Confocal images of representative cryosectioned ventricles from adult TgBAC(cd4-1:mCherry) zebrafish at various time points after cryoinjury, immunostained for mCherry, showing Cd4+ T cells in the injured tissue (yellow arrowheads). b Quantification of total cd4-1:mCherry+ cells within the injured tissue, showing a peak at 7 dpci. Dots in the graph represent individual ventricles, and the bars represent the mean ± SD; n = 3 (24 hpci), 3 (72 hpci), 3 (96 hpci), 5 (120 hpci), 3 (6 dpci), 5 (7 dpci), 4 (14 dpci), and 3 (30 dpci) biologically independent samples; one-way ANOVA (P = 0.0003) and Tukey’s post hoc test for multiple comparisons; P values included in the graph; full list of multiple comparisons in Supplementary Table 3. c Confocal images of representative cryosectioned ventricles from adult TgBAC(cd4-1:mCherry) zebrafish at various time points after cryoinjury, immunostained for mCherry and Aldh1a2, revealing the close association of Cd4+ T cells (yellow arrowheads) with activated EdCs (green). Yellow dashed squares outline the magnified areas; dashed lines mark the border of the injured tissue. Scale bars: 100 µm in (a) and (c) (low magnification); 20 µm in c (high magnification).
Fig. 4
Fig. 4. cd74a; cd74b mutants exhibit reduced Cd4+ T cell infiltration of the injured cardiac tissue.
a Schematic showing the involvement of CD74 in MHC class II antigen presentation. b, c Schematics of the cd74a (b) and cd74b (c) wild-type and mutant alleles (bns454 and bns456) depicting the wild-type gene structure, location of the mutations, primers used for genotyping, nucleotide deletions (red) and the predicted resulting proteins, highlighting the different domains. The numbers mark the nucleotide positions in the respective coding sequences. Asterisks mark the mutation site. dg Relative mRNA levels of cd74a (d), cd74b (e), the antigen presentation gene mhc2a (f) and the lymphoid gene rag2 (g) in wild-type and cd74a; cd74b mutant ventricles at 72 hpci and 7 dpci. Ct values included in Supplementary Table 7. h Confocal images of representative cryosectioned ventricles from adult TgBAC(cd4-1:mCherry) wild-type and cd74a; cd74b mutant zebrafish at 7 dpci, immunostained for mCherry, showing a reduction in the infiltration of Cd4+ T cells (yellow arrowheads) in the central part of the injured tissue in double mutants; yellow dashed squares outline the magnified areas shown on the right and these areas were used to quantify the data depicted in j; dashed lines mark the border of the injured tissue. i, j Quantification of total cd4-1:mCherry+ cells within the whole (i) or central (j) region of the injured tissue of wild types and cd74a; cd74b mutants. Dots in the graphs represent individual ventricles, and the bars represent the mean ± SD; n = 4 (wild type and cd74a; cd74b mut.) biologically independent samples for 72 hpci and 3 (wild type) and 4 (cd74a; cd74b mut.) for 7 dpci in dg, and 8 (wild type) and 7 (cd74a; cd74b mut.) biologically independent samples in i, j; two-tailed Welch’s t test (P values included in the graphs). k Confocal images of representative cryosectioned ventricles from adult TgBAC(cd4-1:mCherry) wild-type and cd74a; cd74b mutant zebrafish at 7 dpci, immunostained for mCherry and Aldh1a2, showing apparently unchanged physical proximity between activated EdCs and Cd4+ T cells. Scale bars: 100 µm (low magnification); 20 µm (high magnification). Green and gray boxes in b and c represent exons and UTRs, respectively. aa amino acids, MHC II Major Histocompatibility Complex Class II, Fw forward primer, Rv reverse primer, kb kilobase pairs, bp base pairs.
Fig. 5
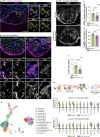
Fig. 5. The immune response is hampered in cd74a; cd74b mutants.
a Experimental design for bulk RNA-seq analysis of injured ventricles from wild types and cd74a; cd74b mutants at 120 hpci. b Volcano plot showing differentially expressed genes (FC ≥ 2; FDR < 0.05). Blue and red dots represent genes down- and upregulated, respectively, in cd74a; cd74b mutants compared with wild types. Blue and red values represent the number of significantly down- and upregulated genes, respectively; Wald test, corrected for multiple testing using the Benjamini-Hochberg method. c, d Heat maps showing the relative expression of genes encoding known immune-related factors (c), and proteins involved in T cell activation and survival (d) in individual samples. eg Gene enrichment analyses showing significantly regulated Gene Ontology terms (e), Reactome (f) and KEGG pathways; immune-related processes and pathways marked in red. FDR false discovery rate, FC fold change, WT wild-type samples, Mut cd74a; cd74b mutant samples.
Fig. 6
Fig. 6. Endocardial regeneration is compromised in cd74a; cd74b mutants.
a Confocal images of a representative cryosectioned adult zebrafish ventricle at 7 dpci, immunostained for pERK and Aldh1a2, showing pERK accumulation in EdCs (yellow arrowheads). Two independent experiments with similar results. bd Confocal images of representative cryosectioned adult zebrafish ventricles at 7 dpci (c), and quantification of the percentage of pERK+ area within the injured tissue (c) and of the depth of pERK+ cells into the injured tissue (d), showing an overall reduction in cd74a; cd74b mutants compared with wild types. Yellow dashed arrows in (b) show the two distances measured to calculate the occupancy of pERK+ EdCs within the injured tissue quantified in (d). e, f Images of representative cryosectioned ventricles from 7 dpci EdU-treated adult zebrafish immunostained for Wif1 (e) and quantification of proliferating Wif1+ EdCs in the injured tissue (f; arrowheads in e). g Experimental design for scRNA-seq analysis of all cells from the border zone and injured tissue of wild types and cd74a; cd74b mutants at 120 hpci. h UMAP plot showing the clustering analysis of the scRNA-seq data containing all wild-type and cd74a; cd74b mutant cells. i, j Violin plots of representative genes revealing an overall reduction in the stress response of cd74a; cd74b mutant EdCs in both clusters 13 (i) and 14 (j). Full list of differentially expressed genes and statistical information can be found in Supplementary Data 3. Dots in the graphs represent individual ventricles, and the bars represent the mean ± SD; n = 8 (wild type) and 12 (cd74a; cd74b mut.) biologically independent samples in c, d and 7 (wild type) and 8 (cd74a; cd74b mut.) biologically independent samples in (f); two-tailed Welch’s t test (P values included in the graphs). Yellow dashed square and rectangles outline the magnified areas; dashed lines mark the border of the injured tissue. Scale bars: 100 µm (low magnification); 20 µm (high magnification).
Fig. 7
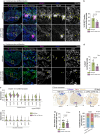
Fig. 7. Cardiomyocyte regeneration is compromised in cd74a; cd74b mutants.
a, b Images of representative cryosectioned adult zebrafish ventricles at 120 hpci, immunostained for Mef2 and N2.261 (a), showing dedifferentiating cardiomyocytes (yellow arrowheads), and respective quantification (b), showing a significant decrease in cd74a; cd74b mutants. c, d Images of representative cryosectioned ventricles from 7 dpci EdU-treated adult zebrafish, immunostained for Mef2 (c), showing proliferating cardiomyocytes (yellow arrowheads), and respective quantification (d), showing a decrease in cd74a; cd74b mutants. Yellow dashed rectangles outline the magnified areas; dashed lines mark the border of the injured tissue. e Violin plots of representative genes revealing an overall reduction in the expression of markers of cardiomyocyte function and dedifferentiation and of glycolytic enzymes in cd74a; cd74b mutant cardiomyocytes (cluster 12 from scRNA-seq in Fig. 6). Full list of differentially expressed genes and statistical information can be found in Supplementary Data 4. f Brightfield images of representative cryosectioned ventricles at 60 dpci, stained with AFOG, revealing the scar tissue by the collagen staining (blue) and tissue constrictions close to the injured tissue (arrowhead). g Quantification of scar size, showing no significant difference between wild type and cd74a; cd74b mutants. h Quantification of tissue constriction index, showing increased severity in cd74a; cd74b mutants compared with wild type. Scoring categories are exemplified in f. n = 19 wild types and 17 cd74a; cd74b mutants; the graph in h shows the percentage calculated based on the observed frequency; white numbers represent the counts per category. Dots in the bar graphs represent individual ventricles, and the bars represent the mean ± SD; n = 5 (wild type) and 7 (cd74a; cd74b mut.) biologically independent samples in (b) and 6 (wild type and cd74a; cd74b mut.) biologically independent samples in (d); two-tailed Welch’s t test (P values included in the graphs) in b, d, g; Fisher’s exact test in (h), using observed frequency values. Scale bars: 100 µm (low magnification); 20 µm (high magnification).
Fig. 8
Fig. 8. Proposed model for the role of MHC class II antigen presentation during zebrafish cardiac regeneration.
The model depicts the crosstalk between antigen presentation gene-expressing EdCs, Cd4+ T cells, and classical APCs, including macrophages. The activity of these cells promotes endocardial and myocardial regeneration.

Similar articles

Cited by

References

    1. Roth GA, et al. Global burden of cardiovascular diseases and risk factors, 1990-2019: update from the GBD 2019 study. J. Am. Coll. Cardiol. 2020;76:2982–3021. doi: 10.1016/j.jacc.2020.11.010. - DOI - PMC - PubMed
    1. Talman V, Ruskoaho H. Cardiac fibrosis in myocardial infarction - from repair and remodeling to regeneration. Cell Tissue Res. 2016;365:563–581. doi: 10.1007/s00441-016-2431-9. - DOI - PMC - PubMed
    1. Anzai A, Ko S, Fukuda K. Immune and inflammatory networks in myocardial infarction: current research and its potential implications for the clinic. Int. J. Mol. Sci. 2022;23:5214. doi: 10.3390/ijms23095214. - DOI - PMC - PubMed
    1. Cheng B, Chen HC, Chou IW, Tang TWH, Hsieh PCH. Harnessing the early post-injury inflammatory responses for cardiac regeneration. J. Biomed. Sci. 2017;24:7. doi: 10.1186/s12929-017-0315-2. - DOI - PMC - PubMed
    1. Mallat Z, Binder CJ. The why and how of adaptive immune responses in ischemic cardiovascular disease. Nat. Cardiovasc. Res. 2022;1:431–444. doi: 10.1038/s44161-022-00049-1. - DOI - PMC - PubMed

Publication types

MeSH terms

Substances