. 2024 Apr 29;22(4):e3002575.
doi: 10.1371/journal.pbio.3002575. eCollection 2024 Apr.

Bruno 1/CELF regulates splicing and cytoskeleton dynamics to ensure correct sarcomere assembly in Drosophila flight muscles

Affiliations

Bruno 1/CELF regulates splicing and cytoskeleton dynamics to ensure correct sarcomere assembly in Drosophila flight muscles

Elena Nikonova et al. PLoS Biol. .

Abstract

Muscles undergo developmental transitions in gene expression and alternative splicing that are necessary to refine sarcomere structure and contractility. CUG-BP and ETR-3-like (CELF) family RNA-binding proteins are important regulators of RNA processing during myogenesis that are misregulated in diseases such as Myotonic Dystrophy Type I (DM1). Here, we report a conserved function for Bruno 1 (Bru1, Arrest), a CELF1/2 family homolog in Drosophila, during early muscle myogenesis. Loss of Bru1 in flight muscles results in disorganization of the actin cytoskeleton leading to aberrant myofiber compaction and defects in pre-myofibril formation. Temporally restricted rescue and RNAi knockdown demonstrate that early cytoskeletal defects interfere with subsequent steps in sarcomere growth and maturation. Early defects are distinct from a later requirement for bru1 to regulate sarcomere assembly dynamics during myofiber maturation. We identify an imbalance in growth in sarcomere length and width during later stages of development as the mechanism driving abnormal radial growth, myofibril fusion, and the formation of hollow myofibrils in bru1 mutant muscle. Molecularly, we characterize a genome-wide transition from immature to mature sarcomere gene isoform expression in flight muscle development that is blocked in bru1 mutants. We further demonstrate that temporally restricted Bru1 rescue can partially alleviate hypercontraction in late pupal and adult stages, but it cannot restore myofiber function or correct structural deficits. Our results reveal the conserved nature of CELF function in regulating cytoskeletal dynamics in muscle development and demonstrate that defective RNA processing due to misexpression of CELF proteins causes wide-reaching structural defects and progressive malfunction of affected muscles that cannot be rescued by late-stage gene replacement.


Conflict of interest statement

The authors have declared that no competing interests exist.

Figures
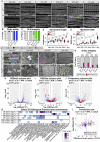
Fig 1
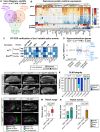
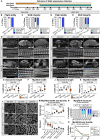
Fig 1. bru1 mutant flight muscle displays misregulated sarcomere protein expression and progressively severe phenotypes during myofibril maturation.
(A) Single-plane confocal images from thorax hemi-sections of w1118 and bru1M3 at 48 hour (h), 60 h, 72 h, 80 h, 90 h APF and 1 d adult flies. Phalloidin stained actin, gray; scale bar = 5 μm. (B) Quantification of flight ability. N > 30 flies for each genotype. (C) Quantification of myofiber phenotypes. N > 40 myofibers from 10 flies for each genotype. (D, E) Quantification of the sarcomere length (D) and myofibril width (E) from (A). Sarcomeres in control w1118 flies grow significantly in length from 2.0 ± 0.1 at 48 h APF to 2.9 ± 0.2 μm at 90 h APF (ANOVA, p < 0.001), while sarcomeres in bru1M3 do not (2.1 ± 0.1 to 2.2 ± 0.3 μm; ANOVA, p = 0.96). At 60 h APF, bru1M3 myofibrils are significantly wider than in wild type (0.99 ± 0.2 versus 0.66 ± 0.04 μm, ANOVA, p < 0.001). bru1M3 myofibrils significantly increase in width from 0.48 ± 0.06 at 48 h APF to 1.03 ± 0.26 μm at 90 h APF (ANOVA, p < 0.001). From 80 h APF to 1 d adult, bru1M3 sarcomeres shorten (2.3 ± 0.2 to 2.1 ± 0.2 μm; ANOVA, p = 0.009), while w1118 sarcomeres grow (2.5 ± 0.2 to 3.3 ± 0.1 μm; ANOVA, p < 0.001). Myofibril width increases more from 80 h APF to 1 d adult in bru1M3 (1.1 ± 0.3 μm to 2.4 ± 0.4 μm; ANOVA, p < 0.001) than in w1118 (0.76 ± 0.04 to 1.0 ± 0.1 μm; ANOVA, p = 0.002). Boxplots are shown with Tukey whiskers, outlier data points marked as black dots. Significance determined by ANOVA and post hoc Tukey (ns, not significant; **, p < 0.01; ***, p < 0.001). (F) TEM images of w1118 and bru1M3 sarcomere ultrastructure at 48 h, 60 h, 72 h, and 90 h APF. Defects in bru1M3 are already apparent at 48 h APF. Z-discs, “Z”; myofibril splitting and discontinuous Z-discs, white arrows; cytoplasm or mitochondrial inclusions, white asterisks; scale bar = 1 μm. (G) Quantification of Z-disc integrity in (F). N > 20 single planes for each individual genotype and time point. (H, I) mRNA-Seq volcano plots of DESeq2 gene expression (H) and DEXSeq exon use (I) changes in 1 d adult bru1M3-/- versus w1118 IFM. SPs are notably affected (red dots). Gray boxes denote a threshold of abs(log2 fold-change) ≥ 1 and p ≤ 0.05, with significant events colored blue. (J) Volcano plot of peptide group expression (J) changes in bru1-/- IFM from 1 d adults. Gray boxes denote a threshold of abs(Difference) ≥ 1 and p ≤ 0.05, significant peptides are colored blue. (K) Heatmap of select significantly enriched biological process GO terms in the DE genes, exons and proteins. (L) Dot plot of the correlation between significantly DE peptide groups and their corresponding mRNA expression level in bru1-/- versus w1118 IFM. Proteins with a significantly DE exon (DEXSeq) are colored orange, and those significantly DE at the gene level (DESeq2) are colored purple. The Pearson’s/Spearman’s correlation coefficients (top left corner) and regression line (blue) indicate a weak but positive correlation. Underlying data can be found in S1 Table and Fig 1 Source Data files as listed in S6 Table. APF, after puparium formation; DE, differentially expressed; GO, gene ontology; IFM, indirect flight muscle; SP, sarcomere protein; TEM, transmission electron microscopy.
Fig 2
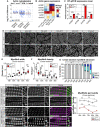
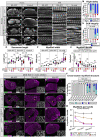
Fig 2. Misexpression of muscle-type-specific protein isoforms results in hypercontraction and abnormal contractile dynamics in bru1-/- IFM.
(A) Venn diagram of the overlap between SPs differentially expressed at the gene level (purple), the protein level (green) or that have differentially used exons (orange). (B) Hierarchical clustering and heat map of the coordinated changes in SP gene expression (top, DESeq2 log2FC), exon use (middle, top 10 DEXSeq log2FC values), and protein expression (bottom, Perseus Difference of the top 3 protein groups). Black dot denotes p ≤ 0.05. (C) Summary heatmap of semi-quantitative RT-PCR results (S2 Fig) verifying muscle-type specificity of select alternative splice events in Strn-Mlck, wupA, Mhc, Zasp52, sls, and Tm1 in wild-type fly muscles, and loss or gain of those events in bru1M3 IFM (not detected by PCR, white; detected by PCR, blue; weak band, light blue; strong band, dark blue). (D) Boxplot of gene, exon, and protein-level expression changes in genes with associated hypercontraction phenotypes (S1 and S2 Tables). Significantly DE proteins in bru1M3 IFM are labeled; blue dot denotes p ≤ 0.05. (E–J) Confocal Z-stack images of DLM myofibers in w1118, bru1M3 and bru1M3, Mhc [10] from 1 d and 3 d adults. Myofiber loss and hypercontraction in bru1-/- IFM is alleviated in the Mhc [10] background (G, J). Thorax boundaries in (F), dashed line; phalloidin stained actin, gray; scale bar = 100 μm. (K) Quantification of myofiber tearing and detachment phenotypes from (E–J) at 90 h APF, 1 d and 3 d adults. N > 40 myofibers from at least 10 flies for each individual genotype and time point. (L) Snapshots from live movies of Talin-YPet labeled DLMs at 48 h and 72 h APF from w1118 and bru1M3 animals. Time 0.0 (magenta) is overlaid with time +0.65 s (green; at 48 h APF) or +16 s (green; at 72 h APF). A complete overlap (white) depicts no movement. Scale bar = 50 μm. (M) Quantification of distance of maximum myofiber extension at 48 h APF in control and bru1M3. Boxplots are shown with Tukey whiskers, significance by unpaired t test (***, p < 0.001). (N) Quantification of spontaneous contraction events per fiber per 10 min in control and bru1M3. At 72 h APF, bru1M3 DLM fibers continue to undergo slow, unidirectional extension. N > 50 fibers/10 animals for each genotype and time point. Error bars = SEM. Underlying data can be found in S2 Table and Fig 2 Source Data files as listed in S6 Table. APF, after puparium formation; DE, differentially expressed; DLM, dorsal-longitudinal myofiber; IFM, indirect flight muscle; SP, sarcomere protein.
Fig 3
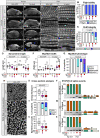
Fig 3. Hollow myofibril formation in bru1 mutants is an active process resulting from defective expression and splicing of cytoskeletal genes and aberrant sarcomere growth.
(A) Boxplot of gene, exon, and protein level expression changes between 1 d adult bru1-/- and w1118 IFM in genes from GO term “actin cytoskeleton.” Blue dot denotes p ≤ 0.05. (B) Heatmap of actin gene expression in bru1-IR, bru1M3, leg and TDT as compared to wild-type IFM. (C) RT-qPCR verification of Actin gene expression levels between bru1M3 and wild-type w1118 IFM. (D) Confocal micrographs of DLM myofibril cross-sections in w1118 and bru1M3 at 48 h, 60 h, 72 h, 80 h, 90 h APF, and 1 d adult. Phalloidin stained actin, gray; scale bar = 5 μm. (E, F) Quantification of myofibril width (E) and density (F) in (D). bru1M3 mutant myofibrils are significantly wider than in wild type at 48 h APF (0.48 ± 0.04 μm versus 0.37 ± 0.02 μm, ANOVA p = 0.001), and there are fewer myofibrils (0.76 ± 0.02 μm versus 1.4 ± 0.2 myofibrils per μm2, ANOVA p < 0.001). Boxplots are shown with Tukey whiskers, outlier data points marked as black dots. Significance determined by ANOVA with post hoc Tukey (**, p < 0.01; ***, p < 0.001). (G) Quantification of myofibril structural morphology in (D). bru1M3 myofibrils progressively form hook and ring structures starting from 60 h APF. N > 10 animals per genotype and time point. Error bars = SEM. (H–I”) Deconvoluted confocal images at 90 h APF of Fln-Gal4 driven UASp-GFP-Actin88F incorporation into control (H-H”) and bru1M3 (I-I”) sarcomeres. Both xy- and zy-projections are shown. Fln-Gal4 expression from approximately 56 h APF results in a box-like pattern of GFP-Act88F incorporation (H’-H”) into growing wild-type sarcomeres, which is abnormal in bru1M3 (I’-I”). GFP, green; phalloidin stained actin, magenta; scale bar = 5 μm. (J–K”) Deconvoluted confocal images at 90 h APF of Mhc-weeP26-GFP incorporation into control (J-J”) and bru1M3 (K-K”) sarcomeres. Expression of GFP-labeled Mhc isoforms containing exon 37 is restricted to early developmental stages in IFM, resulting in a dot-like pattern flanking the M-line in wild-type sarcomeres (J’-J”) which is disrupted in bru1M3 (K’-K”). weeP26-GFP, green; phalloidin stained actin, magenta; scale bar = 5 μm. (L) Quantification of myofibril number per fiber bundle in w1118 and bru1M3 at 48 h, 60 h, 72 h, 80 h, and 90 h APF. There is a significant reduction from 60 h to 80 h APF in bru1M3 (45 ± 9 to 24 ± 5 myofibrils per bundle, ANOVA, p < 0.001) but not in w1118 IFM (69 ± 15 to 68 ± 14 myofibrils per bundle, ANOVA, p = 0.30). Plot represents the mean ± SEM. Significance determined by ANOVA and post hoc Tukey (ns, not significant; **, p < 0.01). N > 8 animals per genotype and time point. Underlying data can be found in Fig 3 Source Data and the RNA-Seq data tables as listed in S6 Table. APF, after puparium formation; DLM, dorsal-longitudinal myofiber; GO, gene ontology; IFM, indirect flight muscle.
Fig 4
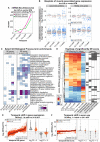
Fig 4. Knockdown of bru1 disrupts temporal dynamics of gene expression and alternative splicing necessary for maturation of flight muscle.
(A) Plot of the number of genes (magenta) and exons (green) significantly differentially expressed (p ≤ 0.05, abs(log2FC) ≥ 2) in bru1-IR versus control IFM at 24 h, 30 h, 72 h APF, and in 1 d adult. (B) Boxplot of changes in gene expression (DESeq2) and exon use (DEXSeq) in sarcomere proteins and fibrillar muscle genes across the bru1-IR IFM time course. Blue dot denotes p ≤ 0.05. (C) Heatmap of select Biological Process GO term enrichments in significantly regulated genes (DESeq2, p-adj ≤ 0.05) and exons (DEXSeq, p-val ≤ 0.05) in bru1-IR IFM at 24 h, 30 h, 72 h APF, or in 1 d adult, or at all 4 time points. (D) Heatmap (left) of all exons significantly DE (DEXSeq, p-val ≤ 0.05) at all time points in bru1-IR versus control IFM. The fifth column shows the temporal change in use of the same exons in w1118 IFM from 24 h APF to 1 d adult. Exons are identified as belonging to ribosomal subunit, microtubule associated, contractile fiber, sarcomere proteins, or myosin complex gene categories (right, black boxes). (E) Left: Plot of the log2FC values of all genes differentially expressed (DESeq2, p-adj ≤ 0.05) in w1118 IFM (black dots) from 24 h APF to 1 d adult, ordered by control log2FC, and the corresponding change in the same genes in bru1-IR IFM (orange dots). Right: Violin plots comparing control (gray) and bru1-IR (orange) expression of strongly up-regulated (log2FC ≥ 2) and down-regulated (log2FC ≤ -2) temporal-switch genes. (F) Left: Plot of the log2FC value of all exons differentially expressed (DEXSeq, p-val ≤ 0.05) in w1118 IFM (black dots) from 24 h APF to 1 d adult, and the corresponding change in those same exons in bru1-IR IFM (orange dots). Right: Violin plots comparing exon use of strongly up-regulated (log2FC ≥ 2) and down-regulated (log2FC ≤ -2) temporal-switch exons in control (gray) and bru1-IR (orange) IFM. Underlying data can be found in S3 Table and the RNA-Seq data tables as listed in S6 Table. APF, after puparium formation; GO, gene ontology; IFM, indirect flight muscle.
Fig 5
Fig 5. Early cytoskeletal rearrangement and myofiber compaction are abnormal in bru1 mutant IFM.
(A) Confocal images of DLM cross-sections at 24 h APF. Phalloidin stained F-actin (gray) reveals progressive condensation of the actin network into cables (arrow head) near the sarcolemma in w1118, but a meshwork (arrow) in bru1M3. Scale bar = 10 μm. (B) Quantification of actin network structure in (A). N > 10 for each genotype. (C) Cross-section time-course of early cytoskeletal rearrangements and pre-myofibril formation in w1118 and bru1M3 at 24 h, 26 h, 28 h, 30 h, 32 h, and 34 h APF. Scale bar = 5 μm. Irregular actin condensation at 24 h and cable splitting at 26 h and 28 h APF is evident in bru1M3, prior to pre-myofibril formation at 30–32 h APF. (D) Quantification of actin cable number per myotube in w1118 and bru1M3 at 26 h and 28 h APF. Significance determined by ANOVA and post hoc Tukey (ns, not significant; ***, p-val < 0.001). (E, F) Quantification of myofibril width (E) and density (F) in w1118 and bru1M3 at 30 h, 32 h, and 34 h APF. The first sarcomere growth defects in bru1M3 are already detected at 34 h APF, when the pre-myofibrils are fully formed. Significance determined by ANOVA and post hoc Tukey (ns, not significant; **, p-val < 0.01; ***, p-val < 0.001). All boxplots are shown with Tukey whiskers, outlier data points marked as black dots. (G) Confocal Z-stack images of DLMs in w1118 and bru1M3 at 24 h, 30 h, 40 h, and 48 h APF. DLM fibers undergo compaction at 30 h APF, followed by re-extension and fiber growth. Phalloidin stained actin, gray; scale bar at 24, 30 h APF = 50 μm, at 40, 48 h APF = 100 μm. (H) Quantification of the DLM fiber length in (G). bru1M3 DLM fibers fail to fully compact. Significance determined by ANOVA and post hoc Tukey (ns, not significant; *, p-val < 0.05; ***, p-val < 0.001). Underlying data can be found in Fig 5 Source Data as listed in S6 Table. APF, after puparium formation; DLM, dorsal-longitudinal myofiber; IFM, indirect flight muscle.
Fig 6
Fig 6. Temporally restricted RNAi demonstrates a functional requirement for Bru1 during early myogenesis.
(A) Scheme of Him-Gal4 and UH3-Gal4 expression timing during IFM myogenesis. Gradient color of the bar indicates the strength of expression. Time points as marked. (B) Quantification of flight ability in Him-Gal4 driven bru1-IR (bru1-IRHim) (N > 130). (C) Quantification of myofiber ripping and detachment phenotypes in control and bru1-IRHim at 90 h APF and 1 d adult (N > 40). (D) Confocal projections of control and bru1-IRHim hemithoraxes (upper, scale bar = 100 μm) and single-plane images of myofibrils (lower, scale bar = 5 μm) in control (top) and bru1-IRHim (bottom) at 48 h and 90 h APF and 1 d adult. (E, F) Quantification of sarcomere length (E) and myofibril width (F) from (D). Boxplots are shown with Tukey whiskers, outlier data points marked as black dots. Significance determined by ANOVA and post hoc Tukey (ns, not significant; ***, p-val < 0.001). (G) Quantification of flight ability in UH3-Gal4 driven bru1-IR (bru1-IRUH3) (N > 110). (H) Quantification of myofiber integrity in control and bru1-IRUH3 at 90 h APF and 1 d adult (N > 40). (I) Confocal projections of hemithoraxes (upper, scale bar = 100 μm) and single-plane images of myofibrils (lower, scale bar = 5 μm) in control (top) and bru1-IRUH3 (bottom) at 48 h and 90 h APF and 1 d adult. The severity of the bru1-RNAi associated myofibril phenotype is comparable between (D) and (I). (J, K) Quantification of sarcomere length (J) and myofibril width (K) from (I). Significance determined by ANOVA and post hoc Tukey (ns, not significant; ***, p-val < 0.001). (L) Single-plane cross-section images of DLM myofibrils in control w1118, bru1-IRHim, and bru1-IRUH3 at 48 h, 72 h, and 90 h APF. Scale bar = 5 μm. (M) Quantification of myofibril width (top) and density (bottom) in (L). Significance determined by ANOVA and post hoc Tukey (ns, not significant; ***, p-val < 0.001). (N) Quantification of myofibril structure from (L), showing the ratio of normal dot morphology (white) to abnormal hook (cyan) and ring (blue) structures. Fewer hooks and rings form in early expressed bru1-IRHim as compared to bru1-IRUH3. Error bars = SEM. (O) Quantification of mean myofibril number per bundle in (L). bru1-IRUH3 IFM forms the correct number of myofibrils while bru1-IRHim IFM does not, but myofibril fusion is more extensive after 48 h APF in bru1-IRUH3. bru1-IRUH3 IFM have a near wild-type number of 62 ± 12 myofibrils per bundle at 48 h APF, but by 72 h APF the number of 26 ± 6 myofibrils per bundle is less than the 32 ± 7 observed with bru1-IRHim. Error bars = SEM. F-actin in (D, I, L) stained with phalloidin. Underlying data can be found in Fig 6 Source Data as listed in S6 Table. APF, after puparium formation; DLM, dorsal-longitudinal myofiber; IFM, indirect flight muscle.
Fig 7
Fig 7. Expression of Bru1 restricted to early myogenesis fails to rescue and exacerbates bru1M3 myofibril phenotypes.
(A–L”) Confocal projections of hemithorax (scale bar = 100 μm) and single-plane images of myofibril structure (scale bar = 5 μm) in control (A–C”); Bru1 overexpression (Him-Gal4 > UAS-Bru1, D–F”); early temporal rescue (Him-Gal4 > UAS-Bru1, bru1M3/M3, G–I”); and mutant bru1M3 (J–L”). Time points at 48 h, 90 h APF and 1 d adult as labeled. Phalloidin stained actin, gray. (M, N) Quantification of flight ability (M) and DLM fiber integrity (N) in (B, E, H, K). Genotypes are denoted by symbols: wild type, white square; bru1M3, red square; Him-Gal4, tan triangle; UAS-Bru1, magenta diamond. N > 40 fibers for each genotype. (O, P) Quantification of sarcomere length (O) and myofibril width (P) in (C, F, I, L). Boxplots are shown with Tukey whiskers, outlier data points marked as black dots. Significance determined by ANOVA and post hoc Tukey (ns, not significant; *, p-val < 0.05; **, p-val < 0.01; ***, p-val < 0.001). (Q–T”) Single-plane cross-section images of myofibril structure at 48 h, 72 h, and 90 h APF in control (Q–Q”), Bru1 overexpression (R–R”), early temporal rescue (S–S”), and mutant bru1M3 IFM (T–T”). Magnified image of selected area (white rectangle) shown in lower right corner. Overexpression of Bru1 with Him-Gal4 produces holes in the center of IFM myofibers (yellow asterisks) and cannot rescue later formation of hollow myofibrils; DAPI, green; phalloidin stained actin, magenta; scale bar = 10 μm (Q–T, Q’–T’), 20 μm (Q”–T”) and 5 μm (zoom-in sections). (U, V) Quantification of myofibril density (U) and myofibril structure (V) in (Q–T”). Genotypes, boxplot, and significance as above. Error bars in V = SEM. (W) Quantification of mean myofibril number per fiber bundle in (Q–T”). Him-Gal4 driven Bru1 can partially rescue the number of myofibrils formed in bru1M3 myofibers before 48 h APF, but cannot rescue myofibril fusion and hollow myofibril formation after 48 h APF. Error bars = SEM. Underlying data can be found in Fig 7 Source Data as listed in S6 Table. APF, after puparium formation; DLM, dorsal-longitudinal myofiber; IFM, indirect flight muscle.
Fig 8
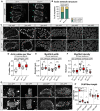
Fig 8. Expression of Bru1 restricted to late myogenesis partially rescues bru1M3 myofibril phenotypes and restores alternative splicing defects.
(A–L’) Confocal projections of hemithorax and single-plane images of myofibril structure at 90 h APF and 1 d adult in control (A–C’); Bru1 overexpression (Fln-Gal4 > UAS-Bru1, D-F’); late temporal rescue (Fln-Gal4 > UAS-Bru1, bru1M3/M3, G-I’); and mutant bru1M3 (J–L’). The severity of myofiber detachment and torn myofibril phenotypes is partially rescued in Fln-Gal4 > UAS-Bru1, bru1M3 IFM. Dashed line outlines the thorax boundary in (K). Frayed (cyan), degenerate (blue), or degraded (purple) myofibrils, arrowheads; Phalloidin stained actin, gray; scale bar = 100 μm (thorax); scale bar = 5 μm (IFM). (M, N) Quantification of flight ability (M) and DLM fiber integrity (N) in (B, E, H, K) (N > 50). Genotypes are denote by symbols: wild type, white square; bru1M3, red square; Fln-Gal4, orange triangle; UAS-Bru1, magenta diamond. (O, P) Quantification of sarcomere length (O) and myofibril width (P) in (C–L’). Boxplots are shown with Tukey whiskers, outlier data points marked as black dots. Significance determined by ANOVA and post hoc Tukey (ns, not significant; **, p-val < 0.01; ***, p-val < 0.001). (Q) Quantification of myofibril phenotypes present in (C’–L’) (N > 70). (R) Single-plane cross-section images of myofibril structure in DLM from control, late temporal rescue, and mutant bru1M3 at 90 h APF. Phalloidin stained actin, gray; scale bar = 5 μm. (S–U) Quantification of cross-section myofibril density (S), myofibril structure (T), and number of myofibrils per bundle (U) in (R). Fewer hollow myofibrils (rings) develop in Fln-Gal4 > UAS-Bru1, bru1M3 IFM by 90 h APF. Significance determined as above, error bars in (T) = SEM. (V–X) Semi-quantitative RT-PCR verification of Bru1 regulated alternative splice events in Strn-Mlck (V), sls (W), and wupA (X). Representative gel images and quantification of percent exon use in control fibrillar IFM, tubular leg and jump (tergal depressor of the trochanter, TDT) muscle, and mutant bru1M3 or late rescue Fln-Gal4 > UAS-Bru1, bru1M3 IFM. Error bars = SD. Scheme on the right of alternative isoforms with primer locations, color coding consistent between scheme and bar plot. 3′-UTR regions in light beige. Exon numbering according to FB2021_05. Underlying data can be found in Fig 8 Source Data and Gels as listed in S6 Table. APF, after puparium formation; DLM, dorsal-longitudinal myofiber; IFM, indirect flight muscle.

Similar articles

References

    1. Nikonova E, Kao SY, Spletter ML. Contributions of alternative splicing to muscle type development and function. Semin Cell Dev Biol. 2020. Feb 15. doi: 10.1016/j.semcdb.2020.02.003 - DOI - PubMed
    1. Schiaffino S, Reggiani C. Fiber types in mammalian skeletal muscles. Physiol Rev. 2011. Oct;91(4):1447–531. doi: 10.1152/physrev.00031.2010 - DOI - PubMed
    1. Crocini C, Gotthardt M. Cardiac sarcomere mechanics in health and disease. Biophys Rev. 2021. Oct;13(5):637–52. doi: 10.1007/s12551-021-00840-7 - DOI - PMC - PubMed
    1. Tharp C, Mestroni L, Taylor M. Modifications of Titin Contribute to the Progression of Cardiomyopathy and Represent a Therapeutic Target for Treatment of Heart Failure. J Clin Med. 2020. Aug 26;9(9):2770. doi: 10.3390/jcm9092770 - DOI - PMC - PubMed
    1. Linke WA. Titin Gene and Protein Functions in Passive and Active Muscle. Annu Rev Physiol. 2018. 10;80:389–411. doi: 10.1146/annurev-physiol-021317-121234 - DOI - PubMed

Publication types

MeSH terms

Grants and funding

The funders played no role in study design, data collection and analysis, decision to publish, or preparation of the manuscript. Funding was provided by the Deutsche Forschungsgemeinschaft (MLS, 417912216, https://www.dfg.de/), the Deutsche Gesellschaft für Muskelkranke e.V. (MLS, 8225310, https://www.dgm.org/), the University of Missouri Kansas City (MLS, new faculty funds, https://sse.umkc.edu/), and the International Max Planck Research School for Molecular and Cellular Life Sciences (EN, https://imprs-ls.opencampus.net/).

LinkOut - more resources