. 2024 Apr 10;27(5):109704.
doi: 10.1016/j.isci.2024.109704. eCollection 2024 May 17.

MHC class I-dressing is mediated via phosphatidylserine recognition and is enhanced by polyI:C

Affiliations

MHC class I-dressing is mediated via phosphatidylserine recognition and is enhanced by polyI:C

Arisa Hori et al. iScience. .

Abstract

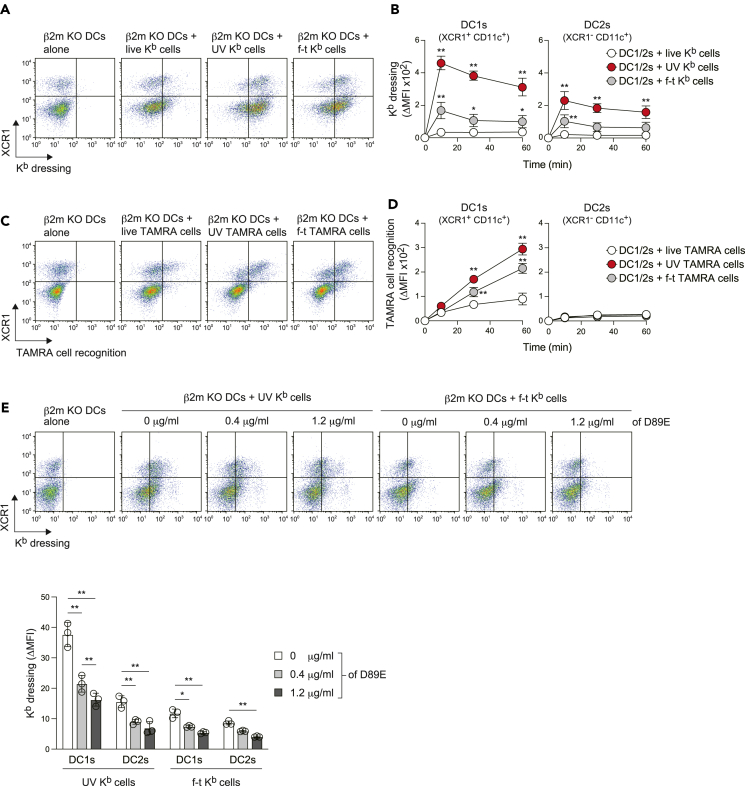
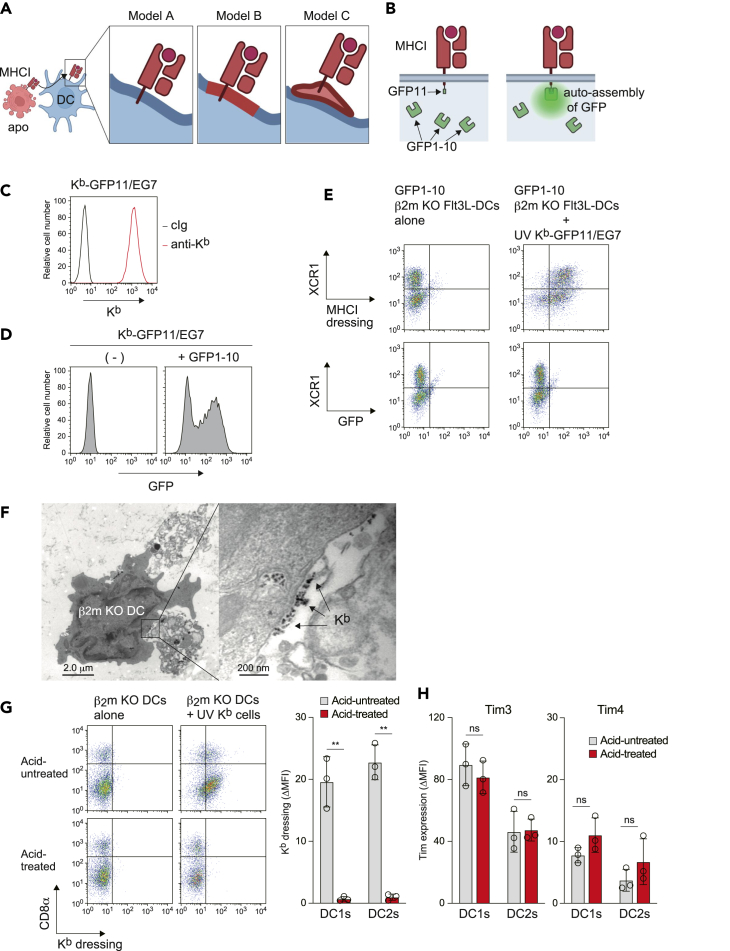
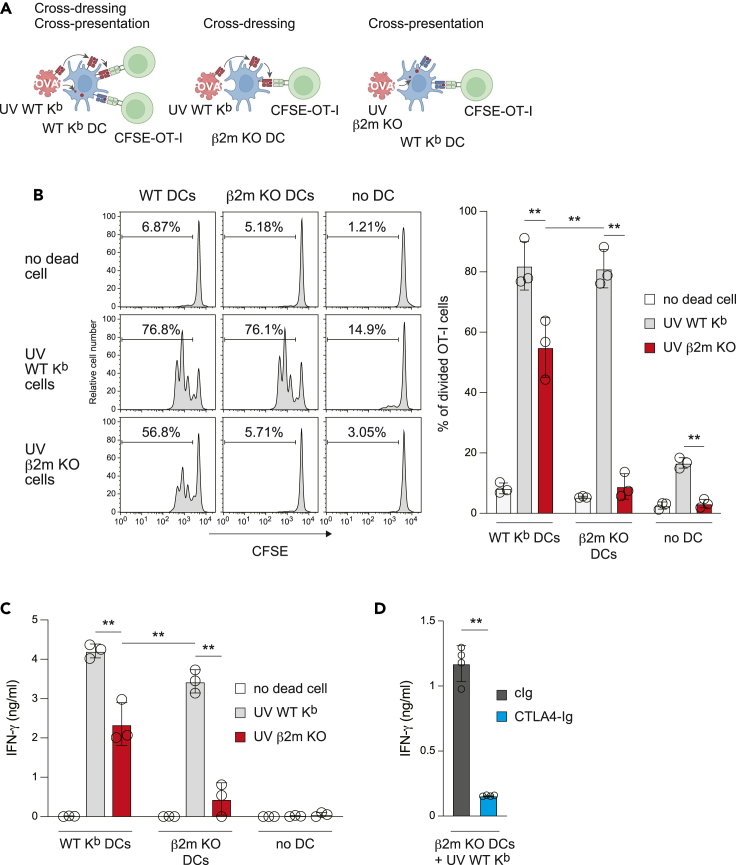
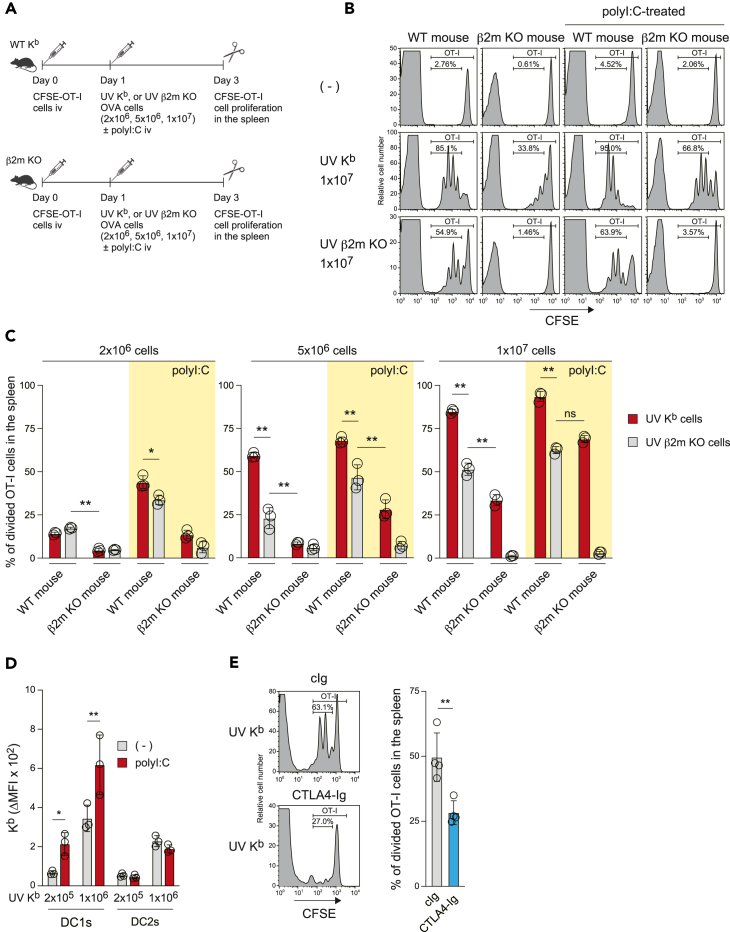
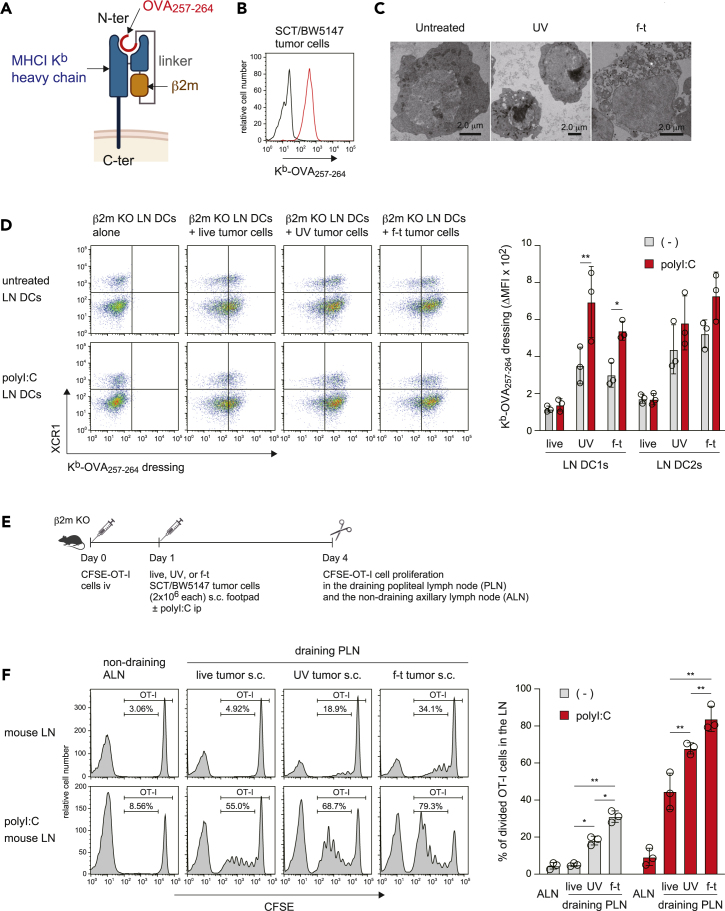
In addition to cross-presentation, cross-dressing plays an important role in the induction of CD8+ T cell immunity. In the process of cross-dressing, conventional dendritic cells (DCs) acquire major histocompatibility complex class I (MHCI) from other cells and subsequently prime CD8+ T cells via the pre-formed antigen-MHCI complexes without antigen processing. However, the mechanisms underlying the cross-dressing pathway, as well as the relative contributions of cross-presentation and cross-dressing to CD8+ T cell priming are not fully understood. Here, we demonstrate that DCs rapidly acquire MHCI-containing membrane fragments from dead cells via the phosphatidylserine recognition-dependent mechanism for cross-dressing. The MHCI dressing is enhanced by a TLR3 ligand polyinosinic-polycytidylic acid (polyI:C). Further, polyI:C promotes not only cross-presentation but also cross-dressing in vivo. Taken together, these results suggest that cross-dressing as well as cross-presentation is involved in inflammatory diseases associated with cell death and type I IFN production.

Keywords: Cell biology; Components of the immune system; Immunology.


Conflict of interest statement

The authors declare no competing interests.

Figures

None
Graphical abstract
Figure 1
Figure 1
DCs rapidly acquire MHCI from dead cells upon PtdSer recognition (A and B) β2m KO mouse splenic DCs (1 × 105) were cultured with live, UV-irradiated, or freeze-thawed (f-t) WT MHCI H-2Kb (Kb) mouse splenocytes (5 × 105 each) for 10 min (A) or the indicated periods (B) in a microtube. In (A), splenic DCs (CD11c+ cells) were gated as shown in Figure S1A and the Kb acquisition was analyzed by flow cytometry. In (B), the median fluorescence intensity (MFI) of Kb on DC1s (XCR1+ CD11c+) and DC2s (XCR1- CD11c+) was analyzed, and the ΔMFI was calculated by subtracting MFI of Kb on each subset from MFI of Kb on the untreated subset as in Figure S1D. Data are shown as mean ± SD (n = 3 independent pools, where 2 mouse spleens were pooled; with a total of 6 mice per group) in (B). ∗p < 0.05, ∗∗p < 0.01 compared with live cells at each time point, by two-way ANOVA. (C and D) β2m KO mouse splenic DCs (1 × 105) were cultured with tetramethylrhodamine (TAMRA)-labeled live, UV-irradiated, or f-t Kb splenocytes (5 × 105 each) for 60 min (C) or the indicated time periods (D) in a microtube. The recognition (binding and engulfment) of TAMRA-labeled cells by DC1s and DC2s was analyzed by flow cytometry. The ΔMFI in (D) was calculated as in Figure S1D. Data are shown as mean ± SD (n = 3 independent pools, where 2 mouse LNs were pooled; with a total of 6 mice per group) in (D). ∗∗p < 0.01 compared with live cells at each time point, by two-way ANOVA. (E) UV-irradiated or f-t Kb mouse splenocytes pretreated with the indicated concentration of MFG-E8 mutant D89E for 30 min, were cultured with β2m KO mouse splenic DCs. Kb acquisition by DC1s and DC2s was analyzed as in (A). The graph shows individual value (dots), mean (columns), and SD (error bars) (n = 3 independent pools, where 2 mouse LNs were pooled; with a total of 6 mice per group). ∗p < 0.05, ∗∗p < 0.01, by two-way ANOVA. See also Figures S1 and S2.
Figure 2
Figure 2
MHCI-containing membrane fragments are associated with the DC plasma membrane (A) The three hypothesized models of DC dressing of MHCI. In model A, donor MHCI is expressed on recipient DC plasma membrane. In model B, donor MHCI-containing membrane is fused with recipient DC plasma membrane. In model C, donor MHCI-containing membrane vesicle binds DC plasma membrane. (B) Principle of split-GFP system. The non-fluorescent GFP11 subunit is fused to the cytoplasmic domain of Kb. In models A and B (A), donor cell-derived GFP11 is assembled with GFP1-10 in the cytosol of recipient DCs, resulting in the formation of fluorescent GFP chromophores. (C) Kb expression on Kb-GFP11/EG7 cells was analyzed by flow cytometry. (D) GFP1-10 gene was transiently transduced into Kb-GFP11/EG7 cells and the auto-assembly of GFP was analyzed by flow cytometry. (E) Flt3 ligand (Flt3L)-derived β2m KO mouse DCs were transduced with GFP1-10, and then these DCs (1 × 105) were cultured with UV-irradiated Kb-GFP11/EG7 cells (1 × 105) for 10 min in a microtube. Kb acquisition and GFP expression in Flt3L-DCs (CD11c+ cells) were analyzed by flow cytometry. (F) β2m KO mouse splenic DCs cultured with UV-irradiated Kb cells were stained with biotinylated anti-Kb, followed by streptavidin-10 nm gold particles. Cells were analyzed by transmission electron microscopy (TEM). See also Figure S2D. (G) β2m KO mouse splenic DCs were cultured with UV-irradiated Kb splenocytes as in Figure 1A. These cells were then cultured in PBS or citric acid buffer for 4 min at 20°C. Kb acquisition by splenic DCs (CD11c+ cells) was analyzed by flow cytometry. The ΔMFI of Kb on DC1s (CD8α+ CD11c+ cells) and DC2s (CD8α CD11c+ cells) was calculated as in Figure S1D. The graph shows individual value (dots), mean (columns), and SD (error bars) (n = 3 independent pools). ∗∗p < 0.01, two-way ANOVA. (H) β2m KO mouse splenic DCs were cultured in PBS or citric acid buffer for 4 min at 20°C. Expression of Tim3 and Tim4 on DC1s and DC2s were analyzed, and the ΔMFI was calculated as in Figure S1D. The graph shows individual value (dots), mean (columns), and SD (error bars) (n = 3 independent pools). ns, non-significant, two-way ANOVA.
Figure 3
Figure 3
Relative contributions of cross-dressing and cross-presentation to CD8+ T cell proliferation in vitro (A) The experimental model of the in vitro antigen-presentation assay. (B) CFSE-labeled OT-I T cells (2 × 105 per well) were co-cultured with indicated splenic DCs (1 × 105 per well) with UV-irradiated and OVA-loaded splenocytes (1 × 105 per well) in 96-well plates for 2 days. OT-I T cell proliferation (CFSE intensity in TCR Vβ5+ cells) was analyzed by flow cytometry. Numbers in histograms indicate the percentage of divided OT-I T cells. The graph shows individual value (dots), mean (columns), and SD (error bars) (n = 3 independent replicates). ∗∗p < 0.01, two-way ANOVA. (C) OT-I T cells were co-cultured with splenic DCs as in (B). Production of IFN-γ in the culture supernatants was measured by ELISA. Data are shown as individual value (dots), mean (columns), and SD (error bars) (n = 3 independent replicates). ∗∗p < 0.01, two-way ANOVA. (D) OT-I T cells (2 × 105 per well) were co-cultured with β2m KO mouse DCs (1 × 105 per well) and UV-irradiated and OVA-loaded WT mouse splenocytes (1 × 105 per well) in the presence of CTLA4-Ig or control human IgG (cIg) (1 μg/mL each) in 96-well plates. Production of IFN-γ was analyzed as in (C). Data are shown as individual value (dots), mean (columns), and SD (error bars) (n = 4 independent replicates). ∗∗p < 0.01, unpaired two-tailed Student’s t test. See also Figure S3.
Figure 4
Figure 4
Relative contributions of cross-dressing and cross-presentation to CD8+ T cell proliferation in vivo (A) Experimental procedure for the in vivo antigen-presentation assay. (B and C) WT Kb or β2m KO mice were treated as in (A). OT-I T cell proliferation (CFSE intensity in TCR Vβ5+ cells) in the spleen was analyzed by flow cytometry. In (B), numbers in histograms indicate the percentage of divided OT-I T cells in mice injected i.v. with 1 × 107 splenocytes. Histograms of the 2 × 106 or 5 × 106 groups, along with the gating strategy, are shown in Figure S4. In (C), the graph indicates individual values (dots), mean (columns), and SD (error bars) from n = 3 mice. Yellow boxes indicate polyI:C-treated mouse groups. ∗∗p < 0.01; ns, non-significant, two-way ANOVA. (D) β2m KO mice were injected intraperitoneally (i.p.) with PBS or polyI:C (200 μg/mouse). The following day, mouse splenic DCs were prepared and cultured (1 × 105 each) with the indicated number of UV-irradiated Kb splenocytes for 10 min (D) in a microtube. The Kb dressing was analyzed by flow cytometry as in Figure S5. The graph indicates individual values (dots), mean (columns), and SD (error bars) from n = 3 independent pools. ∗p < 0.05, ∗∗p < 0.01, two-way ANOVA. (E) β2m KO mice adoptively transferred with CFSE-labeled OT-I T cells were injected i.p. with cIg or CTLA4-Ig (Abatacept: 300 μg/mouse each). The following day, mice were treated with UV-irradiated and OVA-loaded Kb splenocytes (1 × 107) with polyI:C (200 μg/mouse). The polyI:C-induced cross-dressing was then analyzed as in (B). The graph indicates individual values (dots), mean (columns), and SD (error bars) from n = 4 mice. ∗∗p < 0.01, unpaired two-tailed Student’s t test.
Figure 5
Figure 5
PolyI:C drives cross-dressing with tumor cell-derived MHCI (A) Schematic diagram of single-chain trimers (SCT) engineered with OVA257-264 peptide, β2m, and Kb. (B) H-2Kk mouse T lymphoma cell line BW5147 cells were stably transduced with SCT, and the expression of SCT on the resulting SCT/BW5147 cells was analyzed by flow cytometry. Black and red histograms indicate cIg and 25-D1.16 mAb, respectively. (C) Morphology of live, UV-irradiated, or f-t SCT/BW5147 cells was analyzed by TEM. (D) β2m KO mice were injected i.p. with PBS or polyI:C (200 μg/mouse). The following day, mouse axillary, inguinal, and popliteal lymph nodes (LNs) were pooled together, and DCs were subsequently purified from the pooled LNs. These LN DCs (1 × 105 each) were cultured with live, UV-irradiated, or f-t SCT/BW5147 tumor cells (2 × 105 each) for 10 min in a microtube. The SCT acquisition by LN DCs (CD11c+ cells) was analyzed by flow cytometry as in Figure S5A. The graph indicates individual values (dots), mean (columns), and SD (error bars) from n = 3 independent pools. ∗p < 0.05, ∗∗p < 0.01, two-way ANOVA. (E) Experimental procedure for the in vivo cross-dressing assay. (F) β2m KO mice were treated as in (E). OT-I T cell proliferation (CFSE intensity in TCR Vβ5+ cells) in the LN was analyzed by flow cytometry. The graph indicates individual values (dots), mean (columns), and SD (error bars) from n = 3 mice. ∗p < 0.05, ∗∗p < 0.01, two-way ANOVA.

Similar articles

References

    1. Colbert J.D., Cruz F.M., Rock K.L. Cross-presentation of exogenous antigens on MHC I molecules. Curr. Opin. Immunol. 2020;64:1–8. - PMC - PubMed
    1. Joffre O.P., Segura E., Savina A., Amigorena S. Cross-presentation by dendritic cells. Nat. Rev. Immunol. 2012;12:557–569. - PubMed
    1. Kurts C., Robinson B.W.S., Knolle P.A. Cross-priming in health and disease. Nat. Rev. Immunol. 2010;10:403–414. - PubMed
    1. Anderson D.A., 3rd, Dutertre C.A., Ginhoux F., Murphy K.M. Genetic models of human and mouse dendritic cell development and function. Nat. Rev. Immunol. 2021;21:101–115. - PMC - PubMed
    1. Eisenbarth S.C. Dendritic cell subsets in T cell programming: location dictates function. Nat. Rev. Immunol. 2019;19:89–103. - PMC - PubMed