Precision Food Composition Data as a Tool to Decipher the Riddle of Ultra-Processed Foods and Nutritional Quality
- PMID: 38672931
- PMCID: PMC11049098
- DOI: 10.3390/foods13081259
Precision Food Composition Data as a Tool to Decipher the Riddle of Ultra-Processed Foods and Nutritional Quality
Abstract
Background: Epidemiology supports a link between ultra-processed foods (UPFs) and health, mediated mainly through the clustering of foods with suboptimal nutrient profiles within UPFs. However, successful NOVA categorization requires access to a food's ingredient list, which we hypothesized can impact both UPF identification and the link between processing and composition.
Methods: Foods (n = 4851) in the HelTH branded food composition database were classified as NOVA1-4, with or without using the ingredient lists (generic and branded approach, respectively), to identify differences in NOVA classification (chi-square test) and the estimated average nutritional composition of each NOVA group (Kruskal-Willis U test).
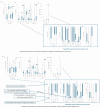
Results: Using the ingredients list increased UPF identification by 30%. More than 30% of foods commonly assumed to be minimally processed (NOVA1-plain dairy, frozen vegetables, etc.) were reclassified as UPFs when using ingredient lists. These reclassified foods, however, had nutritional compositions comparable to NOVA1 foods and better than UPFs for energy, fat, sugars, and sodium (p < 0.001). In fact, UPFs did not show a uniform nutritional composition covering foods from Nutri-Score A (~10%) to Nutri-Score E (~20%).
Conclusions: The assumption that all UPFs have the same unfavorable nutritional composition is challenged when NOVA is applied using the appropriate branded food composition database.
Keywords: NOVA; composition; food composition database; formulation; ingredients; ultra-processed foods.
Conflict of interest statement
The authors declare no conflicts of interest.
Figures


Similar articles
-
Food Allergens in Ultra-Processed Foods According to the NOVA Classification System: A Greek Branded Food Level Analysis.Nutrients. 2023 Jun 16;15(12):2767. doi: 10.3390/nu15122767. Nutrients. 2023. PMID: 37375674 Free PMC article.
-
Ultra-Processed Foods in the Mediterranean Diet according to the NOVA Classification System; A Food Level Analysis of Branded Foods in Greece.Foods. 2023 Apr 3;12(7):1520. doi: 10.3390/foods12071520. Foods. 2023. PMID: 37048341 Free PMC article.
-
Cross-Classification Analysis of Food Products Based on Nutritional Quality and Degree of Processing.Nutrients. 2023 Jul 12;15(14):3117. doi: 10.3390/nu15143117. Nutrients. 2023. PMID: 37513535 Free PMC article.
-
Ultra-Processed Foods: A Narrative Review of the Impact on the Human Gut Microbiome and Variations in Classification Methods.Nutrients. 2024 Jun 1;16(11):1738. doi: 10.3390/nu16111738. Nutrients. 2024. PMID: 38892671 Free PMC article. Review.
-
Future perspectives: Current trends and controversies of meat alternatives classified as ultra-processed foods.J Food Sci. 2024 Nov;89(11):7022-7033. doi: 10.1111/1750-3841.17355. Epub 2024 Oct 9. J Food Sci. 2024. PMID: 39385355 Review.
References
-
- Steele E.M., O’Connor L.E., Juul F., Khandpur N., Galastri Baraldi L., Monteiro C.A., Parekh N., Herrick K.A. Identifying and Estimating Ultraprocessed Food Intake in the US NHANES According to the Nova Classification System of Food Processing. J. Nutr. 2023;153:225–241. doi: 10.1016/j.tjnut.2022.09.001. - DOI - PMC - PubMed
-
- Belardo D., Michos E.D., Blankstein R., Blumenthal R.S., Ferdinand K.C., Hall K., Klatt K., Natajaran P., Ostfeld R.J., Reddy K., et al. Practical, Evidence-Based Approaches to Nutritional Modifications to Reduce Atherosclerotic Cardiovascular Disease: An American Society For Preventive Cardiology Clinical Practice Statement. Am. J. Prev. Cardiol. 2022;10:100323. doi: 10.1016/j.ajpc.2022.100323. - DOI - PMC - PubMed
Grants and funding
LinkOut - more resources
Full Text Sources

