. 2024 Mar 30;14(4):341.
doi: 10.3390/brainsci14040341.

Transcriptional Responses of Different Brain Cell Types to Oxygen Decline

Affiliations

Transcriptional Responses of Different Brain Cell Types to Oxygen Decline

Camille Ravel-Godreuil et al. Brain Sci. .

Abstract

Brain hypoxia is associated with a wide range of physiological and clinical conditions. Although oxygen is an essential constituent of maintaining brain functions, our understanding of how specific brain cell types globally respond and adapt to decreasing oxygen conditions is incomplete. In this study, we exposed mouse primary neurons, astrocytes, and microglia to normoxia and two hypoxic conditions and obtained genome-wide transcriptional profiles of the treated cells. Analysis of differentially expressed genes under conditions of reduced oxygen revealed a canonical hypoxic response shared among different brain cell types. In addition, we observed a higher sensitivity of neurons to oxygen decline, and dissected cell type-specific biological processes affected by hypoxia. Importantly, this study establishes novel gene modules associated with brain cells responding to oxygen deprivation and reveals a state of profound stress incurred by hypoxia.

Keywords: astrocyte; cerebral hypoxia; hypoxia; hypoxia gene module; hypoxia-inducible factors; microglia; neuron; oxygen deprivation.


Conflict of interest statement

The authors declare no conflicts of interest.

Figures

Figure 1
Figure 1
Culture of primary mouse brain cells and exposure to different levels of oxygen. (A): Images of mature CNS cells in culture before O2 treatment (scale bar = 50 µm); (B): PCA plots of brain cell transcriptomes at 21% O2; (C): Level of expression of brain cell makers at 21% O2; (D): Schematic of experimental plan, mature cultures of each cell type (neuron, astrocytes and microglia) were exposed to either 21, 5 or 1% of oxygen for 8 h before the RNA was extracted for sequencing; (E): level of expression of markers of hypoxia in each CNS cell type upon treatments. (****: p < 0.0001, ***: p < 0.001, **: p < 0.01, *: p < 0.05).
Figure 2
Figure 2
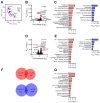
Transcriptional profile of neurons in response to different oxygen levels. (A): PCA plot of the transcriptomes of neuronal cultures under different O2 conditions; (B): Volcano plot of significantly up- and downregulated genes at 5% vs. 21% O2 (FC > 1.2); (C): Top KEGG pathways enriched in up- (left) and downregulated (right) genes at 5% vs. 21% O2; (D): Volcano plot of significantly up- and downregulated genes at 1% vs. 5% O2 (FC > 1.2); (E): Top KEGG pathways enriched in up- (left) and downregulated (right) genes at 1% vs. 5% O2; (F): Venn diagrams showing the numbers of unique and shared DEGs (upregulated in red, downregulated in blue) between the two hypoxic conditions tested; (G): Top KEGG pathways enriched in upregulated genes shared between the two hypoxic conditions tested.
Figure 3
Figure 3
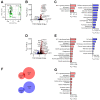
Transcriptional profile of astrocytes in response to different oxygen levels. (A): PCA plot of the transcriptomes of astrocyte cultures under different O2 conditions; (B): Volcano plot of significantly up- and downregulated genes at 5% vs. 21% O2 (FC > 1.2); (C): Top KEGG pathways enriched in up- (left) and downregulated (right) genes at 5% vs. 21% O2; (D): Volcano plot of significantly up- and downregulated genes at 1% vs. 5% O2 (FC > 1.2); (E): Top KEGG pathways enriched in up- (left) and downregulated (right) genes at 1% vs. 5% O2; (F): Venn diagrams showing the numbers of unique and shared DEGs (upregulated in red, downregulated in blue) between the two hypoxic conditions tested; (G): Top KEGG pathways enriched in upregulated genes shared between the two hypoxic conditions tested.
Figure 4
Figure 4
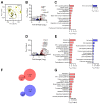
Transcriptional profile of microglia in response to different oxygen levels. (A): PCA plot of the transcriptomes of microglia cultures under different O2 conditions; (B): Volcano plot of significantly up- and downregulated genes at 5% vs. 21% O2 (FC > 1.2); (C): Top KEGG pathways enriched in up- (left) and downregulated (right) genes at 5% vs. 21% O2; (D): Volcano plot of significantly up- and downregulated genes at 1% vs. 5% O2 (FC > 1.2); (E): Top KEGG pathways enriched in up- (left) and downregulated (right) genes at 1% vs. 5% O2; (F): Venn diagrams showing the numbers of unique and shared DEGs (upregulated in red, downregulated in blue) between the two hypoxic conditions tested; (G): Top KEGG pathways enriched in upregulated genes shared between the two hypoxic conditions tested.
Figure 5
Figure 5
Distinct transcriptional profiles of hypoxia response machinery in brain cell types during normoxia and hypoxia. (A): Expression of members of the HIF family (Hif1a, Hif-2a encoded by Epas1, Hif3a, Hif-1b encoded by Arnt, and Hif-2b encoded by Arnt2), and Rest under normoxic conditions across cell types; ns: not significant (B): Expression of negative HIF regulators Vhl, and PHD1, -2, and -3 (encoded by Egln2, Egln1, and Egln3, respectively) under normoxic conditions across cell types; (C): Group-averaged relative expression of these transcripts under normoxia and reduced O2 levels. (***: p < 0.001, *: p < 0.05, ns: p > 0.05).
Figure 6
Figure 6
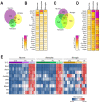
Shared transcriptional response to oxygen decline across brain cell types. (A): Venn diagram of overlapping DEGs between cell types at 5% vs. 21% O2; (B): Expression of top 20 DEGs across cell types by magnitude of fold change at 5% vs. 21% O2; (C): Venn diagram of overlapping DEGs between cell types at 1% vs. 5% O2; (D): Expression of top 20 DEGs across cell types by magnitude of fold change at 1% vs. 5% O2; (E): Relative expression of selected stress response genes across cell types at different oxygen levels.

Similar articles

References

    1. Bunn H.F., Poyton R.O. Oxygen sensing and molecular adaptation to hypoxia. Physiol. Rev. 1996;76:839–885. doi: 10.1152/physrev.1996.76.3.839. - DOI - PubMed
    1. Kumar H., Choi D.K. Hypoxia Inducible Factor Pathway and Physiological Adaptation: A Cell Survival Pathway? Mediat. Inflamm. 2015;2015:584758. doi: 10.1155/2015/584758. - DOI - PMC - PubMed
    1. Ratcliffe P.J. Oxygen sensing and hypoxia signalling pathways in animals: The implications of physiology for cancer. J. Physiol. 2013;591:2027–2042. doi: 10.1113/jphysiol.2013.251470. - DOI - PMC - PubMed
    1. Kaelin W.G., Jr., Ratcliffe P.J. Oxygen sensing by metazoans: The central role of the HIF hydroxylase pathway. Mol. Cell. 2008;30:393–402. doi: 10.1016/j.molcel.2008.04.009. - DOI - PubMed
    1. Prabhakar N.R., Semenza G.L. Adaptive and maladaptive cardiorespiratory responses to continuous and intermittent hypoxia mediated by hypoxia-inducible factors 1 and 2. Physiol. Rev. 2012;92:967–1003. doi: 10.1152/physrev.00030.2011. - DOI - PMC - PubMed

LinkOut - more resources