. 2024 Mar 28;13(4):408.
doi: 10.3390/antiox13040408.

Co-Treatment with Phlorotannin and Extracellular Vesicles from Ecklonia cava Inhibits UV-Induced Melanogenesis

Affiliations

Co-Treatment with Phlorotannin and Extracellular Vesicles from Ecklonia cava Inhibits UV-Induced Melanogenesis

Kyung-A Byun et al. Antioxidants (Basel). .

Abstract

Hyperpigmentation due to ultraviolet (UV)-induced melanogenesis causes various esthetic problems. Phlorotannin (PT) and extracellular vesicles (EVs) derived from various plants suppress melanogenesis pathways. We used UV-exposed keratinocytes and animal skin to determine if co-treatment with PT and EVs from Ecklonia cava (EVE) could inhibit melanogenesis by reducing UV-induced oxidative stress and the expression of the thioredoxin-interacting protein (TXNIP)/nucleotide-binding oligomerization domain-like receptor family pyrin domain containing the 3 (NLRP3)/interleukin-18 (IL-18) pathway, which are upstream signals of the microphthalmia-associated transcription factor. UV exposure increased oxidative stress in keratinocytes and animal skin, as evaluated by 8-OHdG expression, and this effect was reduced by co-treatment with PT and EVE. UV also increased binding between NLRP3 and TXNIP, which increased NLRP3 inflammasome activation and IL-18 secretion, and this effect was reduced by co-treatment with PT and EVE in keratinocytes and animal skin. In melanocytes, conditioned media (CM) from UV-exposed keratinocytes increased the expression of melanogenesis-related pathways; however, these effects were reduced with CM from UV-exposed keratinocytes treated with PT and EVE. Similarly, PT and EVE treatment reduced melanogenesis-related signals, melanin content, and increased basement membrane (BM) components in UV-exposed animal skin. Thus, co-treatment with PT and EVE reduced melanogenesis and restored the BM structure by reducing oxidative stress and TXNIP/NLRP3/IL-18 pathway expression.

Keywords: TXNIP/NLRP3/IL-18 pathway; extracellular vesicles from Ecklonia cava; melanogenesis; phlorotannin; ultraviolet.


Conflict of interest statement

Kyunghee Byun has received research grants from LIBON Inc. and Kyung-A Byun is employed by LIBON Inc. The remaining authors declare that the research was conducted in the absence of any commercial or financial relationships that could be construed as a potential conflict of interest. The funder was not involved in the study design, collection, analysis, interpretation of data, the writing of this article or the decision to submit it for publication.

Figures

Figure 1
Figure 1
Regulation of oxidative stress by PT and EVE in UV-exposed keratinocytes and animal skin. (A,B) The protein expression of HO-1 in UV-exposed keratinocytes following PT and EVE treatment was measured by Western blot. (C) The protein expression of 8-OHdG in UV-exposed keratinocytes following PT and EVE treatment was measured by ELISA. (D,E) The protein expression of HO-1 in UV-exposed mouse skin following PT and EVE treatment was measured by Western blot. (F) The protein expression of 8-OHdG in UV-exposed mouse skin following PT and EVE treatment was measured by ELISA. Data are presented as the mean ± SD of three independent experiments. ***, p < 0.001, first bar vs. second bar; $, p < 0.05, $$, p < 0.01, and $$$, p < 0.001, second bar vs. third, fourth, fifth bar; #, p < 0.05 and ##, p < 0.01, fifth bar vs. third, fourth bar (Mann–Whitney U test). ELISA, enzyme-linked immunosorbent assay; EVE, extracellular vesicles from E. cava; HO-1, heme oxygenase-1; MW, molecular weight; PT, phlorotannin; SD, standard deviation; UV, ultraviolet; 8-OHdG, 8-hydroxy-2′-deoxyguanosine.
Figure 2
Figure 2
Regulation of NLRP3 inflammasomes and IL-18 by PT and EVE in UV-exposed keratinocytes and animal skin. (A) Co-immunoprecipitation and protein expression of NLRP3 and TXNIP in UV-exposed keratinocytes with or without PT and EVE treatments were measured by Western blot. (B) The protein expression of ASC, pro-caspase 1, and cleaved-caspase 1 in UV-exposed keratinocytes with or without PT and EVE treatments was measured by Western blot. (C) Co-immunoprecipitation and protein expression of NLRP3 and TXNIP in UV-exposed mouse skin with or without PT and EVE treatments were measured by Western blot. (D) The protein expression of ASC, pro-caspase 1, and cleaved-caspase 1 in UV-exposed mouse skin with or without PT and EVE treatments was measured by Western blot. (E) The protein expression of IL-18 in the UV-exposed supernatant of keratinocytes with or without PT and EVE treatments was measured by ELISA. (F) The protein expression of IL-18 in UV-exposed mouse skin with or without PT and EVE treatments was measured by ELISA. Data are presented as the mean ± SD of three independent experiments. ***, p < 0.001, first bar vs. second bar; $$, p < 0.01 and $$$, p < 0.001, second bar vs. third, fourth, fifth bar; #, p < 0.05 and ##, p < 0.01, fifth bar vs. third, fourth bar (Mann–Whitney U test). ASC, apoptosis-associated speck-like protein containing a caspase recruitment domain; ELISA, enzyme-linked immunosorbent assay; EVE, extracellular vesicles from E. cava; IL-18, interleukin-18; MW, molecular weight; NLRP3, nucleotide-binding oligomerization domain-like receptor family pyrin domain containing 3; PT, phlorotannin; SD, standard deviation; TXNIP, thioredoxin-interacting protein; UV, ultraviolet.
Figure 2
Figure 2
Regulation of NLRP3 inflammasomes and IL-18 by PT and EVE in UV-exposed keratinocytes and animal skin. (A) Co-immunoprecipitation and protein expression of NLRP3 and TXNIP in UV-exposed keratinocytes with or without PT and EVE treatments were measured by Western blot. (B) The protein expression of ASC, pro-caspase 1, and cleaved-caspase 1 in UV-exposed keratinocytes with or without PT and EVE treatments was measured by Western blot. (C) Co-immunoprecipitation and protein expression of NLRP3 and TXNIP in UV-exposed mouse skin with or without PT and EVE treatments were measured by Western blot. (D) The protein expression of ASC, pro-caspase 1, and cleaved-caspase 1 in UV-exposed mouse skin with or without PT and EVE treatments was measured by Western blot. (E) The protein expression of IL-18 in the UV-exposed supernatant of keratinocytes with or without PT and EVE treatments was measured by ELISA. (F) The protein expression of IL-18 in UV-exposed mouse skin with or without PT and EVE treatments was measured by ELISA. Data are presented as the mean ± SD of three independent experiments. ***, p < 0.001, first bar vs. second bar; $$, p < 0.01 and $$$, p < 0.001, second bar vs. third, fourth, fifth bar; #, p < 0.05 and ##, p < 0.01, fifth bar vs. third, fourth bar (Mann–Whitney U test). ASC, apoptosis-associated speck-like protein containing a caspase recruitment domain; ELISA, enzyme-linked immunosorbent assay; EVE, extracellular vesicles from E. cava; IL-18, interleukin-18; MW, molecular weight; NLRP3, nucleotide-binding oligomerization domain-like receptor family pyrin domain containing 3; PT, phlorotannin; SD, standard deviation; TXNIP, thioredoxin-interacting protein; UV, ultraviolet.
Figure 3
Figure 3
Regulation of NF-κB, MMPs, and BM components by PT and EVE in UV-exposed keratinocytes and animal skin. (AC) The mRNA levels of NF-κB and MMP2/9 in UV-exposed keratinocytes with or without PT and EVE treatments were measured by qRT-PCR. (DF) The mRNA levels of NF-κB and MMP2/9 in UV-exposed mouse skin with or without PT and EVE treatments were measured by qRT-PCR. (GI) The mRNA levels of plectin, BP230, and CD151 in UV-exposed mouse skin with or without PT and EVE treatments were measured by qRT-PCR. (J) The protein expression of the BM components laminin, nidogen, and collagen type IV in UV-exposed mouse skin with or without PT and EVE treatments was measured by IHC. The dotted boxes are magnified image of the BM. Scale bar = 50 µm (black dashes). Data are presented as the mean ± SD of three independent experiments. ***, p < 0.001, first bar vs. second bar; $, p < 0.05, $$, p < 0.01 and $$$, p < 0.001, second bar vs. third, fourth, fifth bar; #, p < 0.05 and ##, p < 0.01, fifth bar vs. third, fourth bar (Mann–Whitney U test). BM, basement membrane; BP230, dystonin; EVE, extracellular vesicles from E. cava; IHC, immunohistochemistry; MMP, matrix metalloproteinase; NF-κB, nuclear factor kappa B; PT, phlorotannin; qRT-PCR, quantitative reverse-transcription polymerase chain reaction; SD, standard deviation; UV, ultraviolet.
Figure 4
Figure 4
Regulation of melanogenesis pathway signals by PT and EVE in melanocytes and UV-exposed animal skin. (A) The protein expression of pp38, p38, PKA, pCREB, CREB, MITF, and pMITF in melanocytes treated with CM from UV-exposed keratinocytes with or without PT and EVE treatments was measured by Western blot. (BD) The mRNA levels of TYR, TRP1, and TRP2 in melanocytes treated with CM from UV-exposed keratinocytes with or without PT and EVE treatments were measured by qRT-PCR. (E) The protein expression of pp38, p38, PKA, pCREB, CREB, MITF and pMITF in UV-exposed mouse skin with or without PT and EVE treatments was measured by Western blot. (FH) The mRNA levels of TYR, TRP1, and TRP2 in melanocytes with or without PT and EVE treatments were measured by qRT-PCR. Data are presented as the mean ± SD of three independent experiments. ***, p < 0.001, first bar vs. second bar; $$, p < 0.01 and $$$, p < 0.001, second bar vs. third, fourth, fifth bar; #, p < 0.05 and ##, p < 0.01, fifth bar vs. third, fourth bar (Mann–Whitney U test). CM, conditioned media; CREB, cAMP response element-binding protein; EVE, extracellular vesicles from E. cava; MITF, microphthalmia-associated transcription factor; MW, molecular weight; p, phosphorated; PBS, phosphate-buffered saline; PKA, protein kinase A; pCREB, phosphorylated CREB; pMITF, phosphorylated MITF; PT, phlorotannin; pp38, phosphorylated p38; qRT-PCR, quantitative reverse–transcription polymerase chain reaction; SD, standard deviation; TRP, tyrosinase-related protein; TYR, tyrosinase; UV, ultraviolet.
Figure 4
Figure 4
Regulation of melanogenesis pathway signals by PT and EVE in melanocytes and UV-exposed animal skin. (A) The protein expression of pp38, p38, PKA, pCREB, CREB, MITF, and pMITF in melanocytes treated with CM from UV-exposed keratinocytes with or without PT and EVE treatments was measured by Western blot. (BD) The mRNA levels of TYR, TRP1, and TRP2 in melanocytes treated with CM from UV-exposed keratinocytes with or without PT and EVE treatments were measured by qRT-PCR. (E) The protein expression of pp38, p38, PKA, pCREB, CREB, MITF and pMITF in UV-exposed mouse skin with or without PT and EVE treatments was measured by Western blot. (FH) The mRNA levels of TYR, TRP1, and TRP2 in melanocytes with or without PT and EVE treatments were measured by qRT-PCR. Data are presented as the mean ± SD of three independent experiments. ***, p < 0.001, first bar vs. second bar; $$, p < 0.01 and $$$, p < 0.001, second bar vs. third, fourth, fifth bar; #, p < 0.05 and ##, p < 0.01, fifth bar vs. third, fourth bar (Mann–Whitney U test). CM, conditioned media; CREB, cAMP response element-binding protein; EVE, extracellular vesicles from E. cava; MITF, microphthalmia-associated transcription factor; MW, molecular weight; p, phosphorated; PBS, phosphate-buffered saline; PKA, protein kinase A; pCREB, phosphorylated CREB; pMITF, phosphorylated MITF; PT, phlorotannin; pp38, phosphorylated p38; qRT-PCR, quantitative reverse–transcription polymerase chain reaction; SD, standard deviation; TRP, tyrosinase-related protein; TYR, tyrosinase; UV, ultraviolet.
Figure 5
Figure 5
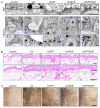
Regulation of melanin accumulation by PT and EVE treatments in UV-exposed animal skin. (A) The melanin and BM conditions were confirmed by TEM. The lamina densa (upper) and melanin content (lower) in TEM images were restored by PT and EVE treatments. The green mark represents lamina densa with disruptions or duplications (upper). The blue dotted boxes are magnified image of the lower TEM image. Scale bar = 500 nm (black dashes). (B) Melanin content was determined by Fontana Masson staining in the epidermis and dermis of mouse skin. The blue and green dotted boxes are magnified image of the fontana masson image. The blue dotted boxes are magnified image of epidermis, and the green boxes are magnified image of dermis. Scale bar = 100 µm (black dashes). (C) Skin lightness in UV-radiated mouse skin with or without PT and EVE treatments was measured. Scale bar = 500 µm (black dashes). BM, basement membrane; EVE, extracellular vesicles from E. cava; PT, phlorotannin; TEM, transmission electron microscopy; UV, ultraviolet.

Similar articles

Cited by

References

    1. Cabaço L.C., Tomás A., Pojo M., Barral D.C. The Dark Side of Melanin Secretion in Cutaneous Melanoma Aggressiveness. Front. Oncol. 2022;12:887366. doi: 10.3389/fonc.2022.887366. - DOI - PMC - PubMed
    1. Murase D., Hachiya A., Amano Y., Ohuchi A., Kitahara T., Takema Y. The essential role of p53 in hyperpigmentation of the skin via regulation of paracrine melanogenic cytokine receptor signaling. J. Biol. Chem. 2009;284:4343–4353. doi: 10.1074/jbc.M805570200. - DOI - PubMed
    1. Costin G.E., Hearing V.J. Human skin pigmentation: Melanocytes modulate skin color in response to stress. FASEB J. 2007;21:976–994. doi: 10.1096/fj.06-6649rev. - DOI - PubMed
    1. Videira I.F., Moura D.F., Magina S. Mechanisms regulating melanogenesis. An. Bras. Dermatol. 2013;88:76–83. doi: 10.1590/S0365-05962013000100009. - DOI - PMC - PubMed
    1. Yamaguchi Y., Brenner M., Hearing V.J. The regulation of skin pigmentation. J. Biol. Chem. 2007;282:27557–27561. doi: 10.1074/jbc.R700026200. - DOI - PubMed

LinkOut - more resources