. 2024 Dec;46(1):2327498.
doi: 10.1080/0886022X.2024.2327498. Epub 2024 Apr 26.

Iguratimod prevents renal fibrosis in unilateral ureteral obstruction model mice by suppressing M2 macrophage infiltration and macrophage-myofibroblast transition

Affiliations

Iguratimod prevents renal fibrosis in unilateral ureteral obstruction model mice by suppressing M2 macrophage infiltration and macrophage-myofibroblast transition

Yueyuan Zhou et al. Ren Fail. 2024 Dec.

Abstract

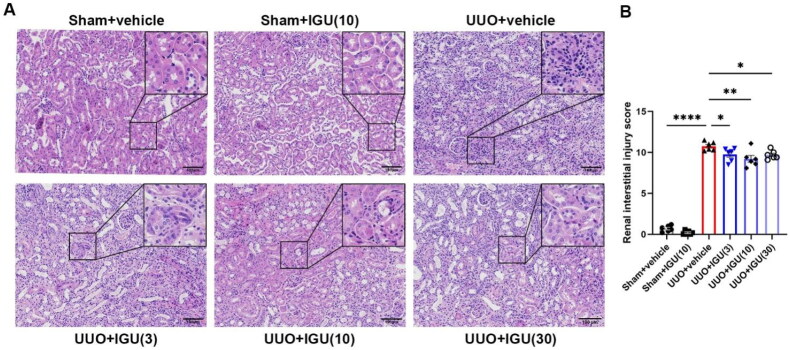
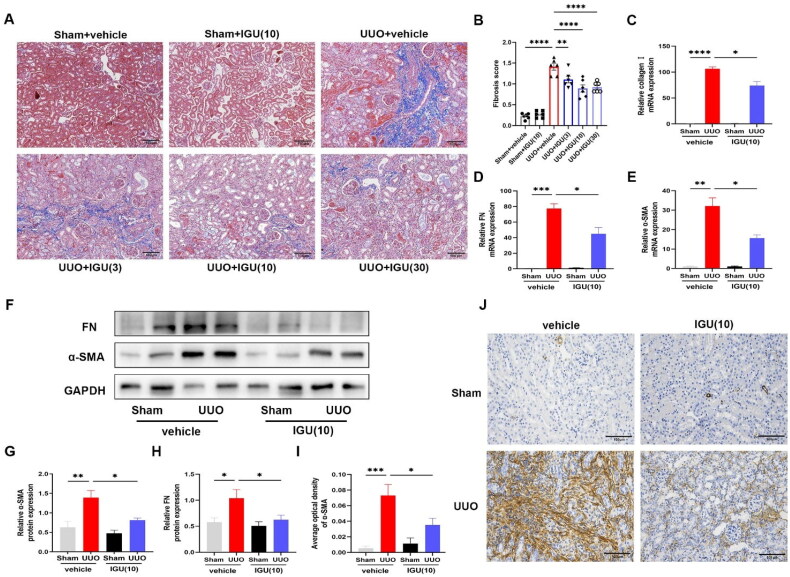
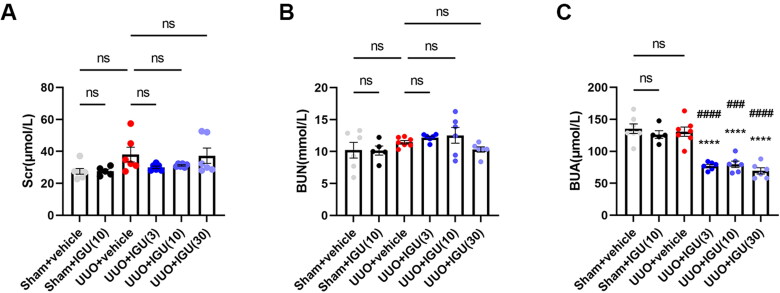
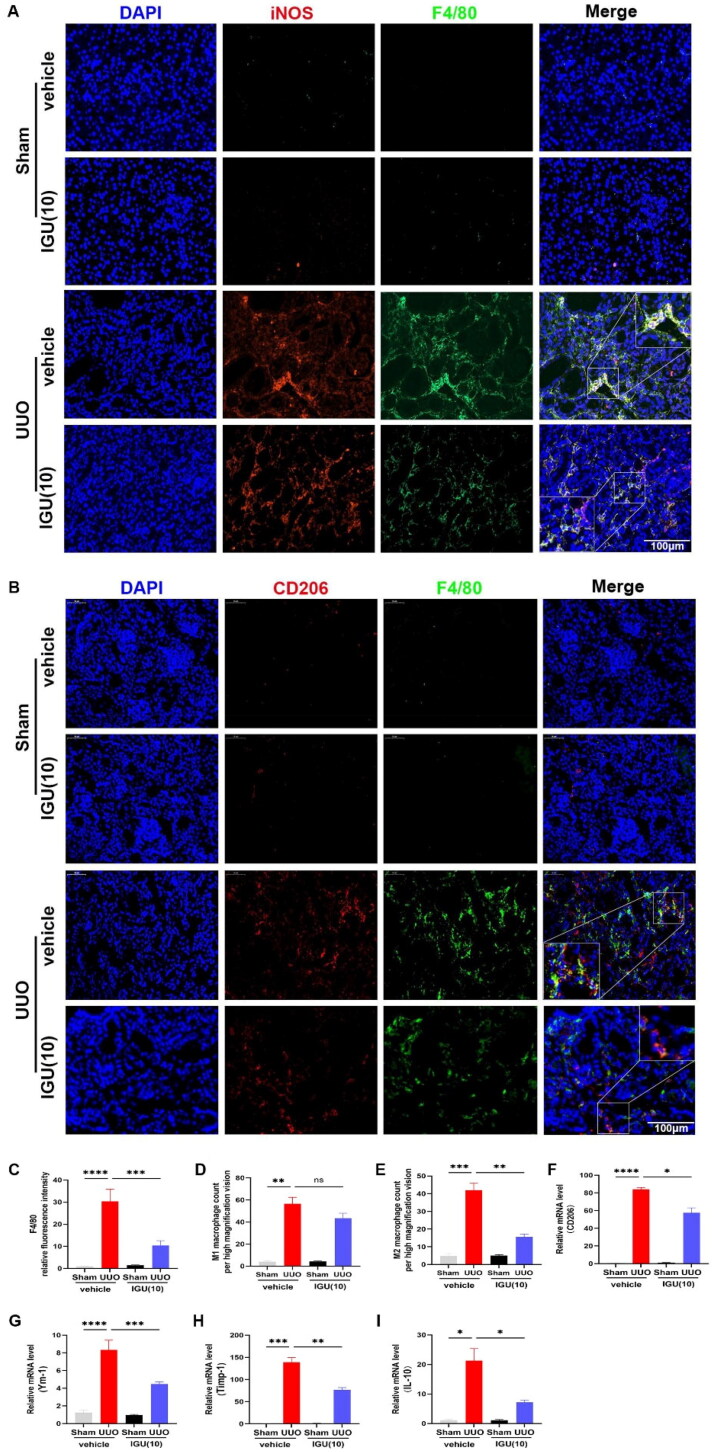
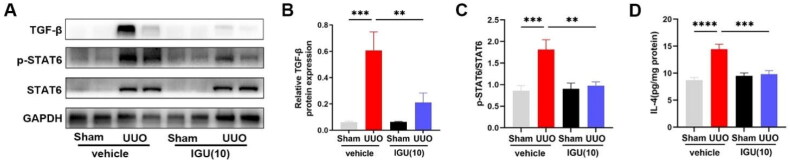
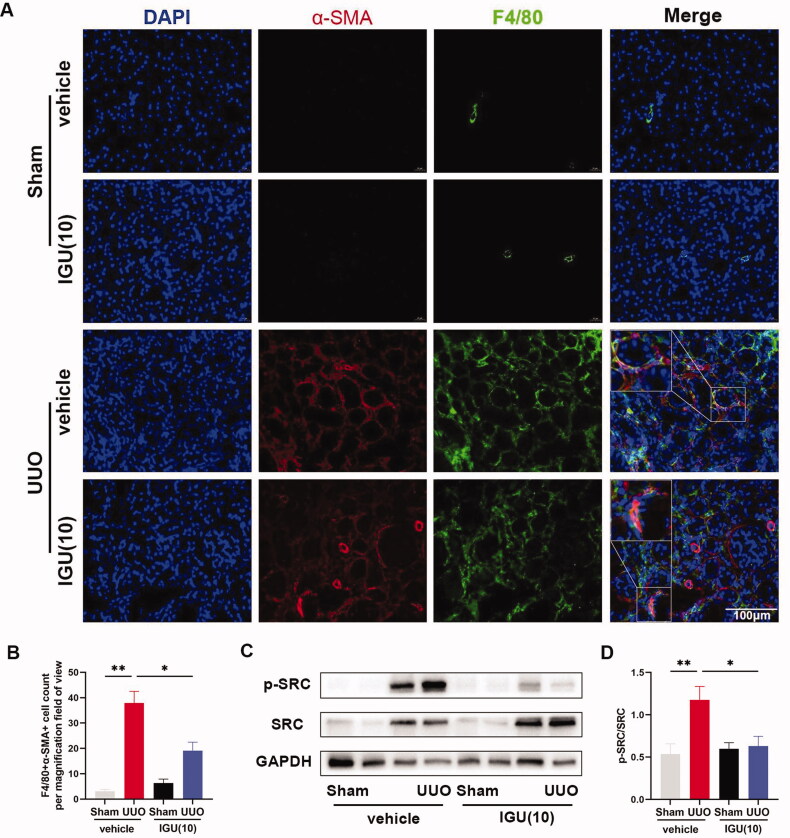
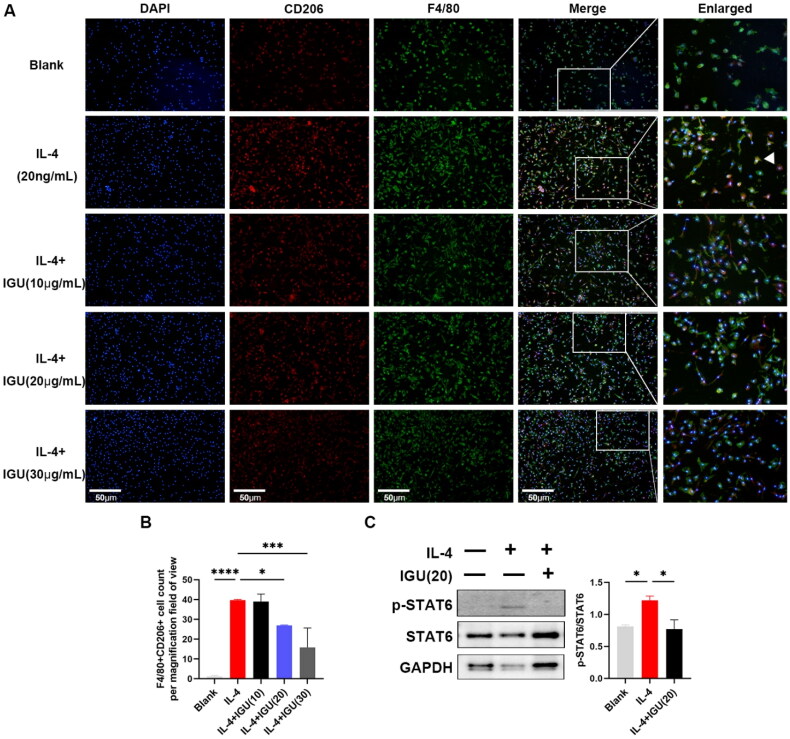
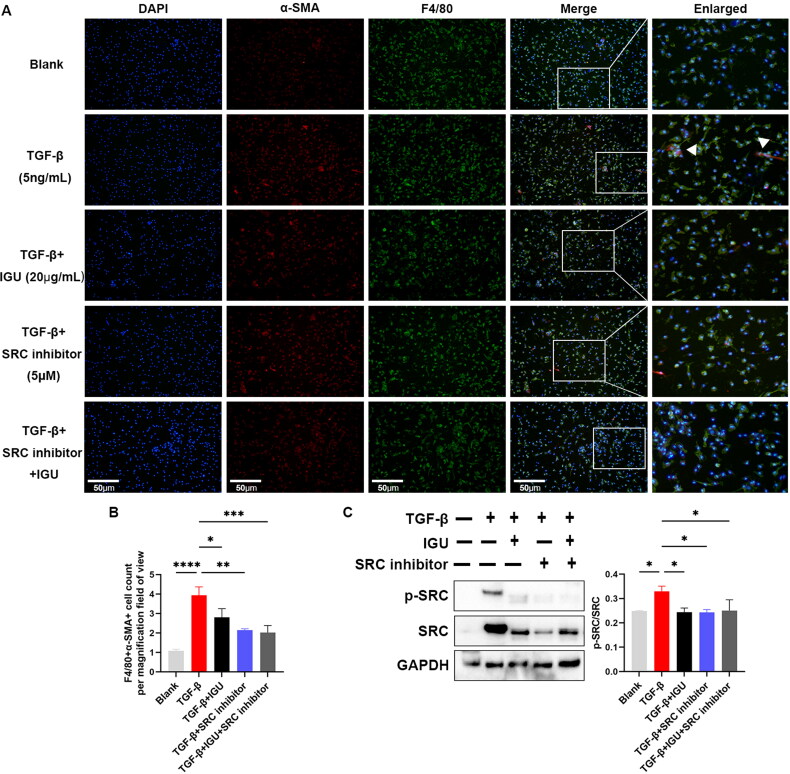
Iguratimod is a novel synthetic, small-molecule immunosuppressive agent used to treat rheumatoid arthritis. Through ongoing exploration of its role and mechanisms of action, iguratimod has been observed to have antifibrotic effects in the lung and skin; however, its effect on renal fibrosis remains unknown. This study aimed to investigate whether iguratimod could affect renal fibrosis progression. Three different concentrations of iguratimod (30 mg/kg/day, 10 mg/kg/day, and 3 mg/kg/day) were used to intervene in unilateral ureteral obstruction (UUO) model mice. Iguratimod at 10 mg/kg/day was observed to be effective in slowing UUO-mediated renal fibrosis. In addition, stimulating bone marrow-derived macrophages with IL-4 and/or iguratimod, or with TGF-β and iguratimod or SRC inhibitors in vitro, suggested that iguratimod mitigates the progression of renal fibrosis in UUO mice, at least in part, by inhibiting the IL-4/STAT6 signaling pathway to attenuate renal M2 macrophage infiltration, as well as by impeding SRC activation to reduce macrophage-myofibroblast transition. These findings reveal the potential of iguratimod as a treatment for renal disease.

Keywords: Iguratimod; macrophage infiltration; macrophage–myofibroblast transition; renal fibrosis; unilateral ureteral obstruction.


Conflict of interest statement

No potential conflict of interest was reported by the author(s).

Figures

Figure 1.
Figure 1.
Iguratimod attenuates tissue damage in obstructed kidneys of UUO mice. Mice that underwent Sham surgery were treated with vehicle or iguratimod (10 mg/kg/day), and those that underwent UUO surgery were treated with vehicle or iguratimod (30, 10, or 3 mg/kg/day). (A) Hematoxylin and eosin staining of renal tissues. (B) The tubulointerstitial injury score. IGU: iguratimod; UUO: unilateral ureteral obstruction. The numbers in parentheses are drug concentrations. Scale bar (at the bottom right of the image) = 100 μm. Data are expressed as mean ± SEM, n = 5–7, *p < 0.05, **p < 0.01, ****p < 0.0001.
Figure 2.
Figure 2.
Iguratimod attenuates tissue fibrosis in obstructed kidneys of UUO mice. Mice that underwent Sham surgery were treated with vehicle or iguratimod (10 mg/kg/day), and those that underwent UUO surgery were treated with vehicle or iguratimod (3, 10, or 30 mg/kg/day). (A) Masson’s trichrome staining of renal tissues. (B) The tubulointerstitial fibrosis score. The mRNA levels of collagen I (C), FN (D), α-SMA (E) in the kidneys of mice. Representative images of protein immunoblots (F) and the grayscale value analysis plots (G and H) of α-SMA and fibronectin in kidneys of mice. Immunohistochemical staining of α-SMA (J) in kidneys of mice and its semi-quantitative analysis graph (I). IGU: iguratimod; UUO: unilateral ureteral obstruction; α-SMA: alpha-smooth muscle actin; FN: fibronectin. The numbers in parentheses are drug concentrations. Scale bar (at the bottom right of the image) = 100 μm. Data were expressed as mean ± SEM, n = 5–7, *p < 0.05, **p < 0.01, ***p < 0.001, ****p < 0.0001.
Figure 3.
Figure 3.
Iguratimod reduces BUA levels in UUO model mice. Mice that underwent Sham surgery were treated with vehicle or iguratimod (10 mg/kg/day), and those that underwent UUO surgery were treated with vehicle or iguratimod (30, 10, or 3 mg/kg/day). The serum levels of Scr (A), BUN (B), and BUA (C) in mice. IGU: iguratimod; UUO: unilateral ureteral obstruction; Scr: serum creatinine; BUN: blood urea nitrogen; BUA: blood uric acid. The numbers in parentheses are drug concentrations. Data were expressed as mean ± SEM, n = 5–7, vs. UUO+vehicle, ****p < 0.0001; vs. Sham+IGU(10), ###P <0.001, ####P < 0.0001.
Figure 4.
Figure 4.
Iguratimod inhibits M2 macrophage infiltration in obstructed kidneys of UUO mice. Mice that underwent Sham or UUO surgery were treated with vehicle or iguratimod (10 mg/kg/day). Immunofluorescence staining of M1 (F4/80+/iNOS+, A) and M2 (F4/80+/CD206+, B) macrophages in the kidneys of mice. C. Quantitative analysis of relative fluorescence intensity for F4/80 positive staining. The number of infiltrated M1 (D) and M2 (E) macrophages per high magnification field in kidneys of mice. The mRNA levels of M2 macrophage-related markers CD206 (F), Ym-1 (G), Timp-1 (H), and IL-10 (I) in the kidneys of mice. IGU: iguratimod; UUO: unilateral ureteral obstruction; iNOS: inducible nitric oxide synthase; Ym-1: chitinase 3-like 3; Timp-1: tissue inhibitor of metalloproteinases-1. The numbers in parentheses are drug concentrations. The orange color in the Merge plot indicates positive co-localization staining. The image in the large rectangle is a zoomed-in version of the small rectangle image. Scale bar (at the bottom right of the image) = 100 μm. Data were expressed as mean ± SEM, n = 5–7, *p < 0.05, **p < 0.01, ***p < 0.001, ****p < 0.0001.
Figure 5.
Figure 5.
Iguratimod inhibits M2 macrophage infiltration by inactivating the IL-4/STAT6 signaling pathway in obstructed kidneys of UUO mice. Mice that underwent Sham or UUO surgery were treated with vehicle or iguratimod (10 mg/kg/day). Representative protein immunoblots (A) and analysis of the grayscale values of p-STAT6, STAT6 and TGF-β (B and C) in the kidneys of mice. D. The levels of IL-4 in the kidneys of mice. IGU: iguratimod; UUO: unilateral ureteral obstruction; p-STAT6: phospho-signal transducer and activator of transcription 6; TGF-β: transforming growth factor-beta. The numbers in parentheses are concentrations of iguratimod (10 mg/kg/day). Data were expressed as mean ± SEM, n = 5–7, **p < 0.01, ***p < 0.001, ****p < 0.0001.
Figure 6.
Figure 6.
Iguratimod inhibits MMT by suppressing the activation of SRC in the obstructed kidneys of UUO mice. Mice that underwent Sham or UUO surgery were treated with vehicle or iguratimod (10 mg/kg/day). A. Immunofluorescence staining of F4/80+/α-SMA+ cells in the kidneys of mice. B. The number of F4/80+/α-SMA+ cells per high magnification field in the kidneys of mice. Representative protein immunoblots (C) and analysis of the grayscale values (D) of p-SRC and SRC in kidneys of mice. The numbers in parentheses are drug concentrations. The orange color in the Merge plot indicates positive co-localization staining. The image in the large rectangle is a zoomed-in version of the small rectangle image. Scale bar (at the bottom right of the image) = 100 μm. IGU: iguratimod; UUO: unilateral ureteral obstruction; MMT: macrophage–myofibroblast transition; α-SMA: alpha-smooth muscle actin. Data were expressed as mean ± SEM, n = 5–7, *p < 0.05, **p < 0.01.
Figure 7.
Figure 7.
Iguratimod may inhibit M2 macrophage polarization in vitro by suppressing the STAT6 signaling pathway. BMDMs pre-stimulated with M-CSF (10ng/mL) were stimulated with IL-4 (20ng/mL) and iguratimod (10μg/mL, 20μg/mL, 30μg/mL) for 12h. Immunofluorescence staining images of M2 macrophages (A) and their quantitative analysis (B). C. Representative protein immunoblots and analysis of the grayscale values of p-STAT6 and STAT6 in macrophages. The orange color in the Merge plot indicates positive co-localization staining. The image in the right is a zoomed-in version of the small rectangle image. Scale bar (at the bottom left of the image) = 50 μm. IGU: Iguratimod; p-STAT6: phospho-signal transducer and activator of transcription 6; BMDMs: Bone Marrow-Derived Macrophages; M-CSF: Macrophage Colony-Stimulating Factor. Data were expressed as mean ± SEM, n = 3, *p < 0.05, ***p < 0.001, ****p < 0.0001.
Figure 8.
Figure 8.
Iguratimod inhibits MMT in vitro by inhibiting the SRC signaling pathway. BMDMs pre-stimulated with M-CSF (10ng/mL) were stimulated with TGF-β (5ng/mL) togather with or without iguratimod (20μg/mL) and/or SRC inhibitor (5μM) for 12h. Immunofluorescence staining of MMT (A) and their quantitative analysis (B). C. Representative protein immunoblots and analysis of the grayscale values of p-SRC and SRC in macrophages. The orange color in the Merge plot indicates positive co-localization staining. The image in the right is a zoomed-in version of the small rectangle image. Scale bar (at the bottom left of the image) = 50 μm. IGU: Iguratimod; BMDMs: Bone Marrow-Derived Macrophages; MMT: macrophage–myofibroblast transition; M-CSF: Macrophage Colony-Stimulating Factor; TGF-β: transforming growth factor-beta. Data were expressed as mean ± SEM, n = 3, *p < 0.05, **p < 0.01, ***p < 0.001, ****p < 0.0001.

Similar articles

Cited by

References

    1. Panizo S, Martínez-Arias L, Alonso-Montes C, et al. . Fibrosis in chronic kidney disease: pathogenesis and consequences. Int J Mol Sci. 2021;22(1):1. doi:10.3390/ijms22010408. - DOI - PMC - PubMed
    1. Tang PM, Nikolic-Paterson DJ, Lan HY.. Macrophages: versatile players in renal inflammation and fibrosis. Nat Rev Nephrol. 2019;15(3):144–14. doi:10.1038/s41581-019-0110-2. - DOI - PubMed
    1. Locati M, Curtale G, Mantovani A.. Diversity, mechanisms, and significance of macrophage plasticity. Annu Rev Pathol. 2020;15(1):123–147. doi:10.1146/annurev-pathmechdis-012418-012718. - DOI - PMC - PubMed
    1. Martinez FO, Sica A, Mantovani A, et al. . Macrophage activation and polarization. Front Biosci. 2008;13(13):453–461. doi:10.2741/2692. - DOI - PubMed
    1. Liu YC, Zou XB, Chai YF, et al. . Macrophage polarization in inflammatory diseases. Int J Biol Sci. 2014;10(5):520–529. doi:10.7150/ijbs.8879. - DOI - PMC - PubMed

MeSH terms

Grants and funding

This work was supported by the National Natural Science Foundation of China [81974090], the Research Project of Hunan Provincial Health Commission [202116000446], the Natural Science Foundation of Hunan Province (Science and health joint Program) [2022JJ70086 and 2023JJ30973], Hunan Provincial Innovation Team Project [2018RS3030], the Fundamental Research Funds for the Central Universities of Central South University [2020zzts869] and Simcere Corporation.

LinkOut - more resources