. 2024 Apr;17(4):e14471.
doi: 10.1111/1751-7915.14471.

Identification of a potent PCNA-p15-interaction inhibitor by autodisplay-based peptide library screening

Affiliations

Identification of a potent PCNA-p15-interaction inhibitor by autodisplay-based peptide library screening

Sarah Hardebeck et al. Microb Biotechnol. 2024 Apr.

Abstract

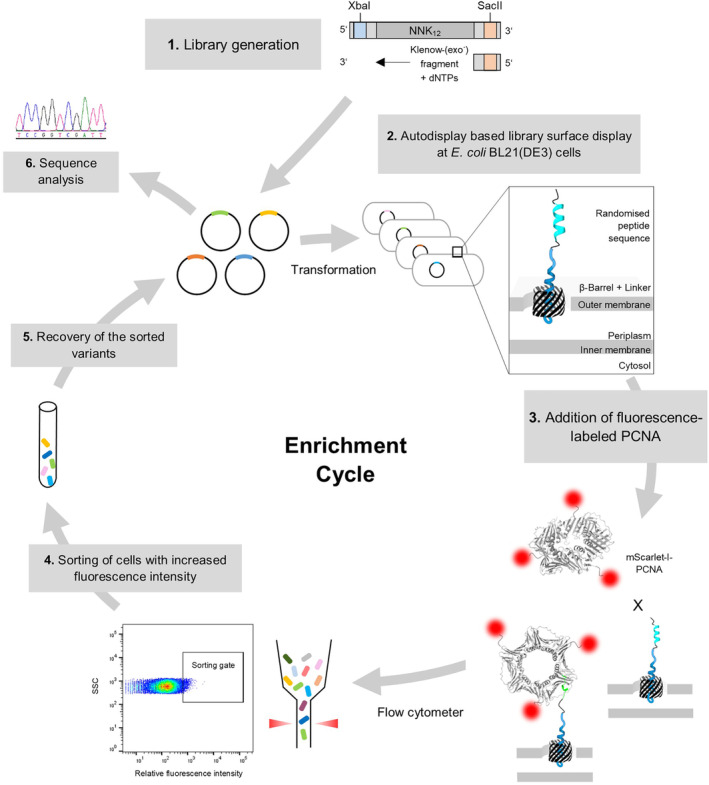
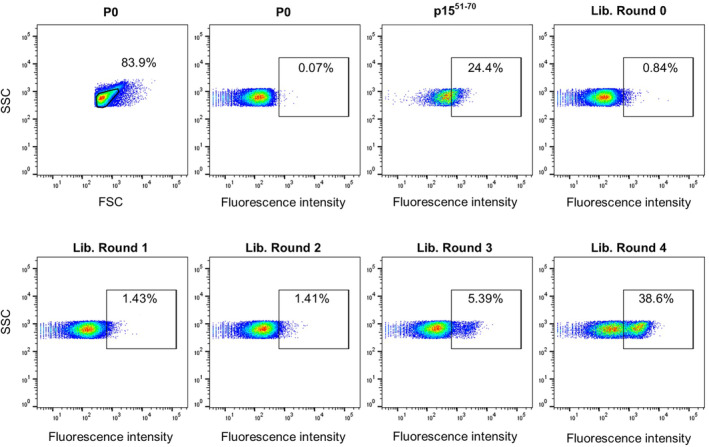
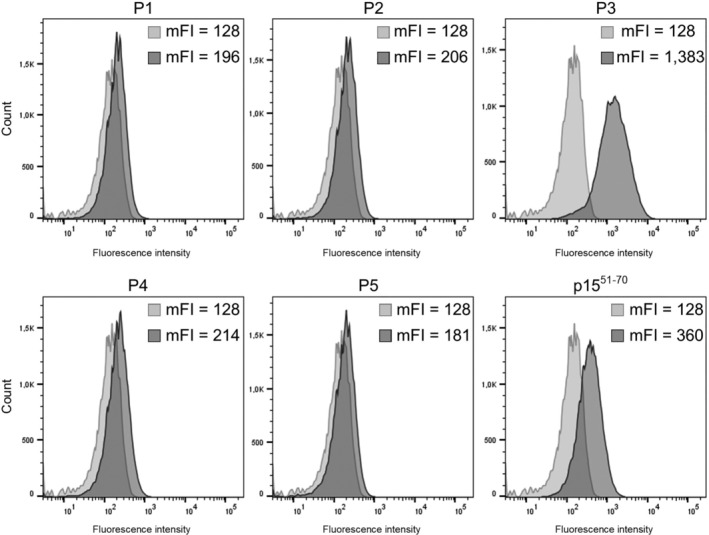
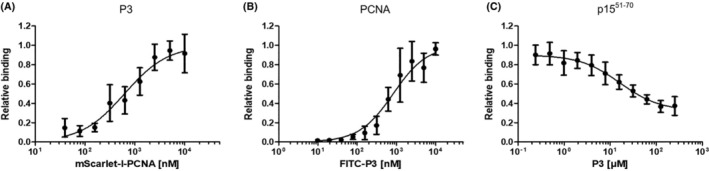
Proliferating cell nuclear antigen (PCNA) is an essential factor for DNA metabolism. The influence of PCNA on DNA replication and repair, combined with the high expression rate of PCNA in various tumours renders PCNA a promising target for cancer therapy. In this context, an autodisplay-based screening method was developed to identify peptidic PCNA interaction inhibitors. A 12-mer randomized peptide library consisting of 2.54 × 10⁶ colony-forming units was constructed and displayed at the surface of Escherichia coli BL21 (DE3) cells by autodisplay. Cells exhibiting an enhanced binding to fluorescent mScarlet-I-PCNA were enriched in four sorting rounds by flow cytometry. This led to the discovery of five peptide variants with affinity to mScarlet-I-PCNA. Among these, P3 (TCPLRWITHDHP) exhibited the highest binding signal. Subsequent flow cytometric analysis revealed a dissociation constant of 0.62 μM for PCNA-P3 interaction. Furthermore, the inhibition of PCNA interactions was investigated using p15, a PIP-box containing protein involved in DNA replication and repair. P3 inhibited the PCNA-p1551-70 interaction with a half maximal inhibitory activity of 16.2 μM, characterizing P3 as a potent inhibitor of the PCNA-p15 interaction.


Conflict of interest statement

The authors declare no conflicts of interest.

Figures

FIGURE 1
FIGURE 1
Scheme of the library construction and screening process for the identification of peptidic PCNA binders. 1. The library was constructed using oligonucleotides containing 12 randomized codons (NNK12). These oligonucleotides were filled to DNA double strands by a 5′ complementary primer and the Klenow fragment. The double stranded DNA was integrated as the passenger sequence into a MATE vector by restriction/ligation at the adjacent XbaI and SacII restriction sites. 2. The resulting plasmid library was introduced into Escherichia coli BL21 (DE3) cells by transformation. The induction of gene expression resulted in the surface presentation of the randomized peptides at the surface of E. coli BL21 (DE3) cells. 3. Binding of fluorescently labelled PCNA to the surface displayed peptides increases the fluorescence intensity of E. coli BL21 (DE3) cells. 4. Cells with an elevated fluorescence intensity were sorted into reaction vessels by flow cytometry. 5. The recovery of the variants was performed by plasmid isolation and a subsequent transformation of E. coli BL21 (DE3) cells with the isolated plasmids. 6. After four rounds of enrichment, the DNA sequences of the plasmids of the most promising variants were determined.
FIGURE 2
FIGURE 2
Sorting of PCNA‐binding variants by flow cytometry. Escherichia coli BL21 (DE3) presenting the randomized peptides at their surface were incubated with 500 nM mScarlet‐I‐PCNA at 37°C for 1 h and analysed by the flow cytometer. Cells with a morphology typical for E. coli BL21 (DE3) were included in the analysis gate (A). Cells within this analysis gate were then analysed according to their mScarlet‐I‐fluorescence (561 nm/610 nm) (B). The sorting gate contained 0.95% of the cells with the highest fluorescence intensity. The dot plots present the measurement of 50,000 cells from the first round of sorting. In total, 250,000 cells within the sorting gate were collected in reaction tubes. The corresponding plasmids were subsequently recovered by plasmid isolations and transformations of E. coli cells.
FIGURE 3
FIGURE 3
Enrichment of PCNA‐binding variants by the autodisplay‐based library screening. Escherichia coli BL21 (DE3) cells displaying P0 (nonbinding control), p1551‐70 (positive binding control) or the peptide library from different sorting rounds were incubated with 500 nM mScarlet‐I‐PCNA at 37°C for 1 h. Fifty thousand cells of each sample were analysed by flow cytometry. In the first dot plot (top left), P0 presenting cells were investigated regarding their SSC and FSC (analysis gate). In all subsequent dot plots, only cells within this analysis gate were shown and inspected for fluorescence intensity (sorting gate of the first enrichment round). The percentage of cells located in the gates is included in the dot plots. An approximately 46‐fold enrichment of the cells within the sorting gate was observed during the screening.
FIGURE 4
FIGURE 4
Binding of the selected variants P1–P5 to PCNA by flow cytometry. Cells displaying the non‐binding peptide P0 (light grey), the positive binding control p1551‐70 or the peptide variants P1–P5 (dark grey) were incubated with 100 nM mScarlet‐I‐PCNA at 37°C for 1 h. Fluorescence of 50,000 cells per sample was measured at 561 nm/610 nm by flow cytometry. The histograms and the corresponding mFI of the cells are shown in the figure. The addition of mScarlet‐I‐PCNA increases the mFI of cells presenting peptides P1–P5 compared to the mFI of the non‐binding control. The histograms and the mFIs of one representative experiment are shown. mFI, median fluorescence intensity.
FIGURE 5
FIGURE 5
Characterization of the binding affinity (A and B) and inhibitory activity (C) of P3. (A) Analysis of the mScarlet‐I‐PCNA‐P3 affinity: The cells presenting P3 or P0 were incubated with varying concentrations of mScarlet‐I‐PCNA (39 nM to 10 μM) at 37°C for 1 h. The fluorescence intensity of 50,000 cells was measured by flow cytometry at 561 nm/610 nm. To calculate the specific binding, the fluorescence intensity of cells presenting P0 (non‐binding control) was subtracted from the fluorescence intensity of cells presenting the P3. The relative binding of four independent experiments in triplicates was plotted against the mScarlet‐I‐PCNA concentration, resulting in a dissociation constant of 617.9 ± 51.4 nM. The uncertainty of the K D value indicates the standard error of the fit. (B) Analysis of the FITC‐P3‐PCNA affinity: Cells presenting PCNA were incubated with varying concentrations of FITC‐P3 (9.8 nM to 10 μM) at 37°C for 1 h. The fluorescence intensity of 50,000 cells was measured by flow cytometry at 561 nm/610 nm. The relative binding of three independent experiments was plotted against the FITC‐P3 concentration, resulting in a dissociation constant of 831 ± 115 nM. The uncertainty of the K D value indicates the standard error of the fit. (C) Analysis of the inhibitory effect of P3 on the PCNA‐p1551‐70 interaction: Cells presenting p1551‐70 or P0 were incubated with 100 nM of PCNA and varying concentrations of the peptide P3 (0.1–250 μM). The fluorescence intensity of 50,000 cells was measured by flow cytometry at 561 nm/610 nm. To determine the specific binding, the fluorescence intensity of cells presenting P0 (non‐specific binding) was subtracted from the fluorescence intensity of cells presenting p1551‐70. The relative binding from three independent experiments in triplicates was plotted against the P3 concentration (0.1–250 μM), yielding an IC50 value of 16.2 ± 3.9 μM. The standard deviation of the IC50 value indicates the uncertainty of the fit.

Similar articles

References

    1. Baple, E.L. , Chambers, H. , Cross, H.E. , Fawcett, H. , Nakazawa, Y. , Chioza, B.A. et al. (2014) Hypomorphic PCNA mutation underlies a human DNA repair disorder. The Journal of Clinical Investigation, 124, 3137–3146. - PMC - PubMed
    1. Bessette, P.H. , Rice, J.J. & Daugherty, P.S. (2004) Rapid isolation of high‐affinity protein binding peptides using bacterial display. Protein Engineering, Design and Selection, 17, 731–739. - PubMed
    1. Boder, E.T. , Midelfort, K.S. & Wittrup, K.D. (2000) Directed evolution of antibody fragments with monovalent femtomolar antigen‐binding affinity. Proceedings of the National Academy of Sciences of the United States of America, 97, 10701–10705. - PMC - PubMed
    1. Cardano, M. , Tribioli, C. & Prosperi, E. (2020) Targeting proliferating cell nuclear antigen (PCNA) as an effective strategy to inhibit tumor cell proliferation. Current Cancer Drug Targets, 20, 240–252. - PubMed
    1. Daugherty, P.S. , Chen, G. , Olsen, M.J. , Iverson, B.L. & Georgiou, G. (1998) Antibody affinity maturation using bacterial surface display. Protein Engineering, 11, 825–832. - PubMed

Publication types

MeSH terms