. 2024 Apr 22;14(1):9166.
doi: 10.1038/s41598-024-59907-6.

Unveiling the link between lactate metabolism and rheumatoid arthritis through integration of bioinformatics and machine learning

Affiliations

Unveiling the link between lactate metabolism and rheumatoid arthritis through integration of bioinformatics and machine learning

Fan Yang et al. Sci Rep. .

Abstract

Rheumatoid arthritis (RA) is a persistent autoimmune condition characterized by synovitis and joint damage. Recent findings suggest a potential link to abnormal lactate metabolism. This study aims to identify lactate metabolism-related genes (LMRGs) in RA and investigate their correlation with the molecular mechanisms of RA immunity. Data on the gene expression profiles of RA synovial tissue samples were acquired from the gene expression omnibus (GEO) database. The RA database was acquired by obtaining the common LMRDEGs, and selecting the gene collection through an SVM model. Conducting the functional enrichment analysis, followed by immuno-infiltration analysis and protein-protein interaction networks. The results revealed that as possible markers associated with lactate metabolism in RA, KCNN4 and SLC25A4 may be involved in regulating macrophage function in the immune response to RA, whereas GATA2 is involved in the immune mechanism of DC cells. In conclusion, this study utilized bioinformatics analysis and machine learning to identify biomarkers associated with lactate metabolism in RA and examined their relationship with immune cell infiltration. These findings offer novel perspectives on potential diagnostic and therapeutic targets for RA.

Keywords: Bioinformatics analysis; Immune infiltration; Lactate metabolism; Machine learning; Rheumatoid arthritis.


Conflict of interest statement

The authors declare no competing interests.

Figures
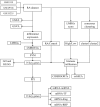
Figure 1
Figure 1
Flow chat. RA, rheumatoid arthritis. LMRGs, lactate metabolism related genes. LMRDEG, lactate metabolism related differential expression genes. GO, gene ontology. KEGG, Kyoto encyclopedia of genes and genomes. GSEA, gene set enrichment analysis. GSVA, gene set variation analysis. ssGSEA, single-sample gene set enrichment analysis. PPI, protein–protein interaction. TF, transcription factor. RBP, RNA binding protein.
Figure 2
Figure 2
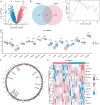
Expression difference of LMRGs in RA dataset. (A) Volcano plots showing changes in gene expression in the RA-dataset. The horizontal axis is the log2 fold change and the vertical axis is the negative log10 P-value. Up-regulated genes (blue) and down-regulated genes (red) are delimited by a horizontal dashed line (P-value threshold) and two vertical dashed lines (fold change threshold). The figure shows a total of 1368 up-regulated genes and 1353 down-regulated genes. (B) Venn diagram illustrating the overlap between differentially expressed genes and LMRGs. (C) SVM model screening LMRDEGs display. (D) A comparison chart presents LMRDEGs in the RA dataset. Chromosomal map of (E) key genes. (F) The RA dataset contains a heat map displaying the important gene expressions. The * symbol in the group comparison chart (CD) represents a statistical significance of P < 0.05. The ** symbol represents a high statistical significance of P < 0.01. The *** symbol represents a very high statistical significance of P < 0.001, indicating significant meaning. LMRG, lactate metabolism-related genes; DEGs, differential expression genes. LMRDEG, lactate metabolism-related differential expression genes; and RA: rheumatoid arthritis.
Figure 3
Figure 3
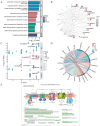
GO function enrichment and KEGG pathway enrichment analysis. AB. The histogram (A) and network diagram (B) illustrate the GO and KEGG enrichment analysis results for the key genes. The enrichment analysis results for GO and KEGG are based on the combined logFC. CD. Bubble plot (C) and chord plot (D) display the identified crucial genes. (E) Necroptosis KEGG pathway diagram (hsa04217). The pathway diagrams of E are obtained by downloading them from the KEGG Pathway database. The screening criteria included a significance level of P < 0.05 and an FDR value (q-value) below 0.25 to qualify for GO and KEGG enrichment. GO, Gene Ontology; BP, biological process. CC, cellular component; MF, molecular function; and KEGG, Kyoto encyclopedia of genes and genomes.
Figure 4
Figure 4
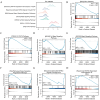
Gene sets enrichment analysis (GSEA). (A) Enrichment distribution curves for a range of biological pathways are shown at the top. These curves depict the ranked distribution of genes in the examined biological pathways in the RA-dataset dataset. We can see the trend of enrichment in the dataset for different pathways such as WNT5A-dependent FZD4 internalisation, activated NTRK3 via PI3k signalling, Hippo signalling regulatory pathway, Mapk signalling pathway, Tgf Beta signalling pathway, IL12 STAT4 pathway and PI3ki pathway. (BH) The RA dataset contains genes that are notably enriched in the PI3KCI pathway (B), IL12 STAT4 pathway (C), TGF-β signaling pathway (D), MAPK signaling pathway (E), HIPPO signaling regulation pathways (F), activated NTRK3 signals via PI3K (G), WNT5A dependent internalization of FZD4 (H), and various other pathways. The important criteria for GSEA enrichment screening were a P-value less than 0.05 and an FDR value (q-value) less than 0.25. RA, rheumatoid arthritis; GSEA, Gene sets enrichment analysis.
Figure 5
Figure 5
Analysis of variations in gene sets. (A) The Heatmap showing the expression of different sets of genes in different samples. Each column represents one sample, grouped into RA (rheumatoid arthritis) and control groups. Each row represents a gene set such as “HALLMARK_INTERFERON_GAMMA_RESPONSE” (interferon-gamma response) or “HALLMARK_HYPOXIA” (hypoxia). Colors represent Z-scores: pink represents higher gene set activity (positive Z-scores) and blue represents lower gene set activity (negative Z-scores). The clustering tree (dendrogram) on the left side of the heatmap represents the similarity between gene sets, where similar gene sets are grouped together. (B) The box plots show the differences in the activity of some key sets of genes in the RA and control groups. Red box plots represent the RA group and blue represents the control group. In each pair of box plots, the centre line of the box indicates the median, the range of the box indicates the first and third quartiles, and the tentacles indicate the range of outliers. The primary screening criterion for GSVA enrichment analysis was a significance level of less than 0.05. In the group (B) comparison chart, the symbol ns represents P ≥ 0.05, indicating no statistical significance. The symbol * represents P < 0.05, indicating statistical significance. The symbol ** represents P < 0.01, indicating high statistical significance. The symbol *** represents a P-value < 0.001, indicating very high statistical significance. RA, rheumatoid arthritis; GSVA, Gene set variation analysis.
Figure 6
Figure 6
CIBERSORTx analysis to compare immune infiltration between the RA and Control groups. (A) Stacked histogram show the infiltration abundance of various immune cells in the RA dataset as calculated by the CIBERSORTx algorithm. Each sample is represented by different coloured stacked bars indicating the relative proportions of 22 different immune cells. (B) Box plots represent comparisons between the RA group and the Control group in terms of the abundance of different immune cell infiltrates. Each point represents a sample, and the box plots contain medians, quartiles, and show statistical significance by asterisks. (C) The heatmap showing the correlation between the eight immune cell infiltrates that were significantly different in the RA group versus the Control group. Like Graph A, colors and asterisks indicate correlation coefficients and significance. (D) The heatmap shows the correlation between specific immune cells and 14 key genes. As before, colours and asterisks indicate the degree and significance of the correlation. Statistical significance is indicated by asterisks in the group comparison graph (B) and the correlation heat map (CD). No asterisk represents P ≥ 0.05, indicating no statistical significance. An asterisk symbol (*) represents P < 0.05, indicating statistical significance. The symbol (**) represents P < 0.01, indicating high statistical significance. The symbol (***) represents P < 0.001, indicating high statistical significance. RA, rheumatoid arthritis.
Figure 7
Figure 7
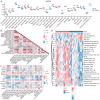
A comparison of immune infiltration between the RA and Control groups. (A) Box plots of ssGSEA analysis results. The horizontal axis lists the multiple immune cell types and the vertical axis indicates their enrichment fraction in the sample. Red represents the RA group and blue represents the control group. (B) Lower triangular heatmap of correlation between immune cell types obtained by ssGSEA analysis. Each box represents the value of the correlation coefficient between the two cell types, varying from − 1 (perfectly negative relationship, dark red) to 1 (perfectly positive relationship, dark pink), with 0 indicating no correlation. (C) As shown in Fig. 7B, a heat map demonstrating the correlation between immune cell types and a set of key genes. The key genes here such as FLI1 and GATA2 may play an important role in RA pathology. Again, the colours and asterisks represent correlation strength and statistical significance. (D) The immune cell infiltration of all samples between the RA group and the control group is shown as a heat map. The horizontal axis is the sample and the vertical axis is the immune cell type. The colour shades represent the fraction of different immune cell types enriched in each sample, with dark red representing a high enrichment fraction and light colours representing a low enrichment fraction. A significant difference in the infiltration of certain immune cell types can be observed between patients in the RA group and the control group. The asterisks in the comparison chart for groups (A) and the heat map for correlation (B, C) indicate statistical significance. A lack of asterisk indicates a P-value greater than or equal to 0.05, indicating no statistical significance. An asterisk (*) indicates a P-value less than 0.05, indicating statistical significance. The symbol (**) represents a P-value less than 0.01, indicating high statistical significance. The symbol (***) represents a P-value less than 0.001, indicating statistically significant results. RA, rheumatoid arthritis; ssGSEA, single-sample gene set enrichment analysis.
Figure 8
Figure 8
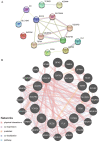
PPI interaction network. (A) Network of essential genes. The GeneMANIA website of (B) key genes predicts the network of interactions among genes with similar functions. A’s inter-structured network is gathered and exported from the STRING database, with a minimum interaction score of 0.150. The Gene MANIA website collects and exports the interconnected network structure of (B) black circles with white slashes represent the input key genes, while black circles represent predicted functionally similar genes without white slashes. Red lines indicate physical interactions between genes, purple connections represent co-expression relationships, yellow connections represent predicted connections, purple connections represent co-localization relationships between genes, and sky blue lines represent pathway-related relationships between genes. PPI, protein–protein interaction.
Figure 9
Figure 9
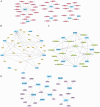
miRNA, TF, drug, RBP prediction network of key genes. (A) The network for predicting mRNA-miRNA interactions of important genes. Blue rectangles represent the mRNA, while red ovals represent miRNAs in the prediction network. The interaction data is sourced from the ENCORI database. (B) mRNA-TF prediction network for key genes. The blue rectangles symbolize mRNA, while the yellow diamonds symbolize TFs in the prediction network. The interaction data is sourced from the ChIPBase 3.0 database. (C) mRNA-drug prediction network for key genes. The blue rectangle represents mRNA, while the green rectangle represents the drug in the prediction network. The interaction data is sourced from the (D) Gidb database. Network prediction of hub genes for mRNA-RBP. The blue rectangles depict mRNA, while the purple triangles depict RBPs in the prediction network. The interaction data is sourced from the ENCORI database. Transcription factor (TF) is a protein that binds to RNA (RNA binding protein, RBP).

Similar articles

References

    1. Smolen JS, Aletaha D, McInnes IB. Rheumatoid arthritis. Lancet. 2016;388:2023–2038. doi: 10.1016/S0140-6736(16)30173-8. - DOI - PubMed
    1. Chopra A, et al. Rheumatoid arthritis management in the APLAR region: Perspectives from an expert panel of rheumatologists, patients and community oriented program for control of rheumatic diseases. Int. J. Rheum. Dis. 2021;24:1106–1111. doi: 10.1111/1756-185X.14185. - DOI - PubMed
    1. Weyand CM, Zeisbrich M, Goronzy JJ. Metabolic signatures of T-cells and macrophages in rheumatoid arthritis. Curr. Opin. Immunol. 2017;46:112–120. doi: 10.1016/j.coi.2017.04.010. - DOI - PMC - PubMed
    1. Li C, et al. Metabolomics in the development and progression of rheumatoid arthritis: A systematic review. Joint Bone Spine. 2020;87:425–430. doi: 10.1016/j.jbspin.2020.05.005. - DOI - PubMed
    1. Pucino V, et al. Lactate buildup at the site of chronic inflammation promotes disease by inducing CD4(+) T cell metabolic rewiring. Cell Metab. 2019;30:1055–1074. doi: 10.1016/j.cmet.2019.10.004. - DOI - PMC - PubMed

Publication types