. 2024 Apr 20;23(1):78.
doi: 10.1186/s12943-024-01991-3.

Trametinib sensitizes KRAS-mutant lung adenocarcinoma tumors to PD-1/PD-L1 axis blockade via Id1 downregulation

Affiliations

Trametinib sensitizes KRAS-mutant lung adenocarcinoma tumors to PD-1/PD-L1 axis blockade via Id1 downregulation

Ander Puyalto et al. Mol Cancer. .

Abstract

Background: The identification of novel therapeutic strategies to overcome resistance to the MEK inhibitor trametinib in mutant KRAS lung adenocarcinoma (LUAD) is a challenge. This study analyzes the effects of trametinib on Id1 protein, a key factor involved in the KRAS oncogenic pathway, and investigates the role of Id1 in the acquired resistance to trametinib as well as the synergistic anticancer effect of trametinib combined with immunotherapy in KRAS-mutant LUAD.

Methods: We evaluated the effects of trametinib on KRAS-mutant LUAD by Western blot, RNA-seq and different syngeneic mouse models. Genetic modulation of Id1 expression was performed in KRAS-mutant LUAD cells by lentiviral or retroviral transductions of specific vectors. Cell viability was assessed by cell proliferation and colony formation assays. PD-L1 expression and apoptosis were measured by flow cytometry. The anti-tumor efficacy of the combined treatment with trametinib and PD-1 blockade was investigated in KRAS-mutant LUAD mouse models, and the effects on the tumor immune infiltrate were analyzed by flow cytometry and immunohistochemistry.

Results: We found that trametinib activates the proteasome-ubiquitin system to downregulate Id1 in KRAS-mutant LUAD tumors. Moreover, we found that Id1 plays a major role in the acquired resistance to trametinib treatment in KRAS-mutant LUAD cells. Using two preclinical syngeneic KRAS-mutant LUAD mouse models, we found that trametinib synergizes with PD-1/PD-L1 blockade to hamper lung cancer progression and increase survival. This anti-tumor activity depended on trametinib-mediated Id1 reduction and was associated with a less immunosuppressive tumor microenvironment and increased PD-L1 expression on tumor cells.

Conclusions: Our data demonstrate that Id1 expression is involved in the resistance to trametinib and in the synergistic effect of trametinib with anti-PD-1 therapy in KRAS-mutant LUAD tumors. These findings suggest a potential therapeutic approach for immunotherapy-refractory KRAS-mutant lung cancers.

Keywords: KRAS-mutant lung adenocarcinoma; Id1; PD-1 inhibition; PD-L1; Proteasome; Trametinib.


Conflict of interest statement

The authors declare no competing interests.

Figures
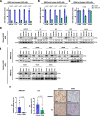
Fig. 1
Fig. 1
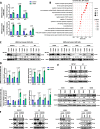
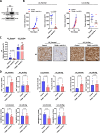
Trametinib reduces Id1 protein levels in KRAS-mutant LUAD in vitro and in vivo. A Cell viability assay of KRAS-mutant mouse LUAD cells treated with trametinib (TRAM) 100 nM for 72 h. B Cell viability of KRAS-mutant human LUAD cells treated with trametinib (TRAM) 500 nM for 72 h. C Cell viability of KRAS-wild type human LUAD cells treated with trametinib (TRAM) 500 nM for 72 h. D Western blot analysis of Id1 protein in KRAS-mutant mouse LUAD cells treated as in A. ß-actin was used as control. E Western blot analysis of Id1 in human KRAS-mutant (upper panel) and in human KRAS-wild type LUAD cells (lower panel) treated as in B-C. HSP90 was used as control. F Immunohistochemical quantification of Id1 expression in CMT167 and LLC tumors harvested at day 19 from mice treated with vehicle (Control) or trametinib (TRAM). Left panel: Barr graphs showing the Id1 expression. Right panel: Representative Id1 immunohistochemical stainings. In Western blot analyses, relative optical density is indicated underneath each lane. Data are expressed as mean ± SD. Comparisons between experimental groups were performed by two-sided t-test (parametric) or two-sided Mann–Whitney U-test (non-parametric)
Fig. 2
Fig. 2
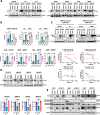
Trametinib increases proteasome activity to reduce Id1 levels in KRAS-mutant LUAD cells. A Id1 mRNA expression levels assessed by real-time PCR in KRAS-mutant mouse (upper panel) and human (lower panel) LUAD cells treated with trametinib (TRAM) (100 nM in murine cells and 500 nM in human cells) for 72 h or vehicle (Control). β-ACTIN was used as the reference gene. B GO Biological process (BP) enrichment analysis of murine KRAS-mutant LUAD cells (CMT167 and KLA) treated with trametinib (TRAM) (100 nM) for 72 h or vehicle (Control). C Western blot analysis of Id1 protein levels in KRAS-mutant mouse (left panel) and human (right panel) LUAD cell lines treated with trametinib (TRAM) (100 nM in murine cells and 500 nM in human cells) for 72 h or vehicle (Control), in the presence or not of the proteasome inhibitor MG-132 (5 μM; 6 h). ß-actin and HSP90 were used as controls for mouse and human cell lines, respectively. D E3 ubiquitin ligases SMURF2 and FBXW7 mRNA expression levels assessed by real-time PCR in KRAS-mutant mouse (upper panel) and human (lower panel) LUAD cells treated with (TRAM) (100 nM in murine cells and 500 nM in human cells) for 6 h or vehicle (Control). β-ACTIN was used as the reference gene. E Western blot analysis of the E3 ubiquitin ligases SMURF2 and FBXW7 in KRAS-mutant mouse (upper panel) and human (lower panel) LUAD cell lines treated with trametinib (TRAM) (100 nM in murine cells and 500 nM in human cells) for 6 h or vehicle (Control). β-actin was used as control. F Western blot analysis of the E3 ubiquitin ligase SMURF2 and Id1 in KRAS-mutant mouse (left panel) and human (right panel) LUAD cell transduced with lentiviral shRNAs targeting SMURF2 or with a scrambled sequence (Control). Cells were treated with trametinib (TRAM) (100 nM in murine cells and 500 nM in human cells) for 72 h or vehicle (Control). GAPDH and β-actin were used as control. In Western blot analyses, relative optical density is indicated underneath each lane. Data are expressed as mean ± SD. Comparisons between experimental groups were performed by two-sided t-test (parametric) or Mann–Whitney U-test (non-parametric)
Fig. 3
Fig. 3
Id1 is involved in the acquired resistance of KRAS-mutant LUAD cells to trametinib treatment. A Western blot analysis of Id1 protein in parental and trametinib resistant (TR) KRAS-mutant mouse (left panel) and human (right panel) cells lines. Cells treated with trametinib (TRAM) (100 nM in murine cells and 500 nM in human cells) for 72 h or vehicle (Control). ß-actin and HSP90 were used as controls for mouse and human cell lines, respectively. B Flow cytometry analysis of the proportion of apoptotic parental and TR KRAS-mutant mouse (upper panel) and human (lower panel) cells. Parental cells were treated with trametinib (TRAM) (100 nM in murine cells and 500 nM in human cells) for 72 h or vehicle (Control). Id1 was silenced in TR cells using lentiviral transduced shRNAs (sh1-Id1 and sh2-Id1 in mice and sh-Id1 in human) or with a scrambled sequence (Control) TR-cell lines were cultured in cell media with trametinib (500 nM). Apoptosis was assessed by flow cytometry by Annexin V and 7AAD staining, as previously described [19, 24]. C Upper panel: Western blot analysis of Id1 (17 kDa) and Id1-flag (20 kDa) proteins. Control cells were transfected with a GFP cDNA expressing vector (control). Cells were treated with trametinib (TRAM) (100 nM in murine cells and 500 nM in human cells) for 72 h or vehicle (Control). β-actin was used as control. Lower panel: Effects of exogenous Id1 (Id1-flag)-transduction in the survival of KRAS-mutant mouse (CMT167, LLC) and KRAS-mutant human (H1792 and H2009) trametinib-treated tumor cells. Trametinib IC50 is indicated in the figure. D Upper panel: Western blot analysis of Id1 protein in TR KRAS-mutant human cells lines. GAPDH was used as control. Id1 was silenced using the sh1-Id1. The expression of Id1 in sh1-Id1-transduced cells was rescued by retroviral transduction of Id1 cDNA refractory to sh-Id1 inhibition (sh1-Id1/Id1-OE) [24]. Cells treated with Trametinib (TRAM) 500 nM for 72 h or vehicle (Control). Lower panel: Cell viability of the upper panel cells when treated with trametinib (TRAM) 500 nM for 72 h or vehicle (Control). E Western blot analysis of c-Myc, total and phosphorylated p42 MAPK, total and phosphorylated p44 MAPK and FOSL1 in parental and in TR KRAS-mutant human cells lines treated as shown in the upper panel of D. GAPDH was used as control. In Western blot analyses, relative optical density is indicated underneath each lane. Data are expressed as mean ± SD. Comparisons between experimental groups were performed by one-way ANOVA followed by the Tukey post hoc test
Fig. 4
Fig. 4
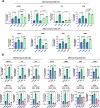
Trametinib upregulates IFN-γ-mediated PD-L1 expression through Id1 downregulation in KRAS-mutant LUAD cells. A PD-L1 expression assessed by flow cytometry in KRAS-mutant mouse (upper panel) and human (lower panel) cells lines transduced or not with lentiviral shRNAs targeting Id1 (sh1-Id1 and sh2-Id1 in mice and sh-Id1 in human). B Upper panel: PD-L1 expression assessed by flow cytometry in parental and TR KRAS-mutant mouse (left) and human (right) cells lines. Parental cells were treated with trametinib (TRAM) (100 nM in murine cells and 500 nM in human cells) for 72 h or vehicle (Control). TR-cell lines were cultured in cell media with trametinib (500 nM). Lower panel: PD-L1 expression assessed by flow cytometry in KRAS-mutant mouse (left) and human cells lines (right) transduced with an Id1-flag cDNA expressing vector (Id1-flag) or a GFP cDNA expressing vector (Control). Cells were treated with trametinib (TRAM) (100 nM in murine cells and 500 nM in human cells) for 72 h or vehicle (Control). Mouse cells were incubated or not with murine IFN-γ (1500 U/ml) for 24 h and human cells were incubated or not with human IFN-γ (20 ng/ml) for 24 h. Data are expressed as mean ± SD. Comparisons between experimental groups were performed by one-way ANOVA test followed by the Tukey post hoc test
Fig. 5
Fig. 5
Trametinib combined with PD-1/PD-L1 blockade reduces tumor growth in murine KRAS-mutant lung cancer syngeneic models. A Upper panel: Schematic of the experiment. Subcutaneously inoculated KRAS-mutant 393P cells were allowed to growth in syngeneic mice for 9 days. Tumor-bearing mice were randomized in four groups and treated with anti-PD-1 (Anti-PD-1; twice weekly; n = 8 mice per group), trametinib (TRAM; 5 days per week; n = 8 mice per group), their combination (TRAM + anti-PD-1; n = 8 mice per group) or vehicle (control; n = 8 mice per group). Lower panel from left to right: Follow-up of tumor volume over time. Tumor volumes at day 34 of all the experimental groups. Tumor volumes at day 74 of 393P-tumors treated with trametinib alone (TRAM) or in combination with anti-PD-1 (TRAM + anti-PD-1). Kaplan–Meier survival curves for all the experimental groups. B Upper panel: Schematic of the experiment. Subcutaneously inoculated KRAS-mutant LLC cells were allowed to growth in syngeneic mice for 7 days. Tumor-bearing mice were randomized in four groups and treated with anti-PD-1 (Anti-PD-1; twice weekly; n = 6 mice per group), trametinib (TRAM; 5 days per week; n = 6 mice per group), their combination (TRAM + anti-PD-1; n = 6 mice per group) or vehicle (control; n = 6 mice per group). Lower panel from left to right: Follow-up of tumor volume over time. Tumor volumes at day 21 of all the experimental groups. Tumor volumes at day 26 of LLC-tumors treated with trametinib alone (TRAM) or in combination with anti-PD-1 (TRAM + anti-PD-1). Data are expressed as mean ± SD. Comparisons between two experimental groups were performed by two-side t-test; for more than two experimental groups one-way ANOVA followed by the Tukey post hoc test was used
Fig. 6
Fig. 6
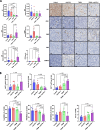
Trametinib in combination with PD-1 blockade increases the frequency of tumor-infiltrating effector T cells and reduces the proportion of immunosuppressive Treg cells and MDSCs within the tumor microenvironment. A Left panel: Immunohistochemical quantification of Id1 and tumor-infiltrating CD8+ T cells (CD8), CD4+ T cells (CD4), Treg cells (Foxp3) in LLC tumors harvested from mice shown in Fig. 5B. CD8 T cells/Treg ratio is also shown. Right panel: Representative images of the immunostainings. Scale bar: 200 μm. B Flow cytometric quantification of tumor-infiltrating CD8+ T cells (CD45+, CD3+, CD8+, CD44+), Treg cells (CD45+, CD3+, CD4+, CD25+, Foxp3+); total MDSCs (CD45+, CD11b+, Ly6C+), PMN-MDSCs (CD45+, CD11b+, Ly6C+, Ly6GHigh), MON-MDSCs (CD45+, CD11b+, Ly6C+, Ly6GLow) and DCs (CD45+, CD11c+, MHC-II+) from LLC tumors harvested from mice shown in Supplementary Fig. S8A. CD8 T cells/Treg ratio is also shown. Data are expressed as the percentage of total leukocytes (CD45), except for Treg cells, which are expressed as the percentage of total CD4+ T cells. Data are expressed as mean ± SD. Comparisons between experimental groups were performed by one-way ANOVA followed by the Tukey post hoc test
Fig. 7
Fig. 7
The antitumor activity of the trametinib and anti-PD-1 combined treatment depends on trametinib-mediated Id1 inhibition. A Western blot analysis of Id1 protein in parental and LLC Id1-flag LLC cells. β-Actin was used as control. B Left panel: Subcutaneous growth of LLC tumors in mice treated with trametinib and anti-PD-1 combination (TRAM + anti-PD-1; TRAM; 5 days per week; anti-PD-1; twice weekly) (n = 6 mice per group) or vehicle (control) (n = 5 mice per group). The follow-up of tumor size and the tumor volumes at day 14 are shown. Right panel: Subcutaneous growth of LLC Id1-flag tumors in mice treated with trametinib and anti-PD-1 combination (TRAM + anti-PD-1; TRAM; 5 days per week; anti-PD-1; twice weekly) (n = 6 mice per group) or vehicle (control) (n = 6 mice per group). The follow-up of tumor size and the tumor volumes at day 17 are shown. C Immunohistochemical quantification and representative images of Id1 immunostaining in the tumors from the experiment shown in B. Scale bar: 200 μm. D Flow cytometric quantification of total tumor-infiltrating CD8+ T cells (CD45+, CD3+, CD8+, CD44+), Treg cells (CD45+, CD3+, CD4+, CD25+, Foxp3+), total MDSCs (CD45+, CD11b+, Ly6C+), PMN-MDSCs (CD45+, CD11b+, Ly6C+, Ly6GHigh). CD8 T cells/Treg ratio is also shown. Data are expressed as the percentage of total leukocytes (CD45+), except for Treg cells, which are expressed as the percentage of total CD4+ T cells. Data are expressed as means ± SD. Comparisons between experimental groups were performed by two-sided t-test (parametric) or two-sided Mann–Whitney U-test (non-parametric)

Similar articles

References

    1. Siegel RL, Miller KD, Wagle NS, Jemal A. Cancer statistics, 2023. CA Cancer J Clin. 2023;73:17–48. doi: 10.3322/caac.21763. - DOI - PubMed
    1. Skoulidis F, Heymach JV. Co-occurring genomic alterations in non-small-cell lung cancer biology and therapy. Nat Rev Cancer. 2019;19:495–509. doi: 10.1038/s41568-019-0179-8. - DOI - PMC - PubMed
    1. Herbst RS, Morgensztern D, Boshoff C. The biology and management of non-small cell lung cancer. Nature. 2018;553:446–454. doi: 10.1038/nature25183. - DOI - PubMed
    1. Skoulidis F, et al. Sotorasib for Lung Cancers with KRAS p.G12C Mutation. N Engl J Med. 2021;384:2371–2381. doi: 10.1056/NEJMoa2103695. - DOI - PMC - PubMed
    1. Awad MM, et al. Acquired Resistance to KRASG12C Inhibition in Cancer. N Engl J Med. 2021;384:2382–2393. doi: 10.1056/NEJMoa2105281. - DOI - PMC - PubMed

MeSH terms