. 2024 Apr 19;9(94):eadg1094.
doi: 10.1126/sciimmunol.adg1094. Epub 2024 Apr 19.

TIM-3+ CD8 T cells with a terminally exhausted phenotype retain functional capacity in hematological malignancies

Affiliations

TIM-3+ CD8 T cells with a terminally exhausted phenotype retain functional capacity in hematological malignancies

Simone A Minnie et al. Sci Immunol. .

Abstract

Chronic antigen stimulation is thought to generate dysfunctional CD8 T cells. Here, we identify a CD8 T cell subset in the bone marrow tumor microenvironment that, despite an apparent terminally exhausted phenotype (TPHEX), expressed granzymes, perforin, and IFN-γ. Concurrent gene expression and DNA accessibility revealed that genes encoding these functional proteins correlated with BATF expression and motif accessibility. IFN-γ+ TPHEX effectively killed myeloma with comparable efficacy to transitory effectors, and disease progression correlated with numerical deficits in IFN-γ+ TPHEX. We also observed IFN-γ+ TPHEX within CD19-targeted chimeric antigen receptor T cells, which killed CD19+ leukemia cells. An IFN-γ+ TPHEX gene signature was recapitulated in TEX cells from human cancers, including myeloma and lymphoma. Here, we characterize a TEX subset in hematological malignancies that paradoxically retains function and is distinct from dysfunctional TEX found in chronic viral infections. Thus, IFN-γ+ TPHEX represent a potential target for immunotherapy of blood cancers.


Conflict of interest statement

Competing Interests:

SRR is a founder and shareholder of Lyell Immunopharma and Juno Therapeutics, a Bristol Myers Squibb company. SRR serves as an advisor to Lyell Immunopharma and Adaptive Biotechnologies, has intellectual property licensed to Lyell Immunopharma and Juno/BMS, and receives research support from Lyell Immunopharma and Bristol Myers Squibb. DJG has received research funding, has served as an advisor and has received royalties from Juno Therapeutics, a Bristol-Myers Squibb company; has served as an advisor and received research funding from Seattle Genetics; has served as an advisor for GlaxoSmithKline, Celgene, Janssen Biotech, Ensoma and Legend Biotech; and has received research funding from SpringWorks Therapeutics, Sanofi, and Cellectar Biosciences. GRH has consulted for Generon Corporation, NapaJen Pharma, iTeos Therapeutics, Neoleukin Therapeutics, CSL Behring, Cynata Therapeutics and has received research funding from Compass Therapeutics, Syndax Pharmaceuticals, Applied Molecular Transport, Serplus Technology, Heat Biologics, Laevoroc Oncology and iTeos Therapeutics. All other authors declare that they have no competing interests.

Figures
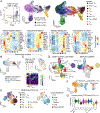
Figure 1:
Figure 1:. Myeloma generates distinct TEX signatures in the bone marrow.
(A) UMAP embedding of RNA data from CD8 T cells isolated from BM of mice with relapsed myeloma (n = 4 mice pooled) at 7 weeks post-transplant. Cells are colored by cluster with RNA velocity vectors depicting differentiation trajectory. Heatmaps of average gene expression across identified clusters. (B) Pseudo single cell projection of bulk RNA expression data from SV40 (exhausted phenotype) and OT1 (effector phenotype) T cells. (C) Embedding of polyclonal CD8 T cells from Yummer1.7 melanoma model colored by clusters with ViewmastR heatmap identifying cluster 1 as being analogous to IFNγ+ TPHEX. (D) Co-embedding of single cell RNA expression data from CD8 T cell subsets in (A) and from LCMV infection colored by clusters. (E) Embedding of CD8 T cells from BM of MM-bearing mice at 4 weeks post-SCT showing clusters analogous to those identified in (A) using ViewmastR (left) and colored by TCR clone size (right). Small = 1–5, medium = 6–20, large = 21–100, hyperexpanded = 101–500. (F) Embedding colored by gene score from terminally exhausted human T cells from renal carcinoma dataset. (G) Violin plot of gene score from human neoantigen-specific CD8 T cells within each cluster from (A).
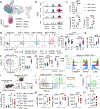
Figure 2:
Figure 2:. CX3CR1TIM-3+ TOX+ CD8 T cells produce cytolytic molecules and IFNγ in vivo.
(A) UMAP embedding of RNA data from Fig. 1. Here cells are colored by subsets based on cell surface markers expression (CITE-seq) of TIM-3 and PD-1. (B) Violin plot depicting gene expression in TIM-3 and PD-1 subsets. (C) Expression of TOX (n = 12; Kruskal-Wallis test with Dunn’s test), granzyme B (n = 4), and perforin (n = 6) in TIM-3 and PD-1 subsets from BM at 7 weeks post-transplant. (D) IFNγ and IL-10 reporter protein expression in subsets with + representative plots (n = 19; Two-Way ANOVA with Sidak’s test). (E) MFI of IFNγ in IFNγ+ cells in each subset (n = 12). (F) Representative flow cytometry plot and quantification of CD101 and CX3CR1 expression on TIM-3+ PD-1+ CD8 T cells (n = 11). (G) IFNγ MFI in CD101 and CX3CR1 subsets. CX3CR1CD101+ cells were additionally split based on expression of Ly6a (n = 11). IFNγ+ TPHEX are TIM-3+PD-1+CX3CR1. (H) Histograms depicting CX3CR1, CD101 and Ly6a expression on TIM-3+PD-1+ T cells expressing granzyme B and granzyme A (GzmB+ GzmA+), GzmB only, and GzmA only (concatenated from n = 11). (I-N) Female Rag2/IL2rg−\− mice were naïve (no myeloma) or were injected with male HY-antigen-expressing Vk28158 (myeloma). Once M-bands were detectable, 5000 MataHari (HY-antigen specific TCR transgenic) CD8 T cells were injected, and BM was harvested 8 days later. (I) Experimental design. (J) Representative contour plots showing PD-1 and TIM-3 expression (left) FMO controls and (right) full stain and (K) CX3CR1 and TOX expression on MataHari CD8 T cells from myeloma and no myeloma mice. (L) Total number of MataHari CD8 T cells subsets based on TIM-3 and PD-1 expression. (M) MFI of Ly6a, perforin and granzyme B in subsets. (N) Frequency of IFNγ+ cells within MataHari CD8 T cell subsets after ex vivo stimulation with PMA/ionomycin (RM One-Way ANOVA). Data is mean ± SEM. Each symbol represents an individual mouse. One-Way ANOVA with Tukey’s test unless otherwise stated. * p< 0.05, ** p<0.01, *** p<0.001, **** p<0.0001.
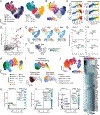
Figure 3:
Figure 3:. Expression of functional genes in IFNγ+ TPHEX correlates with BATF motif accessibility.
Mice were transplanted with BM and T cells from a genetically matched donor. Recipients were either never injected with tumor (MM-free) or had controlled (MM-controlled) or progressive myeloma (MM-relapsed) at 6 weeks post-transplant. BM was harvested for analysis of CD8 T cells by concurrent single cell RNA and ATAC sequencing. (A) WNN embedding colored by group (left) and identified CD8 T cell clusters (right). (B) WNN embedding with Pseudotime analysis from naïve (TN) to TEX clusters. (C) Gene expression (left) and chromatin accessibility (right) of functional proteins over pseudotime. (D) Experiment wide gene regulation score of transcription factor (TFs) motifs. (E) Gene expression of Batf, Tox and Ifng. (F) Single cell accessibility of Batf binding domain measured by ChromVAR. (G) Inferred activating (top right) and repressing (top left) TFs of Havcr2, Pdcd1, Ifng, and Prf1. (H) WNN embedding of T cells from MM-relapsed mice in (A) colored by clusters analogous to subsets identified in Fig. 1. (I) ATAC embedding colored by myeloma dataset clusters (top) and terminally exhausted clusters from chronic LCMV (bottom left) and solid tumors (bottom right). (J) WNN embedding colored by latent time with heatmap showing chromatin accessibility across latent time. (K) Differential motif accessibility of TFs in IFNγ+ TPHEX versus other TEX clusters. TFs of interest are highlighted in colored boxes.
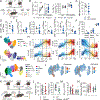
Figure 4:
Figure 4:. Myeloma progression is associated with a reduced ratio of IFNγ+ TPHEX and TPEX to myeloma cells.
Recipient C57Bl/6 × PTPRCA (CD45.1/CD45.2) mice were transplanted with HULK donor (IFNγ-YFP × IL-10-GFP × FoxP3-RFP; CD45.2) grafts. Recipients were either never injected with tumor (MM-free) or had controlled (MM-controlled) or progressive myeloma (MM-relapsed) at 6–7 weeks post-transplant. BM was harvested for analysis of CD8 T cells using flow cytometry. (A) Representative contour plots and frequency of PD-1+TIM-3 and PD-1+TIM-3+ cells (MM-free n = 8; MM-controlled n = 10; MM-relapsed n = 19). Kruskal-Wallis with Dunn’s Test. (B) Representative contour plot and frequency of TPEX (Ly108hi PD-1+) cells. (MM-free n = 5; MM-controlled n = 9; MM-relapsed n = 24). Kruskal-Wallis with Dunn’s Test. (C) Representative contour plots and frequency of IFNγ+IL-10 and IFNγ+IL-10+ cells (MM-free n = 8; MM-controlled n = 10; MM-relapsed n = 19). One-way ANOVA with Tukey’s test. (D) Representative contour plots and frequency of Pfp+GzmB and Pfp+ GzmB+ cells and (E) histograms and MFI of perforin in all Pfp+ cells (MM-free n = 5; MM-controlled n = 4; MM-relapsed n = 11). One-way ANOVA with Tukey’s test. (F) Sternum was harvested at MM relapse for VECTRA multispectral imaging of myeloma lesions in BM. White circles highlight populations of interest including TOX+ and TCF1+ CD8 T cells. (G) Quantification and (H) correlation of TIM-3+PD-1+ CD8 T (left) and MM (right) cell numbers in controlled and relapsed recipients. (I) ratio of T cells to myeloma for TIM-3+PD-1+ cells and TPEX cells (MM-controlled n = 10; MM-relapsed n = 24). Mann-Whitney t test and Pearson r correlation. (J) Fold change in myeloma cell and TIM-3+ T cell number in MM-relapsed mice relative to MM-controlled mice. Mann-Whitney t test. (K) Sort purified PD-1+TIM-3+CX3CR1 (IFNγ+ TPHEX), CX3CR1+, or PD-1 T cells were cultured with myeloma cells for 17 hours followed by Annexin V and 7AAD staining. % Killing (7AAD+) was calculated using a viability baseline from myeloma only wells. Error bars are from 3 biological replicates (PD-1 from 2 replicates) with 5 mice pooled per biological replicate. Data is mean ± SEM. Each symbol represents an individual mouse. ** p<0.01, *** p<0.001, **** p<0.0001.
Figure 5:
Figure 5:. CD11c+ cells and IL-6 signaling promoted IFNγ+ TPHEX differentiation in the myeloma microenvironment.
(A-F) Recipient C57Bl/6 or CD11cDOG mice were transplanted with B6. or CD11cDOG donor BM and IFNγ-YFP donor T cell grafts. BM aspirates (BMA) were taken prior to treatment with diphtheria toxin (DT) and BM was harvested two weeks later (n = 5 – 8 per group). (A) Experimental design. (B) Frequency of PD-1+TIM-3+cells within CD8 T cells and IFNγ-YFP+ cells within PD-1+ TIM-3+ cells in BMAs pre-DT and in BM post-DT. Wilcoxon Test. (C) Total number of myeloma cells (CD138+CD155+) and (D) CD8 T cells per femur post-DT. (E) Total number per femur of TCM (CD44+CD62L+), TPEX (LY108hiPD-1+), transitory TEX (PD-1+TIM-3+CX3CR1+), IFNγ+ TPHEX (PD-1+TIM-3+CX3CR1) and GzmA+ TEX (PD-1+TIM-3GzmA+) post-DT. (F) Frequency of granzyme B, granzyme A and perforin (Pfp) expressing cells in IFNγ+ TPHEX. (G) Repeated embeddings of multiome data from Fig. 3A and B colored by cluster and pseudotime trajectory. (H) Expression of genes encoding cytokine receptors over pseudotime. Dotted lines indicate pseudotime where TEX are found in MM-relapsed mice. (I) Repeated embedding from Fig. 3H colored by cluster and (J) by gene set enrichment for genes associated with glycolysis and OXPHOS pathways from Guo et al. Nat Immunol, 2021. (K-N) MM-bearing C57Bl/6 × Ptprca (CD45.1/CD45.2) recipients were transplanted with CD45.1/CD45.2 BM and CD8 T cells from WT (CD45.1) and transgenic (CD45.2) mice. Transgenic mice were CD4cre+ or CD4cre+ x IL-6Rfl/fl. CD4 T cells were from WT mice. Mice were sacrificed and BM was harvested at 7 weeks post-transplant (n = 13–15 from 4 experiments). (L) Frequency of PD-1+TIM-3+ cells within WT and Tg T cells in the same mice. Left graph: Tg = CD4cre+ and right graph: Tg = CD4cre+ × IL-6Rfl/fl. (M) Frequency of TPEX within WT and Tg T cells. (N) Granzyme B MFI in PD-1+TIM-3+ cells. Student’s t test. Data is mean ± SEM. Each symbol represents an individual mouse.*p<0.05, **p<0.01.
Figure 6:
Figure 6:. CD19 CAR T cells with a IFNγ + TPHEX phenotype effectively kill leukemia cells.
B6 mice bearing CD19+ B cell acute lymphoblastic leukemia were injected with murine CD19 CAR T cells (HULK; B6 background). CAR T cells from BM were harvested 25 days after primary transfer and were adoptively transferred to secondary B-ALL-bearing recipients. BM CAR T cells (human eGFR+) were harvested 19 days later and analyzed. (A) Representative plot of CX3CR1 and TIM-3 expression and quantification of subsets within CAR T cells. (B) Histogram of IFNγ-YFP expression (with reporter negative endogenous cells as a control) and quantification of MFI within CAR T cell subsets. (C) Histograms depicting CD101 and CD39 expression with quantification of MFI within CAR T cell subsets. (D) Histogram and quantification of IFNγ-YFP expression in TIM-3+ cells split by expression of CX3CR1 with/without CD101 co-expression. (A-D) Data is mean ± SEM. Each symbol represents an individual mouse (n = 5). One-Way ANOVA with Tukey’s test. (E-G) 5’ RNA sequencing was performed on CD8 CAR T cells. (E) UMAP embedding colored by clusters. (F) Dot plot showing gene expression within each cluster. (G) Plot depicts clonal overlap between clusters. (H) Sort purified TIM-3+ CX3CR1 CAR T cells, or unfractionated CAR T cells, were pooled from 5 biological replicates and cultured with B-ALL cells for 18 hours followed by Annexin V and 7AAD staining. Representative plots of Annexin V and 7AAD staining across effector:target ratios. The % killing was calculated using a viability baseline from B-ALL only wells (>90%). Data is mean ± SEM and error bars are from technical replicates (n = 3–5 per condition). Student’s T-test. ** p<0.01, **** p<0.0001.
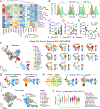
Figure 7:
Figure 7:. IFNγ+ TPHEX are found in patients with multiple myeloma and are expanded following autologous stem cell transplantation.
(A-E) Bone marrow samples from patients prior to autologous stem cell transplantation (ASCT; pre-ASCT), after ASCT (post-ASCT) and at disease relapse post-ASCT were thawed and stained for analysis via flow cytometry (n = 17–23). Data represent mean ± SEM. *p<0.05. (A) Heatmap of maker expression (MFI) across FlowSOM CD8 T cells populations. (B) Representative histograms of PD-1, CX3CR1, granzyme B and TIM-3 expression on naïve T cells (grey), CX3CR1+ effector cells (orange) and TIM-3+TEX cells (green). (C) Frequency of TIM-3+GzmB+ cells within CD8 T cells across the three cohorts (Kruskal-Wallis test with Dunn’s multiple comparisons test) and (D) in patients from (C) with paired samples across all timepoints (n = 8; Friedman test with Dunn’s multiple comparisons test). (E) Correlation of frequency of TIM-3+ GzmB+ cells within CD8 T cells and % CD138+ cells by morphology in patients from (C) with relapsed myeloma (n = 15). (F) Left: UMAP embedding of CD8 T cells from patients with multiple myeloma from Zheng et al. Science, 2021. Top embedding colored by cluster, bottom embedding colored by T cell location (tumor = blue, peripheral blood = red). Right: Embeddings colored by gene expression. (G) UMAP embedding colored by gene signature associated with BATF-expressing TEX in humans (left) and mouse IFNγ+ TPHEX signature from our dataset in Fig. 1 (right). (H) Venn diagram depicting the number of shared genes between the human and mouse gene signatures, which formed a ‘conserved IFNγ+ TPHEX signature’ and embeddings of human (left) and mouse (right) myeloma datasets colored by this signature. (I) Embedding of CD8 T cells from pan-cancer dataset from Zheng et al. Science, 2021 colored by cluster (left) and by expression of the conserved IFNγ+ TPHEX signature (right). (J) Violin plot showing gene score for the IFNγ+ TPHEX signature within the Tex.CXCL13 cluster stratified by cancer type. Data represent mean ± SEM. *p<0.05.

Similar articles

Cited by

References

    1. Scott AC, Dundar F, Zumbo P, Chandran SS, Klebanoff CA, Shakiba M, Trivedi P, Menocal L, Appleby H, Camara S, Zamarin D, Walther T, Snyder A, Femia MR, Comen EA, Wen HY, Hellmann MD, Anandasabapathy N, Liu Y, Altorki NK, Lauer P, Levy O, Glickman MS, Kaye J, Betel D, Philip M, Schietinger A. TOX is a critical regulator of tumour-specific T cell differentiation. Nature. 2019;571(7764):270–274. - PMC - PubMed
    1. Khan O, Giles JR, McDonald S, Manne S, Ngiow SF, Patel KP, Werner MT, Huang AC, Alexander KA, Wu JE, Attanasio J, Yan P, George SM, Bengsch B, Staupe RP, Donahue G, Xu W, Amaravadi RK, Xu X, Karakousis GC, Mitchell TC, Schuchter LM, Kaye J, Berger SL, Wherry EJ. TOX transcriptionally and epigenetically programs CD8(+) T cell exhaustion. Nature. 2019;571(7764):211–218. - PMC - PubMed
    1. Seo H, Chen J, González-Avalos E, Samaniego-Castruita D, Das A, Wang YH, López-Moyado IF, Georges RO, Zhang W, Onodera A, Wu CJ, Lu LF, Hogan PG, Bhandoola A, Rao A. TOX and TOX2 transcription factors cooperate with NR4A transcription factors to impose CD8(+) T cell exhaustion. Proceedings of the National Academy of Sciences of the United States of America. 2019;116(25):12410–12415. - PMC - PubMed
    1. Yao C, Sun H-W, Lacey NE, Ji Y, Moseman EA, Shih H-Y, Heuston EF, Kirby M, Anderson S, Cheng J, Khan O, Handon R, Reilley J, Fioravanti J, Hu J, Gossa S, Wherry EJ, Gattinoni L, McGavern DB, O’Shea JJ, Schwartzberg PL, Wu T. Single-cell RNA-seq reveals TOX as a key regulator of CD8+ T cell persistence in chronic infection. Nature immunology. 2019;20(7):890–901. - PMC - PubMed
    1. Beltra JC, Manne S, Abdel-Hakeem MS, Kurachi M, Giles JR, Chen Z, Casella V, Ngiow SF, Khan O, Huang YJ, Yan P, Nzingha K, Xu W, Amaravadi RK, Xu X, Karakousis GC, Mitchell TC, Schuchter LM, Huang AC, Wherry EJ. Developmental Relationships of Four Exhausted CD8(+) T Cell Subsets Reveals Underlying Transcriptional and Epigenetic Landscape Control Mechanisms. Immunity. 2020;52(5):825–841.e828. - PMC - PubMed

Substances