. 2024 Apr 16;15(1):3286.
doi: 10.1038/s41467-024-47530-y.

Bacterial peptidoglycan acts as a digestive signal mediating host adaptation to diverse food resources in C. elegans

Affiliations

Bacterial peptidoglycan acts as a digestive signal mediating host adaptation to diverse food resources in C. elegans

Fanrui Hao et al. Nat Commun. .

Abstract

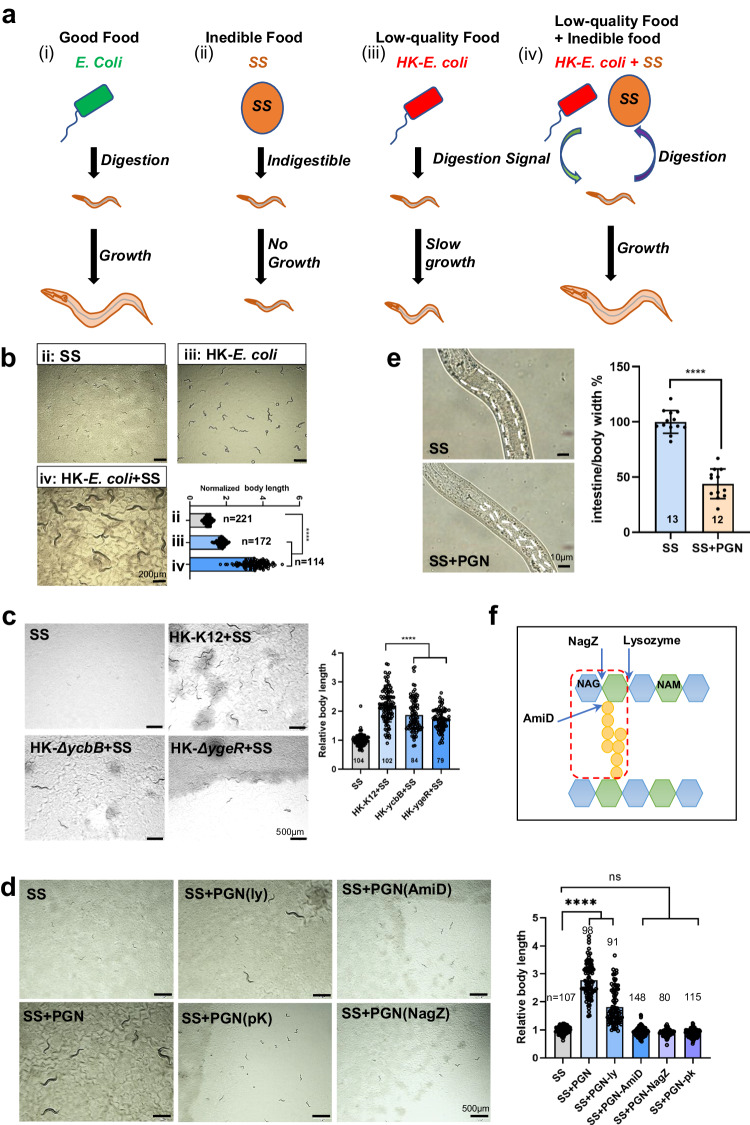
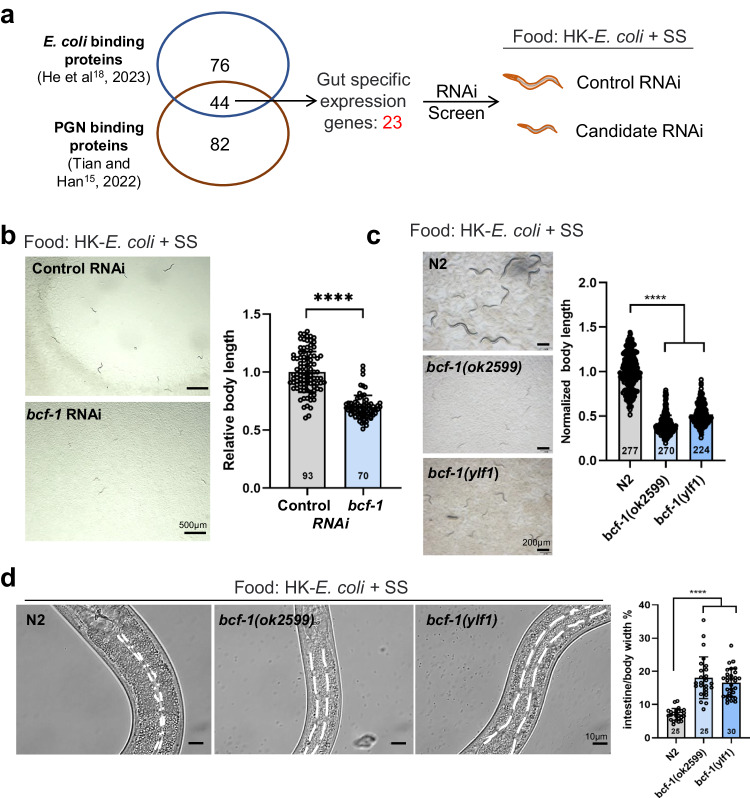
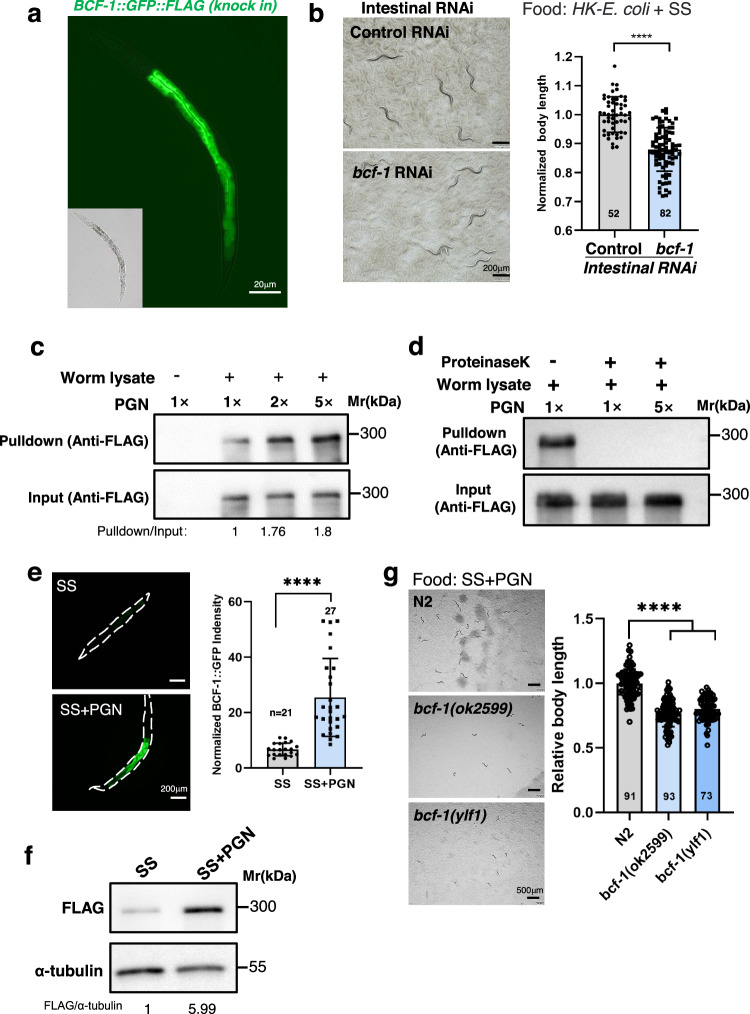
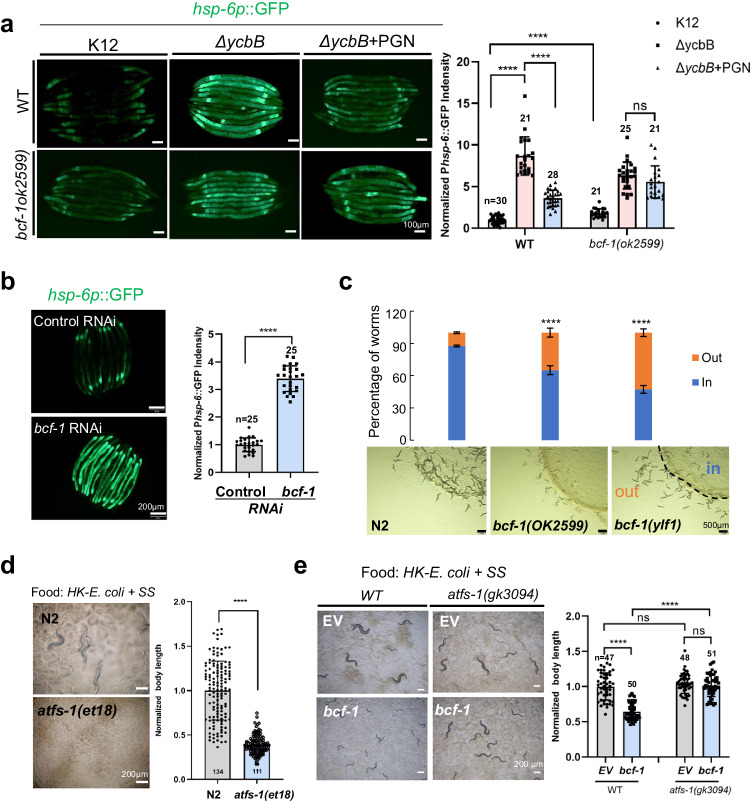
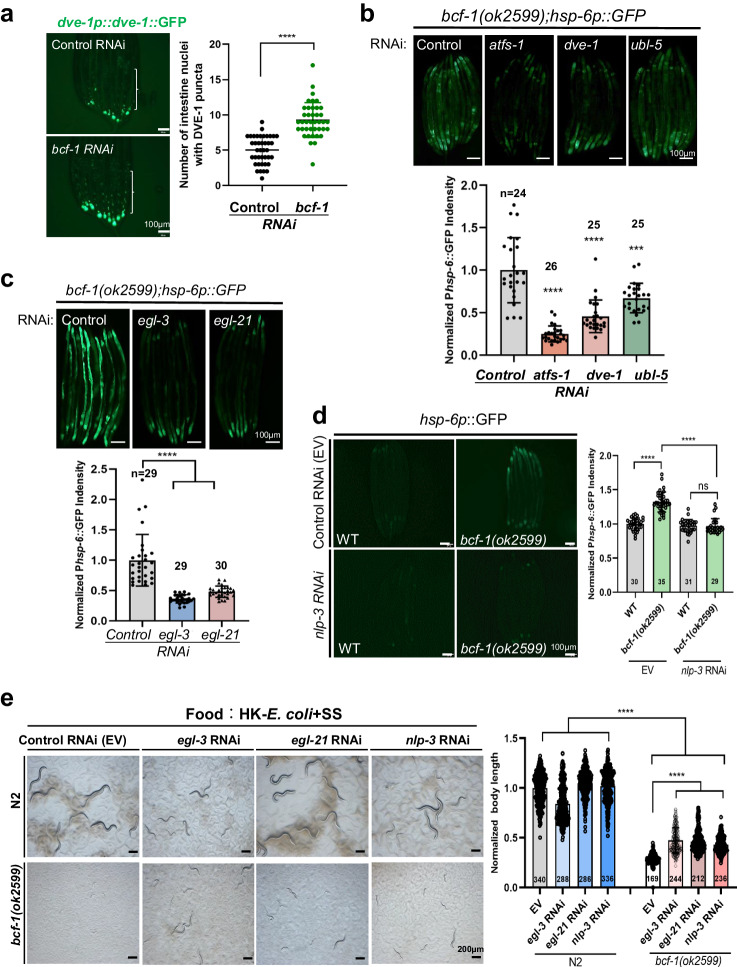
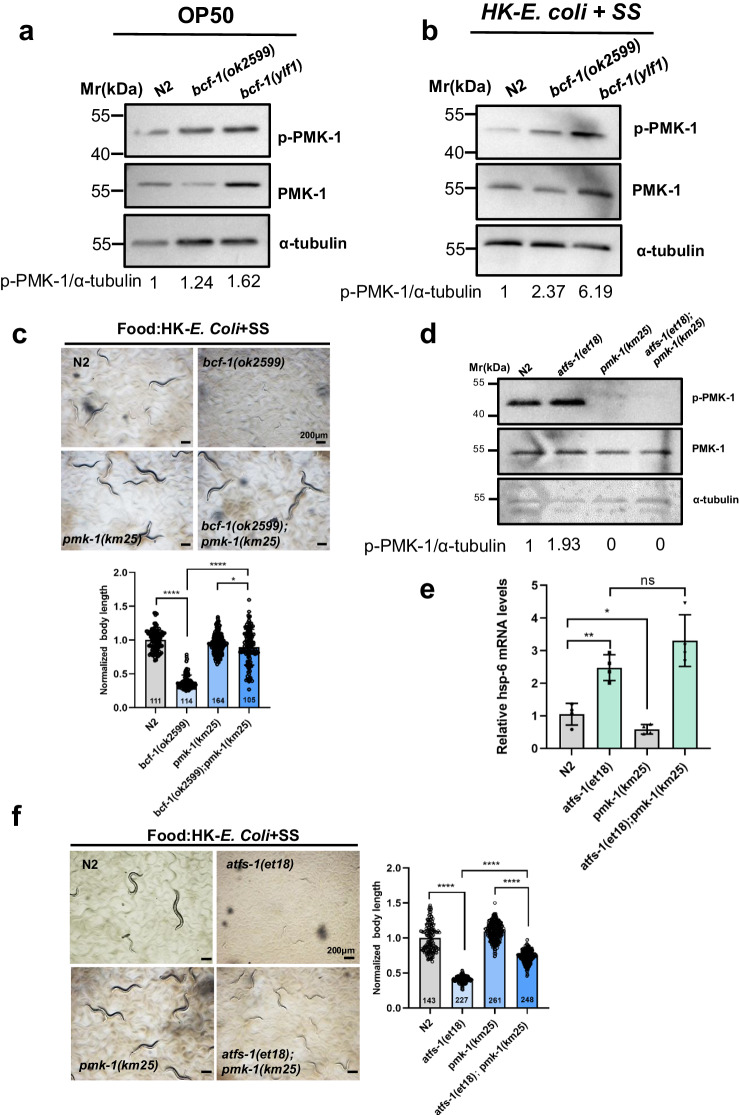
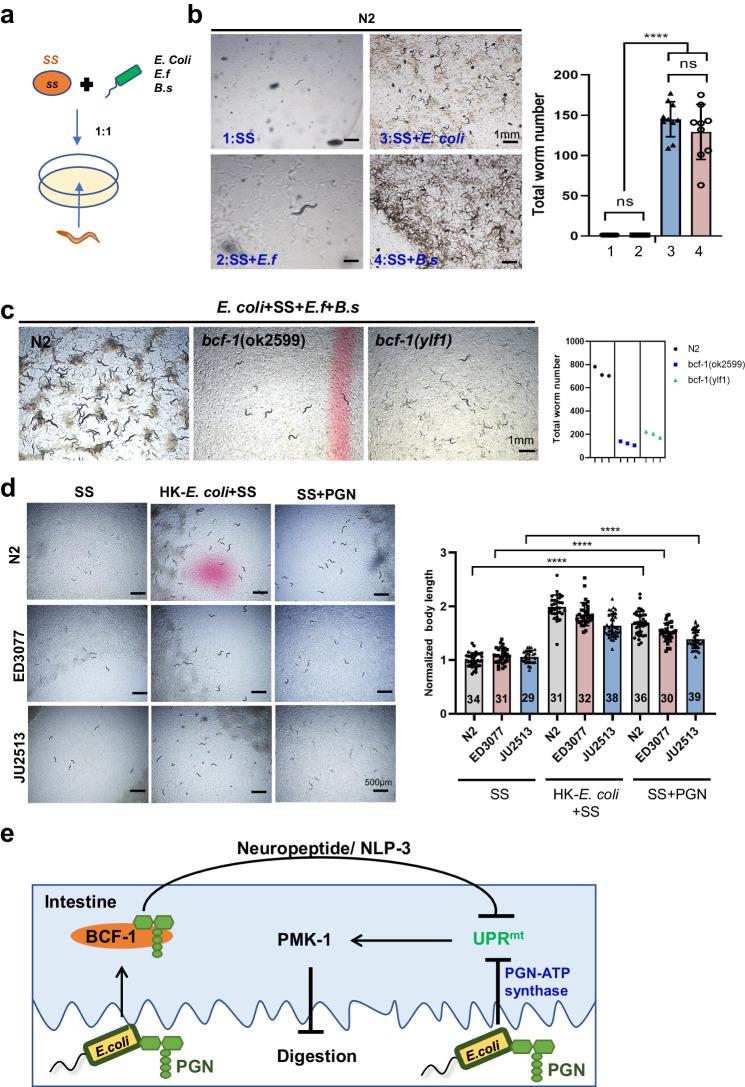
Food availability and usage is a major adaptive force for the successful survival of animals in nature, yet little is known about the specific signals that activate the host digestive system to allow for the consumption of varied foods. Here, by using a food digestion system in C. elegans, we discover that bacterial peptidoglycan (PGN) is a unique food signal that activates animals to digest inedible food. We identified that a glycosylated protein, Bacterial Colonization Factor-1 (BCF-1), in the gut interacts with bacterial PGN, leading to the inhibition of the mitochondrial unfolded protein response (UPRmt) by regulating the release of Neuropeptide-Like Protein (NLP-3). Interestingly, activating UPRmt was found to hinder food digestion, which depends on the innate immune p38 MAPK/PMK-1 pathway. Conversely, inhibiting PMK-1 was able to alleviate digestion defects in bcf-1 mutants. Furthermore, we demonstrate that animals with digestion defects experience reduced natural adaptation capabilities. This study reveals that PGN-BCF-1 interaction acts as "good-food signal" to promote food digestion and animal growth, which facilitates adaptation of the host animals by increasing ability to consume a wide range of foods in their natural environment.


Conflict of interest statement

The authors declare no competing interests.

Figures

Fig. 1
Fig. 1. PGN activates C. elegans digestive system.
a The cartoon illustration shows the developmental progression of animals grown on different quality foods. The signal from low-quality food (HK-E. coli) activates animals to digest inedible food, Staphylococcus saprophyticus (SS), which potentially increases fitness in animals by enabling them to consume a wider range of foods in nature. b Developmental phenotype of N2 grown on the SS, HK-E. coli, and HK-E. coli + SS at 20°C for 7d. n = 221 for SS, n = 172 for HK-E. coli, n = 114 for HK-E. coli + SS. Statistical significance was calculated using multiple unpaired t-tests (two-tailed). Obtained p values were as follows: SS vs. HK-E. coli; ****p < 0.0001. SS vs. HK-E. coli + SS; ****p < 0.0001. Scale bar, 500µm. c Developmental phenotype of N2 grown on the HK-E. coli (ΔycbB or ΔygeR mutant) + SS or SS at 20°C for 5d post-L1 synchronization. n = 104 for SS, n = 102 for HK-K12 + SS, n = 84 for HK-ycbB + SS, n = 79 for HK-ygeR + SS. Statistical significance was calculated using multiple unpaired t-tests (two-tailed). Obtained p values were as follows: HK-K12 + SS vs. HK-ycbB + SS and HK-ygeR + SS; ****p < 0.0001, respectively. Scale bar, 500µm d Developmental progression of animals grown on SS+ enzyme-treated PGN at 7d at 20°C. Scale bar, 500µm. ly: lysozyme; pK: proteinaseK; NagZ, glucosaminidase; AmiD, amidase; n = 107 for SS, n = 98 for SS + PGN, n = 91 for SS + PGN-ly(lysozyme), n = 148 for SS + PGN-AmiD, n = 80 for SS + PGN-NagZ, n = 115 for SS + PGN-pk(proteaseK). Statistical significance was calculated using multiple unpaired t-tests (two-tailed). Obtained p values were as follows:SS vs. SS + PGN and SS + PGN-ly(lysozyme); ****p < 0.0001, respectively. e Microscope image and bar graph show the relative width of intestinal lumen in N2 animals fed SS or SS + PGN food. n = 13 for SS, n = 12 for SS + PGN. Statistical significance was calculated using multiple unpaired t-tests (two-tailed). Obtained p values were as follows: SS vs. SS + PGN; ****p < 0.0001. f Schematic representation of the peptidoglycan structure and cleavage points of enzymes by arrows. Red box indicates the structure for the digestion signal from PGN, which contains 5’NAG-NAM disaccharide muropeptides with an amino acid peptide attached to NAM. NagZ, glucosaminidase; AmiD, amidase; NAG, 3N’-acetylglucosamine; NAM, 5N’-acetylmuramic acid. The developmental progression of animals is scored by relative worm body length. For all panels, n= number of animals which were scored from at least three independent experiments. Data are represented as mean ± SD. ****p < 0.0001, *** P < 0.001, **P < 0.01, *P < 0.05, ns: no significant difference. Source data are provided as a Source Data file.
Fig. 2
Fig. 2. Screening PGN-Binding proteins involved in food digestion.
a Cartoon illustration showing the screening strategy used to find the PGN-binding protein that activates animals to digest SS. Venn diagram shows the total number of identified E. coli binding proteins and PGN binding proteins, along with their overlap. Out of the 44 overlapping genes, 23 intestinal-specific genes were tested by RNAi screening. RNAi knockdown of the candidate genes is expected to result in a slow-growth phenotype in animals fed HK-E. coli + SS. b, c Developmental progression of animals with bcf-1 RNAi (b) or bcf-1 mutations (c) when grown on HK- E. coli + SS. b n = 93 for control RNAi, n = 70 for bcf-1 RNAi. Statistical significance was calculated using multiple unpaired t-tests (two-tailed). Obtained p values were as follows: control RNAi vs. bcf-1 RNAi; ****p < 0.0001. c n = 277 for N2, n = 270 for bcf-1(ok2599), n = 224 for bcf-1(ylf1). Statistical significance was calculated using multiple unpaired t-tests (two-tailed). Obtained p values were as follows: N2 vs. bcf-1(ok2599) and bcf-1(ylf1); ****p < 0.0001, respectively. d Microscope images and bar graph show the relative width of the intestinal lumen between N2 and bcf-1 mutants when fed HK-E. coli + SS. n = 25 for N2, n = 25 for bcf-1(ok2599), n = 30 for bcf-1(ylf1). Statistical significance was calculated using multiple unpaired t-tests (two-tailed). Obtained p values were as follows: N2 vs. bcf-1(ok2599) and bcf-1(ylf1); ****p < 0.0001, respectively. Developmental progression of animals is scored by relative worm body length. For all panels, n= number of animals which were scored from at least three independent experiments. Data are represented as mean ± SD. ****p < 0.0001, *** P < 0.001, **P < 0.01, *P < 0.05, ns: no significant difference. Source data are provided as a Source Data file.
Fig. 3
Fig. 3. PGN activates food digestion through BCF-1.
a Fluorescence image showing that BCF-1 is specifically expressed in the intestine, using a single-copy insertion of the bcf-1p::bcf-1::gfp::flag reporter strain. b Developmental progression of animals with intestinal-specific bcf-1 RNAi when grown on HK- E. coli + SS for 4d at 20°C. n = 52 for control RNAi, n = 82 for bcf-1 RNAi.Statistical significance was calculated using multiple unpaired t-tests (two-tailed). Obtained p values were as follows: control RNAi vs. bcf-1 RNAi; ****p < 0.0001. c In vitro PGN binding assay (pull-down assay) showing that PGN interacts with BCF-1 protein. BCF-1 from worm lysates (bcf-1p::bcf-1::gfp::flag reporter strain) was bound to PGN and the binding increased in a concentration-dependent manner. Anti-Flag was used as an input control, which indicate that PGN was incubated with an all most equivalent amount of BCF-1 tagged (BCF-1-GFP-FLAG) proteins. d Proteinase K treatment, which is sensitive to short peptides on PGN, eliminated the binding of PGN to BCF-1. e Microscope images and bar graph showing that BCF-1::GFP expression is induced in the bcf-1p::bcf-1::gfp::flag reporter strain when fed with SS + PGN. n = 21 for SS, n = 27 for SS + PGN. Statistical significance was calculated using multiple unpaired t-tests (two-tailed). Obtained p values were as follows: SS vs. SS + PGN; ****p < 0.0001. f Western blot showing the level of BCF-1::GFP::FLAG in L1 animals feeding SS and SS + PGN. g Developmental progression of the bcf-1 mutant grown on SS + PGN at 5d at 20°C. n = 91 for N2, n = 93 for bcf-1(ok2599), n = 73 for bcf-1(ylf1). Statistical significance was calculated using multiple unpaired t-tests (two-tailed). Obtained p values were as follows: N2 vs. bcf-1(ok2599) and bcf-1(ylf1); ****p < 0.0001, respectively. The developmental progression of animals is scored by relative worm body length. For all panels, n = number of animals that were scored from at least three independent experiments. Data are represented as mean ± SD. ****p < 0.0001, *** P < 0.001, **P < 0.01, *P < 0.05, ns: no significant difference. Source data are provided as a Source Data file.
Fig. 4
Fig. 4. PGN inhibits UPRmt through bcf-1 for food digestion.
a Microscope image and bar graph showing the role of PGN in inhibiting UPRmt depends on BCF-1. UPRmt was activated by feeding the PGN mutant (ΔycbB), and was suppressed by the addition of PGN. However, the addition of PGN failed to suppress UPRmt in the bcf-1 mutant. n = 30, 22 and 28 for WT on K12, ΔycbB andΔycbB + PGN, respectively. n = 21, 25 and 21 for bcf-1(ok2599) on K12, ΔycbB andΔycbB + PGN, respectively. Statistical significance was calculated using multiple unpaired t-tests (two-tailed). Obtained p values were as follows: WT on K12 vs. WT on ΔycbB andΔycbB + PGN; ****p < 0.0001, respectively. bcf-1(ok2599) on K12 vs. bcf-1(ok2599) on ΔycbB andΔycbB + PGN; ****p < 0.0001, respectively. WT on K12 vs. bcf-1(ok2599) on K12; ****p < 0.0001. bcf-1(ok2599) on ΔycbB vs. bcf-1(ok2599) onΔycbB + PGN; p = 0.1164. b Fluorescence image and bar graph show that UPRmt was induced in animals with bcf-1 RNAi treatment. n = 25 for control and bcf-1 RNAi Statistical significance was calculated using multiple unpaired t-tests (two-tailed). Obtained p values were as follows: control vs. bcf-1 RNAi; ****p < 0.0001. c The food avoidance phenotype of bcf-1 mutants is depicted. Food avoidance is increased in animals with the bcf-1 mutation. 200–400 animals/assay, mean ± SD from 3 replicates. Obtained p values were as follows: N2 vs. bcf-1(ok2599) and bcf-1(ylf1); ****p < 0.0001, respectively. d Developmental progression of atfs-1(gf) grown on HK- E. coli + SS at 25°C for 3d. n = 134 for N2, n = 111 for atfs-1(et18). Statistical significance was calculated using multiple unpaired t-tests (two-tailed). Obtained p values were as follows: N2 vs. atfs-1(et18); ****p < 0.0001. e Development progression of atfs-1(gk3094) mutant animals with bcf-1 RNAi grown on HK- E. coli + SS at 25°C for 3d. n = 47 and 50 for WT on EV and bcf-1 RNAi, n = 48 and 51 for atfs-1(gk3094) on EV and bcf-1 RNAi. Statistical significance was calculated using multiple unpaired t-tests (two-tailed). Obtained p values were as follows: WT on EV vs. WT on bcf-1 RNAi; ****p < 0.0001. WT vs. atfs-1(gk3094) on bcf-1 RNAi; ****p < 0.0001. WT vs. atfs-1(gk3094) on EV; p = 0.2049. atfs-1(gk3094) on EV vs. atfs-1(gk3094) on bcf-1 RNAi; p = 0.3279. For all panels, n = number of animals which were scored from at least three independent experiments. Data are represented as mean ± SD. ****p < 0.0001, *** P < 0.001, **P < 0.01, *P < 0.05, ns: no significant difference. Source data are provided as a Source Data file.
Fig. 5
Fig. 5. UPRmt activation by bcf-1 mutation depends on neuropeptide NLP-3.
a Fluorescence image and bar graph showing that DVE-1::GFP was accumulated in intestinal nuclei in dve-1p::dve-1::gfp animals with bcf-1 RNAi treatment. n = 42 for control and bcf-1 RNAi. Statistical significance was calculated using multiple unpaired t-tests (two-tailed). Obtained p values were as follows: control vs. bcf-1 RNAi; ****p < 0.0001. b Fluorescence image and bar graph showing the level of hsp-6p::GFP in bcf-1 (ok2599) mutant animals with atfs-1, dve-1 and ubl-5 RNAi. n = 24 for control RNAi, n = 26 for atfs-1 RNAi, n = 25 for dve-1 RNAi, n = 25 for ubl-5 RNAi. Statistical significance was calculated using multiple unpaired t-tests (two-tailed). Obtained p values were as follows: control vs. atfs-1 RNAi, dve-1 RNAi and ubl-5 RNAi; ****p < 0.0001, respectively. c Fluorescence image and bar graph showing the level of hsp-6p::GFP in bcf-1 (ok2599) mutant animals with egl-3 and egl-21 RNAi. n = 29 for control RNAi, n = 29 for egl-3 RNAi, n = 30 for egl-21 RNAi. Statistical significance was calculated using multiple unpaired t-tests (two-tailed). Obtained p values were as follows: control vs. egl-3 RNAi and egl-21 RNAi; ****p < 0.0001, respectively. d Fluorescence image and bar graph showing the level of hsp-6p::GFP in bcf-1 (ok2599) mutant animals with nlp-3 RNAi. n = 30 and 31 for WT on control and nlp-3 RNAi. n = 35 and 29 for bcf-1(ok2599) on control and nlp-3 RNAi. Statistical significance was calculated using multiple unpaired t-tests (two-tailed). Obtained p values were as follows: WT on control vs. nlp-3 RNAi ****p < 0.0001. bcf-1(ok2599) on WT vs. nlp-3 RNAi ****p < 0.0001. WT vs. bcf-1(ok2599) on nlp-3 RNAi; p = 0.8890. e Development progression of bcf-1 (ok2599) mutant animals with nlp-3, egl-3 and egl-21 RNAi when grown on HK- E. coli + SS at 20°C for 4d. n = 340, 288, 286 and 336 for N2 on EV, egl-3 RNAi, egl-21 RNAi and nlp-3 RNAi. n = 169, 244, 212 and 236 for bcf-1(ok2599) on EV, egl-3 RNAi, egl-21 RNAi and nlp-3 RNAi. Statistical significance was calculated using multiple unpaired t-tests (two-tailed). Obtained p values were as follows: N2 vs. bcf-1(ok2599); ****p < 0.0001. bcf-1(ok2599) on EV vs. egl-3 RNAi, egl-21 RNAi and nlp-3 RNAi; ****p < 0.0001, respectively. For all panels, n= number of animals which were scored from at least three independent experiments. Data are represented as mean ± SD. ****p < 0.0001, *** P < 0.001, **P < 0.01, *P < 0.05, ns: no significant difference. Source data are provided as a Source Data file.
Fig. 6
Fig. 6. Digestion defects in bcf-1(ok2599) and atfs-1(et18) mutant with UPRmt activation depend on PMK-1.
a Western blot showing the level of p-PMK-1 in L4 animals grown under OP50 feeding conditions. b Western blot showing the level of p-PMK-1 in L1 animals grown under HK- E. coli + SS feeding conditions for 24 h. c Developmental progression of bcf-1(ok2599), pmk-1(km25) and bcf-1(ok2599);pmk-1(km25) grown on HK-E. coli + SS at 3d at 20°C. n = 111 for N2, n = 114 for bcf-1(ok2599), n = 164 for pmk-1(km25), n = 105 for bcf-1(ok2599);pmk-1(km25). Statistical significance was calculated using multiple unpaired t-tests (two-tailed). Obtained p values were as follows: N2 vs. bcf-1(ok2599); ****p < 0.0001. bcf-1(ok2599) vs. bcf-1(ok2599);pmk-1(km25); ****p < 0.0001. pmk-1(km25) vs. bcf-1(ok2599);pmk-1(km25); p = 0.0491. Scale bar, 200µm. d Western blot showing the level of p-PMK-1 in L4 animals grown under OP50 feeding conditions. e Results of qRT-PCR analysis showing the expression of hsp-6 in L4 animals grown under OP50 feeding conditions. mean ± SD from 3 replicates. Obtained p values were as follows: N2 vs. atfs-1(et18); p = 0.0015. N2 vs. pmk-1(km25); p = 0.0436. atfs-1(et18) vs. atfs-1(et18); pmk-1(km25); p = 0.1121. f Developmental progression of atfs-1(et18), pmk-1(km25) andatfs-1(et18);pmk-1(km25) grown on HK-E. Coli + SS at 4d at 20°C. n = 143 for N2, n = 227 for atfs-1(et18), n = 261 for pmk-1(km25), n = 248 for atfs-1(et18);pmk-1(km25). Statistical significance was calculated using multiple unpaired t-tests (two-tailed). Obtained p values were as follows: N2 vs. atfs-1(et18); ****p < 0.0001. atfs-1(et18) vs. atfs-1(et18);pmk-1(km25); ****p < 0.0001. pmk-1(km25) vs. atfs-1(et18);pmk-1(km25); ****p < 0.0001. Scale bar, 200 µm. For all panels, n= number of animals which were scored from at least three independent experiments. Data are represented as mean ± SD. ****p < 0.0001, *** P < 0.001, **P < 0.01, *P < 0.05, ns: no significant difference. Source data are provided as a Source Data file.
Fig. 7
Fig. 7. The PGN-BCF1 signaling system enhances animal adaptation.
a, b Adaptation analysis in animals feeding mixed bacteria to mimic nature environment. A mixture of SS with E. coli, Enterococcus faecalis f), and Bacillus subtilis (B.s) at a 1:1 ratio was prepared as food source (a). single wild-type N2 animal was then placed on the food. After 9 days of culture, the number of animals on the plate was counted (b). In panel b, mean ± SD from 10 replicates. Obtained p values were as follows:SS + OP50 vs. SS + B.s; p = 0.3345. SS vs. SS + OP50 and SS + B.s; ****p < 0.0001, respectively. c A mixture of E. coli, Staphylococcus saprophyticus (SS), Enterococcus faecalis (E.f), and Bacillus subtilis (B.s) at a 1:1:1:1 ratio was used to mimic the natural food environment. A single wild-type N2 or bcf-1 mutant animal was seeded on the food. After 10 days of culture, the number of animals on the plate was scored. d Developmental progression of ED3077 and JU2513 grown on SS + PGN at 20°C for 3d. n = 34, 31 and 29 for N2, ED3077 and JU2513 on SS. n = 31, 32 and 38 for N2, ED3077 and JU2513 on HK-E. coli + SS. N = 36, 30 and 39 for N2, ED3077 and JU2513 on SS + PGN. Statistical significance was calculated using multiple unpaired t-tests (two-tailed). Obtained p values were as follows: N2 on SS vs. SS + PGN; ED3077 on SS vs. SS + PGN; JU2513 on SS vs. SS + PGN; ****p < 0.0001, respectively. e The model illustrates that the PGN-BCF-1 interaction acts as a “good-food signal” to promote food digestion and animal growth in bacteria-eating worms. The conserved glycosylated protein BCF-1 in nematodes interacts with bacterial PGN to inhibit UPRmt through neuropeptides (NLP-3), thereby enhancing the ability to digest inedible food (SS). PGN inhibits UPRmt through interacting with BCF-1 or ATP synthase. Activation of UPRmt inhibits food digestion through inducing PMK-1. This mechanism reveals an intriguing adaptation strategy in animals to survive in nature by increasing their capacity to digest a variety of foods through the detection of the unique bacterial cell wall component PGN. For all panels, n = number of animals that were scored from at least three independent experiments. Data are represented as mean ± SD. ****p < 0.0001, *** P < 0.001, **P < 0.01, *P < 0.05, ns: no significant difference. Source data are provided as a Source Data file.

Similar articles

Cited by

References

    1. Eisenhauer N, Guerra CA. Global maps of soil-dwelling nematode worms. Nature. 2019;572:187–188. doi: 10.1038/d41586-019-02197-0. - DOI - PubMed
    1. Freckman DW. Bacterivorous nematodes and organic-matter decomposition. Agr. Ecosyst. Environ. 1988;24:195–217. doi: 10.1016/0167-8809(88)90066-7. - DOI
    1. Ackley BD. Behavior: should I stay or should I go? Curr. Biol. 2019;29:R842–R844. doi: 10.1016/j.cub.2019.07.057. - DOI - PubMed
    1. Rhoades JL, et al. ASICs mediate food responses in an enteric serotonergic neuron that controls foraging behaviors. Cell. 2019;176:85. doi: 10.1016/j.cell.2018.11.023. - DOI - PMC - PubMed
    1. Morton GJ, Meek TH, Schwartz MW. Neurobiology of food intake in health and disease. Nat. Rev. Neurosci. 2014;15:367–378. doi: 10.1038/nrn3745. - DOI - PMC - PubMed

MeSH terms

Substances