[Preprint]. 2024 Apr 2:2024.04.01.587647.
doi: 10.1101/2024.04.01.587647.

A specific and portable gene expression program underlies antigen archiving by lymphatic endothelial cells

Affiliations

A specific and portable gene expression program underlies antigen archiving by lymphatic endothelial cells

Ryan M Sheridan et al. bioRxiv. .

Abstract

Antigens from protein subunit vaccination traffic from the tissue to the draining lymph node, either passively via the lymph or carried by dendritic cells at the local injection site. Lymph node (LN) lymphatic endothelial cells (LEC) actively acquire and archive foreign antigens, and archived antigen can be released during subsequent inflammatory stimulus to improve immune responses. Here, we answer questions about how LECs achieve durable antigen archiving and whether there are transcriptional signatures associated with LECs containing high levels of antigen. We used single cell sequencing in dissociated LN tissue to quantify antigen levels in LEC and dendritic cell populations at multiple timepoints after immunization, and used machine learning to define a unique transcriptional program within archiving LECs that can predict LEC archiving capacity in independent data sets. Finally, we validated this modeling, showing we could predict antigen archiving from a transcriptional dataset of CHIKV infected mice and demonstrated in vivo the accuracy of our prediction. Collectively, our findings establish a unique transcriptional program in LECs that promotes antigen archiving that can be translated to other systems.

Keywords: Chikungunya virus; antigen archiving; dendritic cell; fibroblastic reticular cell; gene expression program; immunization; lymph node; lymph node stromal cell; lymphatic endothelial cell.


Conflict of interest statement

CONFLICT OF INTEREST We declare no competing interest.

Figures

Figure 1.
Figure 1.
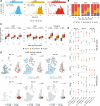
Antigen persists in discrete cell populations within the lymph node A. Experimental design B. Mean Ag-score is shown for each cell type for 2, 14, 21, and 42 days post vaccination. C. UMAP projection shows LEC subsets. D. UMAP projections show Ag-scores for LEC subsets for each timepoint. E. Mean Ag-score is shown for LEC subsets for each timepoint. F. Ag-scores are shown for each timepoint for each LEC subset. G. UMAP projection shows DC subsets. H. UMAP projections show Ag-scores for DC subsets for each timepoint. I. Mean Ag-score is shown for DC subsets for each timepoint.Ag-scores are shown for each timepoint for each DC subset. J. Ag-scores are shown for each timepoint for each DC subset.
Figure 2.
Figure 2.
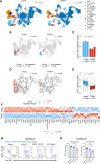
Identification of gene signatures associated with antigen archiving by LECs A. Ag-score is shown for day 14 Ag-high and -low cLECs, fLECs, and collecting LECs. B. The fraction of cells predicted to be Ag-competent is shown for each LEC subset 14, 21, and 42 days post vaccination. C. Ag-high module scores are shown for Ag-low, Ag-high, and predicted Ag-competent LECs. The Spearman correlation between Ag classes and Ag-high module score is shown for each timepoint. One-sided p values were calculated and adjusted using Benjamini-Hochberg correction. D. UMAP projections show cLEC Ag-high module scores for each timepoint. E. The expression of select genes from the Ag-high (top four) and Ag-low (bottom four) gene modules is shown for cLECs. Triangles indicate the gene is differentially expressed when compared to Ag-low cells. P values were calculated using a one-sided Wilcoxon rank sum test with Benjamini-Hochberg correction.
Figure 3.
Figure 3.
Antigen archiving by LECs is enhanced by sequential immunizations A. Experimental design B. Mean 21 day Ag-score is shown for LECs from mice that received a single vaccination (21 day or 42 day) or dual vaccination (21 day and 42 day). C. UMAP projections show 21 day Ag-scores for LEC subsets for single and dual vaccinations. D. Prior vaccination enhances antigen archiving. Ag-score is shown for single and dual vaccinations for the 21 day timepoint for each LEC subset. Other timepoints are shown in grey. P values were calculated using a one-sided Wilcoxon rank sum test with Benjamini-Hochberg correction. E. Mean 42 day Ag-score is shown as described in A. F. UMAP projections show 42 day Ag-scores for LEC subsets as described in B. G. Successive vaccinations enhances retention of previously archived antigen. Ag-score is shown for the 42 day timepoint as described in C. H. 21 day and 42 day Ag-scores are compared for LEC subsets. I. Ag-high module scores described in Figure 2 are shown for LECs that archived antigens from both vaccinations (double-high), from only one vaccination (single-high), have low levels of both antigens, but are predicted to be Ag-competent, or have low levels of both antigens (Ag-low). Module scores are shown for the corresponding LEC subset. P values were calculated using a one-sided Wilcoxon rank sum test with Benjamini-Hochberg correction. J. Ag-low module scores are shown for LEC subsets as described in H.
Figure 4.
Figure 4.
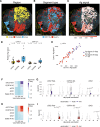
Antigen exchange with DCs correlates with levels of antigen archiving A. Annotated regions used for antigen quantification are shown for a representative lymph node. B. Segment type is shown as described in A. C. Antigen signal is shown as described in A. D. Relative antigen tag signal is shown for each sample and each region segmented based on Lyve1 (LECs) and CD11c (DCs). Normalized 21 day antigen signal was scaled across all regions from 21 day mice and dual immunized mice, 42 day antigen signal was scaled across all regions from 42 day mice and dual immunized mice. The number of plotted segments is shown above each boxplot. E. Normalized antigen tag signal is shown for regions that included both Lyve1+ and CD11c+ segments. 21 day antigen signal is shown for 21 day and dual immunized mice, 42 day signal is shown for 42 day and dual immunized mice. The Spearman correlation coefficient is shown. F. Mean 21 day Ag-score is shown for DCs from mice that received a single vaccination (21 day or 42 day) or dual vaccination (21 day and 42 day). G. Ag-score is shown for single and dual vaccinations for the 21 day timepoint for DC subsets with the highest Ag-scores. Other timepoints are shown in grey. P values were calculated using a one-sided Wilcoxon rank sum test with Benjamini-Hochberg correction. H. Mean 42 day Ag-score is shown as described in F. I. Ag-score is shown for single and dual vaccinations for the 42 day timepoint as described in G.
Figure 5.
Figure 5.
Antigen archiving is impaired during CHIKV infections A. UMAP projections show LEC subsets for mock and CHIKV-infected mice. B. UMAP projections show predicted Ag-competent cLECs for mock and CHIKV-infected mice. C. The fraction of predicted Ag-competent cLECs is shown for mock and CHIKV-infected mice for each biological replicate. P values were calculated using Fisher’s exact test with Benjamini-Hochberg correction. D. UMAP projections show cLEC Ag-high module scores for mock and CHIKV-infected mice. E. cLEC Ag-high module scores are shown for mock and CHIKV-infected mice for each biological replicate. P values were calculated using a two-sided Wilcoxon rank sum test with Benjamini-Hochberg correction. F. Expression of the cLEC Ag-high gene module is shown for mock and CHIKV-infected mice for cLECs from each biological replicate. G. Representative flow cytometry plots showing ova+ LECs H. The percentage and total number of ova+ LECs

Similar articles

References

    1. Kim TS, Hufford MM, Sun J, Fu YX, Braciale TJ. Antigen persistence and the control of local T cell memory by migrant respiratory dendritic cells after acute virus infection. J Exp Med. 2010;207(6):1161–72. doi: jem.20092017 [pii] 10.1084/jem.20092017. - DOI - PMC - PubMed
    1. Kim TS, Sun J, Braciale TJ. T cell responses during influenza infection: getting and keeping control. Trends Immunol. 2011;32(5):225–31. doi: S1471–4906(11)00041-X [pii] 10.1016/j.it.2011.02.006. - DOI - PMC - PubMed
    1. Takamura S, Roberts AD, Jelley-Gibbs DM, Wittmer ST, Kohlmeier JE, Woodland DL. The route of priming influences the ability of respiratory virus-specific memory CD8+ T cells to be activated by residual antigen. J Exp Med. 2010;207(6):1153–60. doi: jem.20090283 [pii] 10.1084/jem.20090283. - DOI - PMC - PubMed
    1. Zammit DJ, Cauley LS, Pham QM, Lefrancois L. Dendritic cells maximize the memory CD8 T cell response to infection. Immunity. 2005;22(5):561–70. doi: S1074–7613(05)00096–8 [pii] 10.1016/j.immuni.2005.03.005. - DOI - PMC - PubMed
    1. Zammit DJ, Turner DL, Klonowski KD, Lefrancois L, Cauley LS. Residual antigen presentation after influenza virus infection affects CD8 T cell activation and migration. Immunity. 2006;24(4):439–49. doi: 10.1016/j.immuni.2006.01.015. - DOI - PMC - PubMed

Publication types