. 2024 Jun 24;52(11):6220-6233.
doi: 10.1093/nar/gkae266.

Growth-regulated co-occupancy of Mediator and Lsm3 at intronic ribosomal protein genes

Affiliations

Growth-regulated co-occupancy of Mediator and Lsm3 at intronic ribosomal protein genes

Wael R Abdel-Fattah et al. Nucleic Acids Res. .

Erratum in

Abstract

Mediator is a well-known transcriptional co-regulator and serves as an adaptor between gene-specific regulatory proteins and RNA polymerase II. Studies on the chromatin-bound form of Mediator revealed interactions with additional protein complexes involved in various transcription-related processes, such as the Lsm2-8 complex that is part of the spliceosomal U6 small nuclear ribonucleoprotein complex. Here, we employ Chromatin Immunoprecipitation sequencing (ChIP-seq) of chromatin associated with the Lsm3 protein and the Med1 or Med15 Mediator subunits. We identify 86 genes co-occupied by both Lsm3 and Mediator, of which 73 were intron-containing ribosomal protein genes. In logarithmically growing cells, Mediator primarily binds to their promoter regions but also shows a second, less pronounced occupancy at their 3'-exons. During the late exponential phase, we observe a near-complete transition of Mediator from these promoters to a position in their 3'-ends, overlapping the Lsm3 binding sites ∼250 bp downstream of their last intron-exon boundaries. Using an unbiased RNA sequencing approach, we show that transition of Mediator from promoters to the last exon of these genes correlates to reduction of both their messenger RNA levels and splicing ratios, indicating that the Mediator and Lsm complexes cooperate to control growth-regulated expression of intron-containing ribosomal protein genes at the levels of transcription and splicing.


Figures

Graphical Abstract
Graphical Abstract
Figure 1.
Figure 1.
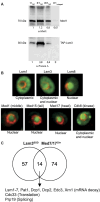
Lsm3 chromatin association and interaction with Mediator. (A) Co-immunoprecipitation of Med1 and Lsm3-TAP from chromatin. Chromatin extract was isolated from a strain expressing Lsm3-TAP and immunoprecipitated using IgA magnetic beads. Beads were washed with buffer A and proteins bound to the beads were eluted using 1× SDS sample buffer. Proteins from input (I, 10 times diluted), eluate (E) and wash (W) were resolved on 4–15% SDS–PAGE, transferred to a PVDF membrane and blotted using α-Protein A (lower part) or α-Med1 (upper part) antibodies followed by incubation in Clean-Blot™ IP (HRP) detection reagent (Thermo Scientific). Quantifications of bands were conducted using the ImageJ software (https://imagej.net/ij/) and normalized to the input (set to 1). (B) Cellular localization of Lsm and Mediator protein subunits. Selected images representing the indicated proteins were retrieved from the YeastRGB open-source initiative (http://www.yeastrgb.org/). The green fluorescence is from each ORF under the control of their native promoters and C-terminally fused to mNeonGreen followed by their endogenous terminator. The red fluorescence is from expressing NUP49 tagged with mCherry to highlight the nuclear membrane. (C) Venn diagrams representing the overlap between the 88 proteins previously shown to interact with Med7 and Med17 in chromatin (5) and 71 Lsm3 physical interactors, identified using the SGD (https://www.yeastgenome.org).
Figure 2.
Figure 2.
ChIP-seq analysis of Lsm3-TAP. (A) Overview of the locations of Lsm3 binding sites (vertical black lines) along the 16 yeast chromosomes. Top scale indicates chromosome size (kb). (B) Gene ontology (GO) analysis for the 116 Lsm3-occupied genes. Molecular functions with adjusted P-value ≤0.05 were extracted. Numbers to the right of circles indicate the number of Lsm3-occupied genes in each molecular function annotation. (C) Bar plot comparing the number of genes (top of each bar) of the four different classes of genes bound by Lsm3. IC, intron-containing genes; nonIC, genes that lack introns; RP, genes encoding ribosomal proteins; nonRP, genes encoding proteins other than ribosomal proteins. (D) Occupancy profiles (top) and heatmaps (bottom) of Lsm3 ChIP signals relative to the 3′-ends of the 81 IC–RP genes (left) and 17 IC–nonRP genes (right). Numbers on the top of each panel indicate the distance (bp) between the 3′-ends of introns and the peak summits. Replicate experiments are indicated as R1, R2 and R3. (E) IGV images from three independent Lsm3 ChIP-seq replicates compared to two independent replicate controls (untagged) at five representative IC genes. Red marks indicate the position of each gene relative to the chromosome starts and ends.
Figure 3.
Figure 3.
Comparison between Lsm3 and Rna14 binding at the 3′-ends of genes. (A) Global occupancy profile (top graph) and global heatmap (bottom graph) of Rna14-TAP ChIP signal relative to the CDSs (±1 kb). Distance (bp) between CDS end sites and peak summit is indicated on the top of the peak. CDSs (S to E) were scaled to 1 kb. (B) Occupancy profiles (upper graph) and heatmaps (bottom graph) of Lsm3-TAP and Rna14-TAP ChIP signals upstream and downstream of the CDS end sites for the 116 Lsm3-occupied genes. Distances (bp) between CDS end sites and peak summits are indicated on the top of each peak. (C) IGV images showing comparisons between Lsm3 and Rna14 ChIP-seq signals at representative examples of four typical IC–RP genes. (D) A model representing the mapped locations for the LSM decaysome (Lsm3), the U2/5/6 spliceosome (Prp19) and the CF1a 3′-end processing (Rna14) complexes at a model IC–RP gene.
Figure 4.
Figure 4.
Mediator binds 200 bp upstream of transcription start site to 86 (74%) of the 116 Lsm3-occupied genes, of which 73 (85%) are IC–RP genes. (A) The 725 Mediator-bound genes were arranged into four clusters by k-means clustering. The ChIP signals (counts per million per 10-bp bin) of each peak are shown in the clustered heatmaps. Score files of ChIP-seq data from this study (Med1 and Med15) and previous study (5), using TAP-tagged Mediator subunits, were combined to compute matrices for the heatmaps. The numbers of genes in each cluster are indicated as superscript. (B) The profile plots of Mediator binding patterns at the promoter regions of clusters 1–4. Average ChIP-seq signals for each cluster and distances between peak summits and CDS start sites are plotted. (C) GO analysis for genes in each cluster. Molecular functions with adjusted P-value ≤0.05 were extracted. Numbers to the right of circles indicate the number of genes in each molecular function annotation. Colors of circles represent the enrichment ratio of cluster frequency relative to the genome frequency. Sizes of circles represent the adjusted P-values. (D) The upper Venn diagram (top) shows that Mediator (occupying 725 genes) and Lsm3 (occupying 116 genes) co-occupy 86 common genes. The lower Venn diagram shows that 84 of these 86 genes are found in cluster 4. (E) Bar plots showing the number of genes from each gene class (IC/nonIC or RP/nonRP) uniquely bound by Mediator, by both Mediator and Lsm3, or by Lsm3 uniquely. (F) Venn diagram representing the overlap of 73 genes between the 82 RP genes and the 76 IC genes that are co-occupied by Mediator and Lsm3. These 73 IC–RP genes that are co-occupied by Mediator and Lsm3 constitute 81% of all 90 IC–RP genes, 53% of all 138 RP genes and 19% of all IC genes identified in the yeast genome.
Figure 5.
Figure 5.
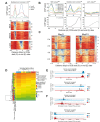
Mediator and Lsm3 show co-occupancy at 3′-exons of IC–RP genes in the late exponential growth phase. (A) Occupancy profiles and heatmaps of Med1, Med15 and Lsm3 ChIP-seq signals of the 73 commonly occupied IC–RP genes. Gene CDSs are scaled to 1 kb. (B) Occupancy profiles of TAP-tagged Mediator subunits (tail: Med3 and Med15; middle: Med19 and Med14; head: Med17; kinase: CycC) relative to the CDSs of the 639 genes uniquely occupied by Mediator (left panel), the 73 commonly occupied IC–RP genes (middle panel) and the 30 genes uniquely occupied by Lsm3 (right panel). Score files for TAP-tagged subunits were extracted from our previous ChIP-seq study (8). Gene CDSs are scaled to 1 kb. (C) Heatmaps of Med1 and Med15 ChIP-seq signals from different growth stages at the 73 commonly occupied IC–RP genes. Gene CDSs are scaled to 1 kb. (D) Heatmap with dendrograms for time points (on top) and genes (left) produced using Euclidean distance and complete linkage from the average of splice ratios at each time point for wild-type cells grown at 30°C. The left bars aligned with the heatmap represent the gene ChIP-binding characteristics, the average count of mapped RNA-seq reads for all time points and the average splice ratio for all time points. The names of the genes, from top to bottom, are listed in Supplementary Table S15 using the same color code as in the figure. (E) Distributions of the average splice ratios at the 0 and 6 h time points for IC genes co-occupied by Lsm3 and Mediator (upper) and IC genes without Lsm3 or Mediator binding (lower). Paired t-test P-values for the 6 h time points compared to the 0 h time points were 7.4e−12 (upper graph) and 0.088 (lower graph). (F) Distributions of the average normalized counts of mapped RNA-seq reads at the 0 and 6 h time points for IC genes co-occupied by Lsm3 and Mediator (upper) and IC genes without Lsm3 or Mediator occupancy (lower). Paired t-test P-values for the 6 h time points compared to the 0 h time points were 8.3e−21 [upper versus lower graph in panel (E)] and 0.95 [upper versus lower graph in panel (F)]. Solid and dashed lines in panels (E) and (F) represents mean and median values, respectively.
Figure 6.
Figure 6.
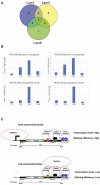
Interaction between Mediator and the Lsm1–7 complex at IC–RP genes. (A) Venn diagram illustrating the interactions between Lsm1, Lsm3 and Lsm8 subunits with Mediator subunits according to the SGD. (B) ChIP-qPCR experiments to assess the occupancy of each Lsm1-, Lsm3- and Lsm8-Flag tagged protein at two genes (RPL19B and RPL23A) that are co-occupied by Lsm3, Med1 and Med15 according to our ChIP-seq results, and at two genes (snR17B and RPL29) that are exclusively occupied by Lsm3 but not Med1 or Med15. The untagged wild-type strain served as the negative control. (C) A schematic model illustrating the interactions between Mediator and the Lsm, spliceosome and CF1a complexes, elucidating their roles in regulating IC–RP gene transcription and splicing in early and late exponential growth phases.

Similar articles

References

    1. Kim Y.-J., Björklund S., Li Y., Sayre M.H., Kornberg R.D. A multiprotein mediator of transcriptional activation and its interaction with the C-terminal repeat domain of RNA polymerase II. Cell. 1994; 77:599–608. - PubMed
    1. Thompson C.M., Koleske A.J., Chao D.M., Young R.A. A multisubunit complex associated with the RNA polymerase II CTD and TATA-binding protein in yeast. Cell. 1993; 73:1361–1375. - PubMed
    1. Yudkovsky N., Ranish J.A., Hahn S. A transcription reinitiation intermediate that is stabilized by activator. Nature. 2000; 408:225–229. - PubMed
    1. Mukundan B., Ansari A. Srb5/Med18-mediated termination of transcription is dependent on gene looping. J. Biol. Chem. 2013; 288:11384–11394. - PMC - PubMed
    1. Chereji R.V., Bharatula V., Elfving N., Blomberg J., Larsson M., Morozov A.V., Broach J.R., Björklund S. Mediator binds to boundaries of chromosomal interaction domains and to proteins involved in DNA looping, RNA metabolism, chromatin remodeling, and actin assembly. Nucleic Acids Res. 2017; 45:8806–8821. - PMC - PubMed

MeSH terms