High temperatures and low humidity promote the occurrence of microsporidians (Microsporidia) in mosquitoes (Culicidae)
- PMID: 38605410
- PMCID: PMC11008030
- DOI: 10.1186/s13071-024-06254-0
High temperatures and low humidity promote the occurrence of microsporidians (Microsporidia) in mosquitoes (Culicidae)
Abstract
Background: In the context of climate change, a growing concern is that vector-pathogen or host-parasite interactions may be correlated with climatic factors, especially increasing temperatures. In the present study, we used a mosquito-microsporidian model to determine the impact of environmental factors such as temperature, humidity, wind and rainfall on the occurrence rates of opportunistic obligate microparasites (Microsporidia) in hosts from a family that includes important disease vectors (Culicidae).
Methods: In our study, 3000 adult mosquitoes collected from the field over 3 years were analysed. Mosquitoes and microsporidia were identified using PCR and sequencing of the hypervariable V5 region of the small subunit ribosomal RNA gene and a shortened fragment of the cytochrome c oxidase subunit I gene, respectively.
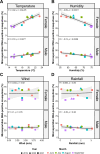
Results: DNA metabarcoding was used to identify nine mosquito species, all of which were hosts of 12 microsporidian species. The prevalence of microsporidian DNA across all mosquito samples was 34.6%. Microsporidian prevalence in mosquitoes was more frequent during warm months (> 19 °C; humidity < 65%), as was the co-occurrence of two or three microsporidian species in a single host individual. During warm months, microsporidian occurrence was noted 1.6-fold more often than during the cold periods. Among the microsporidians found in the mosquitoes, five (representing the genera Enterocytospora, Vairimorpha and Microsporidium) were positively correlated with an increase in temperature, whereas one (Hazardia sp.) was significantly correlated with a decrease in temperature. Threefold more microsporidian co-occurrences were recorded in the warm months than in the cold months.
Conclusions: These results suggest that the susceptibility of mosquitoes to parasite occurrence is primarily determined by environmental conditions, such as, for example, temperatures > 19 °C and humidity not exceeding 62%. Collectively, our data provide a better understanding of the effects of the environment on microsporidian-mosquito interactions.
Keywords: Environmental indicators; Global warming; Metabarcoding; Mosquito vectors; Next-generation sequencing; Parasitic infections.
© 2024. The Author(s).
Conflict of interest statement
The authors declare that they have no competing interests.
Figures


Similar articles
-
Microsporidians (Microsporidia) parasitic on mosquitoes (Culicidae) in central Europe are often multi-host species.J Invertebr Pathol. 2023 Mar;197:107873. doi: 10.1016/j.jip.2022.107873. Epub 2022 Dec 25. J Invertebr Pathol. 2023. PMID: 36577478
-
A new method of metabarcoding Microsporidia and their hosts reveals high levels of microsporidian infections in mosquitoes (Culicidae).Mol Ecol Resour. 2020 Nov;20(6):1486-1504. doi: 10.1111/1755-0998.13205. Epub 2020 Jul 1. Mol Ecol Resour. 2020. PMID: 32516485 Free PMC article.
-
Metabarcoding reveals low prevalence of microsporidian infections in castor bean tick (Ixodes ricinus).Parasit Vectors. 2022 Jan 15;15(1):26. doi: 10.1186/s13071-022-05150-9. Parasit Vectors. 2022. PMID: 35033159 Free PMC article.
-
Review of microsporidia-mosquito relationships: from the simple to the complex.Folia Parasitol (Praha). 2005 May;52(1-2):41-50. Folia Parasitol (Praha). 2005. PMID: 16004363 Review.
-
Microsporidian parasites of mosquitoes.J Am Mosq Control Assoc. 2007;23(2 Suppl):3-29. doi: 10.2987/8756-971X(2007)23[3:MPOM]2.0.CO;2. J Am Mosq Control Assoc. 2007. PMID: 17853594 Review. No abstract available.
References
-
- Becnel JJ, Andreadis TG. Microsporidia in insects. In: Weiss LM, Becnel JJ, editors. Microsporidia. Chichester: John Wiley & Sons; 2014. pp. 521–570.
MeSH terms
Substances
Grants and funding
LinkOut - more resources
Full Text Sources
Medical

