. 2024 May;629(8012):669-678.
doi: 10.1038/s41586-024-07288-1. Epub 2024 Apr 10.

Distal colonocytes targeted by C. rodentium recruit T-cell help for barrier defence

Affiliations

Distal colonocytes targeted by C. rodentium recruit T-cell help for barrier defence

Carlene L Zindl et al. Nature. 2024 May.

Abstract

Interleukin 22 (IL-22) has a non-redundant role in immune defence of the intestinal barrier1-3. T cells, but not innate lymphoid cells, have an indispensable role in sustaining the IL-22 signalling that is required for the protection of colonic crypts against invasion during infection by the enteropathogen Citrobacter rodentium4 (Cr). However, the intestinal epithelial cell (IEC) subsets targeted by T cell-derived IL-22, and how T cell-derived IL-22 sustains activation in IECs, remain undefined. Here we identify a subset of absorptive IECs in the mid-distal colon that are specifically targeted by Cr and are differentially responsive to IL-22 signalling. Major histocompatibility complex class II (MHCII) expression by these colonocytes was required to elicit sustained IL-22 signalling from Cr-specific T cells, which was required to restrain Cr invasion. Our findings explain the basis for the regionalization of the host response to Cr and demonstrate that epithelial cells must elicit MHCII-dependent help from IL-22-producing T cells to orchestrate immune protection in the intestine.


Conflict of interest statement

The authors declare no competing interests.

Figures

Fig. 1
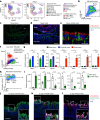
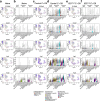
Fig. 1. A distinct subset of colonocytes undergoes accelerated maturation in response to Cr.
scRNA-seq was performed on epithelial cells from mid–distal colons of C57BL/6 mice without infection (naive) and on day 9 of Cr infection. a, Dot plot of differentially expressed genes in naive mice. Prog, progenitor; TA, transit-amplifying cell. b, Heat map of the top 50 differentially expressed genes between mature DCCs and PCCs from naive mice. c, Gene set enrichment analysis of Gene Ontology Biological Process pathways, comparing mature DCCs and PCCs from naive mice. ER, endoplasmic reticulum; NT, nuclear-transcribed. d, Uniform manifold approximation and projection (UMAP) analysis of integrated biological replicates identified eight unique clusters for absorptive IECs—including two major developmental arms (DCC and PCC), five clusters for secretory IECs and three clusters for undifferentiated IECs. Abs, absorptive; CC, colonocyte; DCS, deep crypt secretory cell; Sec, secretory, EEC, enteroendocrine cell. e, Pie charts of percentages of cells within each IEC subset. Numbers in parentheses show the percentages of absorptive (top row), secretory (middle row) and undifferentiated (bottom row) cells in each pool. Two mice pooled per sample, n = 2 biological replicates per group.
Fig. 2
Fig. 2. Cr predominantly attaches to DCCs.
scRNA-seq was performed on epithelial cells from mid–distal colons of C57BL/6 mice without infection (naive) and on day 9 of Cr infection. (n = 2). a, UMAP analysis of Ly6g and Fabp2 expression. b, IECs from mid–distal colons of naive mice were stained for LY6G, FABP2, EPCAM1, CD45 and LIVE/DEAD (L/D) dye, and analysed by flow cytometry. n = 3 mice and n = 2 independent experiments. ce, Tissue from distal ileum (c; scale bar, 1,000 μm), colon (d; scale bar, 1,000 μm) and middle colon region (e; scale bar, 50 μm) from naive mice were stained with LY6G and FABP2 antibodies and DAPI (3–4 mice per region, n = 2 independent experiments). f,g, IECs from distal ileum (green), proximal colon (blue) and distal colon (red) of naive mice were stained as in b and analysed by flow cytometry (f) or sorted as EPCAM1+CD45L/D IECs, and mRNA expression was analysed by PCR with reverse transcription (RT–PCR) (g) (2 or 3 mice pooled per sample; n = 2 independent experiments). One-way ANOVA. h, Mid–distal colon IECs mice on day 8 of Cr-GFP infection were sorted for EPCAM1+CD45GFP or EPCAM1+CD45Cr-GFP+ cells. i, mRNA expression of indicated genes in sorted Cr-GFP and Cr-GFP+ IECs was analysed by RT–PCR (2 or 3 mice pooled per sample; n = 2 independent experiments). Two-tailed unpaired t-test. jl, Proximal (j), middle (k) and distal (l) colon tissue from mice on day 8 of Cr infection was stained for LY6G, FABP2, Cr-LPS and DAPI. White arrows identify rare Cr in proximal colon, green arrows identify FABP2+ PCCs, and red arrows identify Cr-laden LY6G+ DCCs. Scale bar, 100 μm. 3 or 4 mice per experiment; n = 2 independent experiments. Data are mean ± s.e.m. *P ≤ 0.05, **P ≤ 0.01 and ***P ≤ 0.001.
Fig. 3
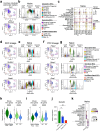
Fig. 3. IL-22+ T cells accelerate removal of Cr-laden mature DCCs.
scRNA-seq was performed on epithelial cells from mid–distal colons of C57BL/6 mice without infection (naive) and on day 9 of Cr infection of Il22hCD4 (control) and Il22∆Tcell conditional knockout (cKO) mice (n = 2). a,b, Heat map of top 50 differentially expressed genes in mature DCCs (a) and mature PCCs (b), comparing naive and infected mice. c, Dot plot of IL-22–inducible genes from naive and infected mice. d, UMAP analysis of integrated biological replicates from day 9 of Cr infection of control and Il22∆Tcell cKO mice. e, Pie charts show the percentage of cells within each IEC subset. Numbers in parentheses show percentages of absorptive (top row), secretory (middle row) and undifferentiated (bottom row) cells in each pool. f, scRNA-seq velocity plots highlight transcriptional relationships between major IEC subsets. Arrowheads denote directionality and lines represent kinetics of differentiation. g, IECs from colons on day 9 of Cr-GFP infection of Il22hCD4 and Il22∆Tcell mice were stained for LY6G, CD45, L/D dye and EPCAM1 and analysed by flow cytometry. h, Number of Cr-GFPLY6G+ IECs and Cr-GFP+LY6G+ IECs from Il22hCD4 (white) and Il22∆Tcell (grey) mice on day 9 of infection with Cr-GFP. Two-tailed unpaired t-test; 3 or 4 mice per group; n = 2 independent experiments. Data are mean ± s.e.m. *P ≤ 0.05.
Fig. 4
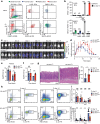
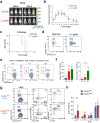
Fig. 4. Epithelial MHCII is required to limit bacterial overgrowth and intestinal pathology.
a, IECs from distal ileum (green), and proximal (blue), middle (grey) and distal (red) colon of C57BL/6 mice without infection (naive) and on day 14 of Cr infection were stained for EPCAM1, CD45, LY6G, FABP2 and MHCII and L/D dye, and analysed by flow cytometry. SI, small intestine. b, Percentage of MHCII+LY6G+ DCCs and MHCII+ FABP2+ IECs from C57BL/6 mice without infection (naive) and on day 14 of Cr infection. Three mice pooled per region; n = 2 independent experiments. Two-way ANOVA. Asterisks indicate P values for naive versus infected mice. ###P ≤ 0.001 (comparing colonic regions). Mid, middle; NP, not present; Prox, proximal. c,d, Serial whole-body imaging (c) and colonization kinetics (d) of Cr-infected H2-Ab1fl/fl (blue) and H2-Ab1Villin (red) mice. Five mice per group; n = 2 independent experiments. e,f, Number of colony-forming units (CFU) from faeces (e) and liver (f) of day 9 and day 14 Cr-GFP H2-Ab1fl/fl and H2-Ab1Villin mice (4 or 5 mice per group, n = 2 independent experiments). g, Colons on day 14 of Cr infection of H2-Ab1fl/fl and H2-Ab1Villin mice, stained with haematoxylin and eosin. Scale bar, 100 μm. h, Colon cells from day 9 and day 14 Cr H2-Ab1fl/fl and H2-Ab1Villin mice were stimulated with phorbol 12-myristate 13-acetate (PMA) and ionomycin and stained for surface CD4, TCRβ, CD44 and L/D dye, then stained for intracellular IL-17, IL-22 and IFNγ and analysed by flow cytometry. i, Number of colonic IL-22+, IL-17A+, IL-17A+IFNγ+ and IFNγ+ T cells from day 9 and day 14 Cr H2-Ab1fl/fl and H2-Ab1Villin mice. Two-tailed unpaired t-test comparing H2-Ab1fl/fl and H2-Ab1Villin mice (dg,i); 3 or 4 mice per group; n = 2 independent experiments. Data are mean ± s.e.m. NS, not significant.
Fig. 5
Fig. 5. Epithelial MHCII is required for mucosal retention of Cr-specific TH cells, prolonged colonocyte STAT3 activation and crypt protection.
a, Design of the Cr-espZ-gp66-HA (Cr-gp66) construct. b, Schematic of Cr–host IEC interaction, highlighting injection of the Cr effector proteins Tir (targeted to IEC apical membrane) and EspZ (gp66–HA-tagged and associated with Tir cytosolic domain). c, Distal colon EPCAM1+LY6G+L/DCD45 cells from Cr-gp66 or Cr (DBS100) infected mice (day 8 of infection) were sorted and stained for HA and LPS and with DAPI. Scale bar, 20 μm. 2 or 3 mice per group; n = 2 experiments. d, CD45.1+ SMARTA T cells were transferred into CD45.2+ C57BL/6 recipients infected with Cr DBS100 (black) or Cr-gp66 (green). Colonic lamina propria (LP), pooled caudal-iliac lymph node (ciLN), distal mesenteric lymph node (dmLN) and spleen cells (day 14) were stained for CD45.1, CD45.2, CD4 and TCRβ and with L/D dye and analysed by flow cytometry. e, Number of CD45.1+ CD4 T cells from adoptively transferred mice on day 14 of infection with either Cr (DBS100; white) or Cr-gp66 (green) (3–5 mice per group; n = 2 experiments). f, SMARTA CD45.1+ and wild-type CD45.2+ CD4 T cells (1:1 ratio) transferred into H2-Ab1fl/fl Tcra–/– (blue) or H2-Ab1VillinTcra–/– (red) recipients infected with Cr-gp66. Colonic lamina propria cells from day 14 Cr-gp66 were stimulated with PMA and ionomycin, stained for surface markers as in d, then stained for intracellular IL-17A, IL-22 and IFNγ, and analysed by flow cytometry. g, Number of colonic IL-22+, IL-17A+, IL-17A+IFNγ+ and IFNγ+CD45.1+ CD4 T cells from day 14 Cr-gp66-infected mice (4–7 mice per group, n = 3 experiments). h,i, Colons from H2-Ab1fl/fl and H2-Ab1Villin mice on day 14 of infection with Cr-GFP were stained for pSTAT3, EPCAM1 and DAPI (h) or for Cr-GFP, EPCAM1 and DAPI (i) (3–5 mice per group; n = 2 experiments). Scale bars, 50 μm. Data are mean ± s.e.m. e,g, Two-tailed unpaired t-test. *P ≤ 0.05, **P ≤ 0.01 and ***P ≤ 0.001.
Extended Data Fig. 1
Extended Data Fig. 1. Characterization of colonocytes from naïve BL/6 mice.
scRNA-seq was performed on epithelial cells from mid-distal colon of naïve BL/6 mice (n = 2). a, UMAPs and b, Violin plots of common colonocyte markers. One-way ANOVA; ****p≤0.0001 comparing absorptive IECs to undifferentiated or secretory IECs. c, Dot plot of glycoproteins expressed by IECs from naïve mice. d, UMAPs and e, Violin plots of DCC lineage markers. f, UMAPs and g, Violin plots of PCC lineage markers. One-way ANOVA; ****p≤0.0001 comparing gene expression in different cell clusters. See Supplementary Tables 3 and 4 for additional statistical analyses. h-i, Violin plots of manually curated genes expressed by (h) mouse mature PCCs (dark green) and human ascending colonic IECs (AC; light green) or (i) mouse Mature DCCs (dark blue) and human sigmoid colonic IECs (SC; light blue). Wilcoxon rank sum test; ****p≤0.0001. See Supplementary Table 1 for genes shared by mouse and human IECs. j, IECs from distal ileum (green), proximal colon (blue) and distal colon (red) of naïve BL/6 mice were sorted on EpCAM1+CD45L/D dye IECs and Gucy2c mRNA expression analyzed by RT-PCR. One-way ANOVA; *p≤0.05 and **p≤0.01. k, Dot plot of Slc26a3 and Cftr expression in IEC subsets from naïve BL/6 mice. 2 mice pooled per sample, n = 2 biological replicates per group. IEC=intestinal epithelial cell; PCC=proximal colonocyte; DCC=distal colonocyte; DCS=deep crypt secretory cell; TA=transit-amplifying cell; CBC=crypt base columnar cell; Undiff=undifferentiated cell; CFTR, cystic fibrosis transmembrane regulator. Note that Car4 (carbonic anhydrase 4) and Slc26a3 (chloride/bicarbonate transporter) are expressed by both PCC and DCC lineage colonocytes but not CBC cells, progenitor cells, or secretory IECs. In contrast, the chloride channel, CFTR is predominantly expressed by undifferentiated IECs and early colonocyte progenitors. Top genes expressed by naïve mature DCCs include Ly6g, Slc20a1, and Dmbt1. The top genes expressed by naïve pre- and mature PCCs include Fabp2, Dpep1, and Emp1. Although the top genes found in mouse mature PCCs and mature DCCs are not expressed by human ascending and sigmoid colonocytes, respectively, there are several genes that are shared between mouse and human colonocytes and differentially expressed in the two sides of the colon (see Supplementary Table 1). Moreover, Gucy2c, a transmembrane receptor important for regulating intestinal fluid secretion and a receptor for heat-stable enterotoxins from pathogenic E.coli, is highly expressed in the ileum compared to the colon, suggesting that E. coli may utilize Gucy2c to efficiently target human ileal enterocytes as opposed to distal colonocytes. Interestingly, PCC and DCC lineage colonocytes express different glycoproteins which may dictate differences in cellular communication and interaction with specific molecules or neighboring cells.
Extended Data Fig. 2
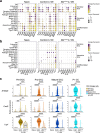
Extended Data Fig. 2. C.r infection causes enhanced IEC proliferation in the crypts.
a, Colon tissue was collected at various times after d9 C.r-infected BL/6 mice were treated with BrdU and stained for BrdU (red), EpCAM1 (green) and DAPI (blue). Scale bar, 50 μm. b, Percent migration of BrdU+ IECs from the crypt base to the luminal surface per total length of the crypt. 4 mice per time point per group, 20–30 crypts per group, n = 1. One-way ANOVA; ***p≤0.001. Data are represented as mean ± SEM. c, Dot plots of top markers for all populations from scRNA-seq analysis of IECs from naïve and d9 C.r. 2 mice pooled per sample, n = 2 biological replicates per group. IEC=intestinal epithelial cell; PCC=proximal colonocyte; DCC=distal colonocyte; DCS=deep crypt secretory cell; TA=transit-amplifying cell; CBC=crypt base columnar cell.
Extended Data Fig. 3
Extended Data Fig. 3. DCC lineage cells expand in response to C.r infection and respond to microbes and localized T cells.
scRNA-seq was performed on epithelial cells from mid-distal colon of naïve BL/6 mice. a, Heatmap of top genes from combined naïve and infected BL/6 mice defining each major IEC subset. b, scVelocity plots show transcriptional relationships between the major IEC subsets. Arrowheads denote directionality and lines represent kinetics of differentiation. 2 mice pooled per sample, n = 2 biological replicates per group. Wilcoxon rank sum test, p-val<0.05 was used for differential gene expression analyses. See Supplementary Table 2 for top expressed genes per cluster. c-e, IECs from proximal colon (blue) and distal colon (red) of naïve BL/6 (white), GF (color) and Rag1–/– (grey) mice were stained for Ly6G, Fabp2, EpCAM1, CD45 and L/D dye, and analyzed by flow cytometry (c) and enumerated per cm of tissue (d) or sorted on EpCAM1+CD45L/D dye IECs and mRNA expression analyzed by RT-PCR (e). 3-4 mice per group; n = 2 independent experiments. Two-way ANOVA; *p≤0.05, **p≤0.01 and ***p≤0.001. IEC=intestinal epithelial cell; PCC=proximal colonocyte; DCC=distal colonocyte; DCS=deep crypt secretory cell; TA=transit-amplifying cell; CBC=crypt base columnar cell; Abs= absorptive; Sec=secretory; Undiff=undifferentiated; Prog=progenitor; ns=not significant.
Extended Data Fig. 4
Extended Data Fig. 4. IL-22–inducible genes are differentially upregulated in different regions of the intestines.
a-b, Mid-distal colon IECs from d8 C.r-GFP-infected mice were stained for EpCAM1, Ly6G, and CD45 and either a) analyzed by flow cytometry or b) sorted on EpCAM1+ (red) C.r-GFP+ (green) cells, cytospun, and stained with DAPI (blue). Scale bar = 10 μm. 3 mice per group and n = 2 independent experiments. c, scRNA-seq was performed on epithelial cells from mid-distal colon of naïve BL/6 mice (n = 2). Violin plots of Il22ra1 and Il10rb genes. Dots denote gene expression per individual cell. d, IECs from naïve (open symbol) and d8 C.r mice (closed symbol) were sorted from distal ileum (green), proximal colon (blue) and distal colon (red) and mRNA expression was analyzed by RT-PCR. One-way ANOVA with Tukey’s multiple comparison test; *p≤0.05, and ***p≤0.001 comparing naïve and infected mice; and øøøp≤0.001 comparing infected samples from different tissue regions; and ##p≤0.01, and ###p≤0.001 comparing naïve samples from different tissue regions. 2-3 mice pooled per sample; n = 2 independent experiments. Data are represented as mean ± SEM. IEC=intestinal epithelial cell; PCC=proximal colonocyte; DCC=distal colonocyte; DCS=deep crypt secretory cell; TA=transit-amplifying cell; CBC=crypt base columnar cell. The components of the IL-22R (IL-22Ra1 and IL-10Rβ) were found to be highly expressed by mature colonocytes, with no significant difference in IL-22R expression between mature PCCs and mature DCCs. S100a8/9 antimicrobial peptide, and the Cxcl2 and Cxcl5 chemokines are highly expressed by mature colonocytes of the DCC lineage and are heightened in the presence of IL-22–producing CD4 T cells suggesting they may play important roles in bacterial clearance during the late phase of C.r infection.
Extended Data Fig. 5
Extended Data Fig. 5. CD4 T cells upregulate IL-22–inducible genes on DCC lineage cells and goblet cells for host defense.
scRNA-seq was performed on epithelial cells from mid-distal colon of naïve BL/6, and d9 C.r Il22hCD4 (Control) and Il22∆Tcell cKO mice. 2-3 mice pooled per sample; n = 2 independent experiments. a-b, Dot plots of fucosyl transferases and mucins (a) and IL-22–inducible genes (b) from naïve, and d9 C.r Il22hCD4 and Il22∆Tcell mice. c, Violin plots of S100a8, Cxcl5 and Lrg1 expression in pre-DCC (beige), pro-DCC (orange), mature DCC (royal blue) and pathogen-induced (P-I) CC from naïve, and C.r d9 Il22fl/fl and Il22∆Tcell mice. Bars represent mean gene expression and dots denote gene expression per individual cell. One-way ANOVA; *p≤0.0332, **p≤0.0021, ***p≤0.0002 and ****p≤0.0001 comparing naïve, and d9 C.r Control and Il22∆Tcell. ns=not significant. DCS=deep crypt secretory cell; TA=transit-amplifying cell; CBC=crypt base columnar cell. As expected in naïve mice, goblet cells predominantly express Muc2 and Muc4; whereas colonocytes express Muc3 and Muc13. Fut2 gene which encodes for the fucosyl transferase 2 enzyme is upregulated on both goblet cells and colonocytes; whereas Muc1, a membrane-bound mucin is predominantly upregulated on stem cells and colonocytes of the DCC lineage during C.r infection. S100a8, Cxcl5 and Lrg1 are significantly upregulated on multiple DCC lineage subsets in response to T cell-derived IL-22.
Extended Data Fig. 6
Extended Data Fig. 6. CD4 T cells upregulate IL-22–inducible genes on multiple colonic IEC subsets.
scRNA-seq was performed on epithelial cells from mid-distal colon of naïve BL/6, and d9 C.r Il22hCD4 (Control) and Il22∆Tcell cKO mice (n = 2). a, UMAPs and b, Violin plots from naïve BL/6 mice. c, UMAPs and d, Violin plots from C.r d9 Control mice. e, UMAPs and f, Violin plots from C.r d9 Il22∆Tcell mice. See Supplementary Tables 5–7 for statistical analyses. Bars represent mean gene expression and dots denote gene expression per individual cell. S100a family of AMPs and neutrophil-recruiting chemokines (e.g., Cxcl2 and Cxcl5) are predominantly upregulated on IECs of the mature DCC lineage in infected control mice and expression of these genes is severely blunted in the absence of IL-22–producing T cells. Lrg1, a leucine-rich α-2-glycoprotein that plays a role in cell migration and wound healing is upregulated on all IECs during C.r infection. IL-22–producing T cells augment Lrg1 expression on most IECs with the greatest expression observed on pre-DCCs and pro-DCCs suggesting that T cell-driven upregulation of Lrg1 may contribute to the expansion of distal colonocytes and ultimate restitution of the damaged epithelium during C.r infection. Fut2, another known IL-22–regulated gene is upregulated on goblet cells and colonocytes of the DCC lineage in response to IL-22+ T cells on d9 of C.r infection.
Extended Data Fig. 7
Extended Data Fig. 7. IEC-derived MHCII augments local T cell-driven protection of the colon during the late phase of C.r infection.
Notably, we found that >20% of progeny from crosses of H2-Ab1fl/fl x Villin-cre mice were either heterozygous or homozygous complete knockouts for H2-Ab1 (a-c), presumably due to spontaneous recombination of the targeted allele. All mice with spontaneous global deficiency of H2-Ab1 completely succumbed to C.r infection before d20, consistent with their inability to recruit adaptive immunity (d). However, properly targeted H2-Ab1Villin mice that survived C.r infection had equivalent diversity of colonic commensals and displayed normal MHCII expression on PBMCs (e-f). a, Peripheral blood cells were isolated from naïve H2-Ab1fl/fl and H2-Ab1Villin littermates, stained for B220, MHCII and L/D dye and analyzed by flow cytometry to exclude mice with germline deletion of MHCII. b, Percent MHCII+ B220+ PBMCs from naïve H2-Ab1fl/fl (blue), H2-Ab1fl/– (green) and H2-Ab1–/– (red) mice. c, Dot plot of the genotype frequencies of 100 offspring from H2-Ab1fl/fl matings. n=at least 12 mice per group pooled from multiple litters. One-way ANOVA; ****p≤0.0001. d, Survival kinetics of C.r-infected control H2-Ab1fl/fl (blue), H2-Ab1fl/– (green) and H2-Ab1–/– (red) mice. 5-6 mice per group, n = 2 independent experiments e, Fecal samples were collected from H2-Ab1fl/fl and H2-Ab1Villin littermates for 16 S rRNA-seq. f, PCA plots of individual samples used for 16 S rRNA-seq. 5–8 mice per group, n = 1 experiment g, Colon and cecum tissue and feces from d14 C.r-GFP H2-Ab1fl/fl (blue) and H2-Ab1Villin (red) mice was analyzed for C.r colony forming units (cfu) per gram of tissue or feces. 5 mice per group, n = 1 experiment. Two-tailed unpaired t-test; **p≤0.01 and ***p≤0.001. h, C.r-infected H2-Ab1fl/fl and H2-Ab1Villin-ERT2 mice were administered tamoxifen on d5-d12 and IECs were isolated on d14 for flow cytometry to enumerate MHCII+ EpCAM1+ IECs. i, Percent MHCII+ EpCAM1+ IECs from d14 C.r H2-Ab1fl/fl (blue) and H2-Ab1Villin-ERT2 (red) mice. 4 mice per group, n = 1 experiment. Two-tailed unpaired t-test; ***p≤0.001. j, Serial whole-body imaging and k, colonization kinetics of C.r-infected H2-Ab1fl/fl (blue) and H2-Ab1Villin-ERT2 (red) mice that received tamoxifen on d5-d12. 5 mice per group, n = 2 independent experiments. Two-tailed unpaired t-test; *p≤0.0332, **p≤0.0021, ***p≤0.0002 and ***p≤0.0001 comparing H2-Ab1fl/fl and H2-Ab1Villin-ERT2 mice. Data are represented as mean ± SEM. ns=not significant. PBMC=peripheral blood mononuclear cells.
Extended Data Fig. 8
Extended Data Fig. 8. Characterization of antigen-specific T cell responses during C.r infection.
a, Serial whole-body imaging and b, colonization kinetics of BL/6 mice infected with C.r (DBS100; blue) or C.r gp66 (red). 3–5 mice per group, n = 2 independent experiments. c, Survival kinetics of susceptible C3H/HeJ mice infected with either DBS100 (blue) or C.r gp66 (red). 5 mice per group, n = 1 experiment. d, Colon cells from Tcra–/– mice infected with either C.r (DBS100) or C.r gp66 and adoptively transferred with CD45.1+ SMARTA CD4 T cells were stained for surface CD4, TCRβ, L/D dye, CD45.1 and CD45.2 and analyzed by flow cytometry. 4–6 mice per group, n = 1 experiment. e, Colon cells from Tcra–/– mice infected with C.r-gp66 and adoptively transferred with different ratios of CD45.1+ CD4 T cells to CD45.2+ polyclonal CD4 T cells (1:9; blue, 1:1; red, 9:1; green) were stained for surface markers same as (d) and analyzed by flow cytometry. 3–5 mice per group, n = 2 independent experiments. f, Number and percent of CD45.1+ SMARTA CD4 T cells recovered after C.r-gp66 infection of mice receiving either 1:9 (blue), 1:1 (red) or 9:1 (green) ratio of CD45.1+ SMARTA to CD45.2+ polyclonal CD4 T cells. 3–5 mice per group, n = 2 independent experiments. One-way ANOVA; *p≤0.02. g, ciLN cells from d14 C.r H2-Ab1fl/fl.Tcra–/– (blue) and H2-Ab1Villin.Tcra–/– (red) mice adoptively transferred with CD45.1+ SMARTA and CD45.2+ polyclonal CD4 T cells (1:1) were stimulated for 4hrs with PMA/Ion and GolgiPlug, stained for surface markers same as (d), and then stained for intracellular IL-17, IL-22 and IFNγ and analyzed by flow cytometry. h, Frequency of ciLN IL-22+, IL-17A+, IL-17A+IFNγ+ and IFNγ+ T cells from d14 C.r H2-Ab1fl/fl.Tcra–/– (blue) and H2-Ab1Villin.Tcra–/– (red) mice transferred with CD45.1+ SMARTA cells and CD45.2+ polyclonal CD4 T cells (1:1). Two-way ANOVA; *p≤0.03. 4–6 mice per group, n = 2 independent experiments. Data are represented as mean ± SEM. ns=not significant. ciLN=pooled caudal and iliac lymph nodes.

Similar articles

Cited by

References

    1. Zheng Y, et al. Interleukin-22 mediates early host defense against attaching and effacing bacterial pathogens. Nat. Med. 2008;14:282–289. doi: 10.1038/nm1720. - DOI - PubMed
    1. Sonnenberg GF, Monticelli LA, Elloso MM, Fouser LA, Artis D. CD4+ lymphoid tissue-inducer cells promote innate immunity in the gut. Immunity. 2011;34:122–134. doi: 10.1016/j.immuni.2010.12.009. - DOI - PMC - PubMed
    1. Basu R, et al. Th22 cells are an important source of IL-22 for host protection against enteropathogenic bacteria. Immunity. 2012;37:1061–1075. doi: 10.1016/j.immuni.2012.08.024. - DOI - PMC - PubMed
    1. Zindl CL, et al. A nonredundant role for T cell-derived interleukin 22 in antibacterial defense of colonic crypts. Immunity. 2022;55:494–511. doi: 10.1016/j.immuni.2022.02.003. - DOI - PMC - PubMed
    1. Mangan PR, et al. Transforming growth factor-β induces development of the TH17 lineage. Nature. 2006;441:231–234. doi: 10.1038/nature04754. - DOI - PubMed

MeSH terms

Substances