. 2024 May 15;44(20):e1256232024.
doi: 10.1523/JNEUROSCI.1256-23.2024.

Impairment of the Glial Phagolysosomal System Drives Prion-Like Propagation in a Drosophila Model of Huntington's Disease

Affiliations

Impairment of the Glial Phagolysosomal System Drives Prion-Like Propagation in a Drosophila Model of Huntington's Disease

Graham H Davis et al. J Neurosci. .

Abstract

Protein misfolding, aggregation, and spread through the brain are primary drivers of neurodegenerative disease pathogenesis. Phagocytic glia are responsible for regulating the load of pathological proteins in the brain, but emerging evidence suggests that glia may also act as vectors for aggregate spread. Accumulation of protein aggregates could compromise the ability of glia to eliminate toxic materials from the brain by disrupting efficient degradation in the phagolysosomal system. A better understanding of phagocytic glial cell deficiencies in the disease state could help to identify novel therapeutic targets for multiple neurological disorders. Here, we report that mutant huntingtin (mHTT) aggregates impair glial responsiveness to injury and capacity to degrade neuronal debris in male and female adult Drosophila expressing the gene that causes Huntington's disease (HD). mHTT aggregate formation in neurons impairs engulfment and clearance of injured axons and causes accumulation of phagolysosomes in glia. Neuronal mHTT expression induces upregulation of key innate immunity and phagocytic genes, some of which were found to regulate mHTT aggregate burden in the brain. A forward genetic screen revealed Rab10 as a novel component of Draper-dependent phagocytosis that regulates mHTT aggregate transmission from neurons to glia. These data suggest that glial phagocytic defects enable engulfed mHTT aggregates to evade lysosomal degradation and acquire prion-like characteristics. Together, our findings uncover new mechanisms that enhance our understanding of the beneficial and harmful effects of phagocytic glia in HD and other neurodegenerative diseases.

Keywords: Rab; aggregate; glia; huntingtin; phagocytosis; prion-like.


Conflict of interest statement

The authors declare no competing financial interests.

Figures

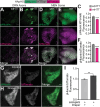
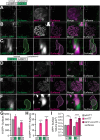
Figure 1.
Figure 1.
mHTTex1 expression in ORNs impairs clearance of injured axons. A,B, Maximum intensity projections of mCD8-GFP-labeled DA1 ORN axons expressing (A) HTTex1Q25- (wtHTTex1) or (B) HTTex1Q91-mCherry (mHTTex1) in 7-day-old uninjured flies (left) or 14-day-old flies subjected to bilateral antennal nerve axotomy 7 d earlier (right). Scale bars = 5 μm. C,D, Quantification of (C) mCD8-GFP+ and (D) HTTex1-mCherry+ DA1 ORN axons remaining in 7-, 14-, and 28-day-old uninjured flies or flies at 1, 3, and 5 d postinjury. E, Quantification of mCD8-GFP+ DA1 ORN axons in 7-, 14-, and 28-day-old flies expressing HTTex1Q25- or HTTex1Q91-mCherry in DA1 ORNs. All quantified data were normalized to uninjured 1-day-old adults and graphed as mean ± SEM; *p < 0.05, **p < 0.01, ***p < 0.001, ****p < 0.0001 by unpaired two-tailed t test.
Figure 2.
Figure 2.
mHTTex1 expression in glia is associated with reduced ORN axon clearance postinjury. A,B, Maximum intensity projections of antennal lobes from 5- to 6-day-old flies expressing HTTex1Q25- (top) or HTTex1Q91-V5 (bottom) in glia and immunostained with anti-V5. Scale bars = 10 μm. B,C, Maximum intensity projections of mCD8-GFP-labeled DA1 ORN axons in 1-day-old flies expressing (B) HTTex1Q25- or (C) HTTex1Q91-V5 in repo+ glia. Scale bars = 5 μm. D, Quantification of mCD8-GFP+ DA1 ORN axons in flies expressing HTTex1Q25- or HTTex1Q91-V5 in repo+ glia, either uninjured or at 1 and 3 d postinjury. E, Quantification of mCD8-GFP+ DA1 ORN axons in 1-day-old flies expressing HTTex1Q25- or HTTex1Q91-mCherry in repo+ glia. All data were normalized to uninjured 1-day-old adult flies and graphed as mean ± SEM; ***p < 0.001 by unpaired two-tailed t test.
Figure 3.
Figure 3.
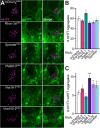
mHTTex1 expression inhibits engulfment of injured ORN axons. A,B, Maximum intensity projections of VA1lm ORN axons coexpressing the ratiometric phagocytic indicator, MApHS, and (A) HTTex1Q25- or (B) HTTex1Q91-V5 from 7-day-old uninjured flies (left) and flies 25 h postinjury (right). Scale bars = 10 μm. C, pHluorin:tdTomato fluorescence intensity ratios calculated in VA1lm glomeruli from 7-day-old uninjured flies and flies at 14 or 25 h postinjury. Data were normalized to the uninjured condition for each genotype. D, pHluorin:tdTomato fluorescence intensity ratios in 7-day-old flies coexpressing MApHS with HTTex1Q25- or HTTex1Q91-V5 in VA1lm ORNs, normalized to wtHTTex1 controls. Data are shown as mean ± SEM; **p < 0.01, ***p < 0.001, ****p < 0.0001 by unpaired two-tailed t test. E,F, Maximum intensity projections of the central brain from 6 to 7-day-old flies expressing (E) repo-Cas9 or (F) repo-Cas9 plus gRNAs targeting draper (“Draper KO”). Brains were immunostained with anti-Draper. Scale bars = 10 μm. G, Quantification of Draper immunofluorescence in brains from flies shown in (E,F), normalized to control.
Figure 4.
Figure 4.
Neuronal mHTTex1 accumulates in acidic cellular compartments. A,B,D,E, Maximum intensity projections of (A,B) Or83b+ ORN axons or (D,E) OK107+ MBN soma expressing (A,D) HTTex1Q25- or (B,E) HTTex1Q91-associated pH sensor (HApHS) from 13- to 14-day-old flies. Scale bars = 10 μm. C,F, pHluorin:tdTomato fluorescence intensity ratios of data shown in (A,B,D,E), normalized to wtHTTex1 controls. G,H, Maximum intensity projections of VA1lm ORN axons coexpressing mHApHS and (G) repo-Cas9 or (H) repo-Cas9 and gRNAs targeting draper. Scale bars = 5 μm. I, pHluorin:tdTomato fluorescence intensity ratios calculated in VA1lm glomeruli from 9- to 10-day-old flies as shown in (G,H). Data were normalized to flies not expressing gRNAs. All quantified data are shown as mean ± SEM; **p < 0.01, ***p < 0.001, ****p < 0.0001 by unpaired two-tailed t test.
Figure 5.
Figure 5.
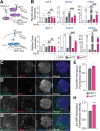
mHTTex1 expression in ORNs upregulates phagocytic and innate immunity genes and impairs injury-induced transcriptional responses. A, Diagrams of Toll-6 (purple) and Draper (blue) signaling pathways. B, qPCR analysis of the indicated genes in 8- to 11-day-old flies expressing GFP, HTTex1Q25-, or HTTex1Q91-GFP in Or83b+ ORNs. RNA was isolated from heads of uninjured flies or flies 3 h after bilateral antennal and maxillary palp nerve injury. Data are shown as mean ± SEM and normalized to the housekeeping gene rpl32. *p < 0.05, **p < 0.01, ***p < 0.001 by one-way ANOVA; asterisks and hashtags indicate statistical significance comparing ± injury or genotypes, respectively. C,D,F,G, Maximum intensity projections of Or83b+ ORN axons from 14- to 15-day-old flies expressing (C,F) HTTex1Q25- or (D,G) HTTex1Q91-V5 in (C,D) Toll-6MIMICGFP (Toll-6-GFP) or (F,G) Jra-GFP genetic backgrounds. Brains were immunostained with GFP, V5, and N-Cadherin (C,D) or GFP, Repo, and N-Cadherin (F,G) antibodies. In panel (C), diffuse wtHTTex1 signal was adjusted postacquisition for increased visibility. Scale bars = 10 μm. E,H, Quantification of (E) Toll-6-GFP or (H) Jra-GFP expression from flies show in (C,D,F,G). Data are graphed as mean ± SEM; *p < 0.05, ****p < 0.0001 by unpaired two-tailed t test.
Figure 6.
Figure 6.
mHTTex1 expression in ORNs upregulates and impairs injury-induced upregulation of some AMP genes. AE, qPCR analysis of the indicated genes in 8- to 11-day-old flies expressing HTTex1Q25- or HTTex1Q91-GFP in Or83b+ ORNs. RNA was isolated from heads of uninjured flies or flies 3 h after bilateral antennal and maxillary palp nerve injury. Data are shown as mean ± SEM and normalized to the housekeeping gene rpl32. **p < 0.01, ***p < 0.001 by unpaired two-tailed t test; asterisks and hashtags indicate statistical significance comparing ± injury or genotypes, respectively.
Figure 7.
Figure 7.
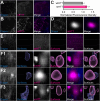
A subset of mHTTex1 aggregates are closely associated with Draper+ glial membranes. A,B, Maximum intensity projections of Or83b+ ORN axons from 7- to 8-day-old flies expressing (A) HTTex1Q25- or (B) HTTex1Q91-mCherry and immunostained for Draper. Scale bars = 10 μm. C, Quantification of Draper immunofluorescence from flies shown in (A,B). Data are normalized to control and graphed as mean ± SEM; *p < 0.05 by unpaired two-tailed t test; n = 12. D, Single 0.35 μm confocal slice showing a magnified HTTex1Q91-mCherry aggregate and closely-associated Draper signal. Scale bar = 0.5 μm. E,F, High-magnification confocal stacks of Draper signal within 0.2 μm of either (E) HTTex1Q25- or (F1–3) HTTex1Q91-mCherry surfaces. Raw data are shown to the left of segmented surfaces generated from each fluorescence signal. In (E), diffuse wtHTTex1 signal was adjusted postacquisition for increased visibility. Scale bars = 1 μm.
Figure 8.
Figure 8.
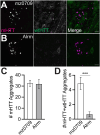
Seeded aggregation of wtHTTex1 in ensheathing glia by neuronal mHTTex1 aggregates. A,B, Maximum intensity projections of DA1 glomeruli from 4- to 5-day-old flies expressing HTTex1Q91-mCherry in DA1 ORNs and HTTex1Q25-GFP in (A) mz0709+ ensheathing glia or (B) Alrm+ astrocytic glia. Scale bars = 5 μm. C,D, Quantification of (C) HTTex1Q91-mCherry (“mHTT”) and (D) seeded HTTex1Q25-GFP (“mHTT+wtHTT”) aggregates from flies shown in (A,B). Data are shown as mean ± SEM; ***p < 0.001 by unpaired two-tailed t test.
Figure 9.
Figure 9.
Glial phagocytic and innate immunity genes regulate numbers of mHTTex1 aggregates in ORN axons. A, Maximum intensity projections of DA1 glomeruli from 7-day-old flies expressing HTTex1Q91-mCherry in DA1 ORNs and siRNAs targeting the indicated genes in ensheathing glia. Scale bars = 5 μm. B, Quantification of HTTex1Q91-mCherry aggregates detected in DA1 glomeruli from flies shown in (A). C, Maximum intensity projections of DA1 glomeruli from 7-day-old flies expressing HTTex1Q91-mCherry in DA1 ORNs and siRNAs targeting mCherry or Ets21c in repo+ glia in the presence of tubP-Gal80ts. Adult flies were raised at the permissive (18°C, top) or restrictive (29°C, bottom) temperatures to restrict siRNA expression to adults. Scale bars = 5 μm. D, Quantification of HTTex1Q91-mCherry aggregates detected in DA1 glomeruli from flies shown in (C). E, Mean volumes of HTTex1Q91-mCherry aggregates detected in DA1 glomeruli from flies shown in (A,C). All graphed data are shown as mean ± SEM; *p < 0.05, **p < 0.01, ***p < 0.001 by one-way ANOVA or unpaired two-tailed t test compared to no RNAi or mCherryRNAi controls.
Figure 10.
Figure 10.
Neuronal mHTTex1 expression increases numbers of acidified and active lysosomes in adult brains. A,B, Maximum intensity projections of antennal lobes from 9- to 10-day-old adult flies expressing (A) HTTex1Q25- or (B) HTTex1Q91-GFP in Or83b+ ORNs and stained with Magic Red (MR) to label active cathepsins. Scale bars = 10 μm. C, Quantification of MR+ surfaces (left) and HTTex1-associated MR+ surfaces (right) from flies shown in (A,B); HTTex1-associated vesicles were defined by filtering for MR+ surfaces ≤0.2 μm from HTTex1 fluorescent signal in confocal stacks. D,E, Maximum intensity projections of antennal lobes from 15-day-old flies expressing (D) HTTex1Q25- or (E) HTTex1Q91-GFP in Or83b+ ORNs and stained with Lysotracker Red (LTR) to label low pH compartments. Scale bars = 10 μm. Diffuse wtHTTex1 signal was adjusted postacquisition for increased visibility in panels (A,D). F, Quantification of LTR+ surfaces (left) and HTTex1-associated LTR+ surfaces (right) from flies shown in (D,E); HTTex1-associated vesicles were defined by filtering for LTR+ surfaces ≤0.2 μm from HTTex1 fluorescent signal in confocal stacks. Data are shown as mean ± SEM; ****p < 0.0001 by unpaired two-tailed t test. G,H, High-magnification regions of interest indicated in (B,E) showing colocalization of MR (G) or LTR (H) with mHTTex1 fluorescent signals. Scale bars = 1 μm.
Figure 11.
Figure 11.
LAMP1+ vesicle accumulation in fly brains expressing mHTTex1 in ORNs. A,B, Confocal stacks showing antennal lobes from 19- to 22-day-old flies expressing (A) HTTex1Q25- or (B) HTTex1Q91-mCherry in Or83b+ ORNs and LAMP1 tagged at its cytoplasmic C-terminus with GFP (LAMP1-GFP) in glia. Brains were immunostained with anti-GFP to amplify LAMP1-GFP signal. LAMP1-GFP+ or HTTex1+ segmented surfaces are shown to the right of each set of raw fluorescence images. Insets show magnified regions of interest from each image. Scale bars = 10 μm. C, High-magnification confocal stack showing a LAMP1-GFP+ surface within 0.2 μm of two HTTex1Q91-mCherry+ aggregates. Scale bar = 1 μm. D,E, Confocal stacks showing antennal lobes from 21- to 22-day-old flies expressing (D) HTTex1Q25- or (E) HTTex1Q91-mCherry in Or83b+ ORNs and LAMP1 tagged at its luminal N-terminus with GFP (GFP-LAMP1) in glia. GFP-LAMP1+ or HTTex1+ segmented surfaces are shown to the right of each set of raw fluorescence images. Insets show GFP-LAMP1+ surfaces of interest from each image at high magnification. Scale bars = 10 μm. Diffuse wtHTTex1 signal was adjusted postacquisition for increased visibility in panels (A,D). F, High-magnification confocal stack showing a GFP-LAMP1+ surface within 0.2 μm of a HTTex1Q91-mCherry+ aggregate. Scale bar = 1 μm. G–I, Quantification of total LAMP1-GFP+ or GFP-LAMP1+ surfaces (G), LAMP1-GFP+ or GFP-LAMP1+ surfaces ≤0.2 μm from HTTex1 surfaces (H), and mean LAMP1-GFP+ or GFP-LAMP1+ surface volume (I) in brains expressing HTTex1Q25- or HTTex1Q91-mCherry. The dark red bars in (I) represent LAMP1+ surfaces that colocalized with mHTTex1. All graphed data are shown as mean ± SEM; *p < 0.05, **p < 0.01, ***p < 0.001, ****p < 0.0001 by unpaired two-tailed t test.
Figure 12.
Figure 12.
Increased association of glial Galectins-3 and −8 with neuronal mHTTex1 aggregates. A–D, Confocal stacks showing antennal lobes from 16- to 18-day-old flies expressing HTTex1Q25- (A,C) or HTTex1Q91-GFP (B,D) in Or83b+ ORNs together with Galectin-3 (A,B) or Galectin-8 (C,D) tagged with mCherry in glia. Segmented Galectin+ or HTTex1+ surfaces are shown to the right of each set of raw fluorescence images. Insets show Galectin+ surfaces of interest from each image. Scale bars = 10 μm. E–G, Quantification of total Galectin+ surfaces (E), Galectin+ surfaces ≤0.2 μm from HTTex1 surfaces (F), and mean Galectin+ surface volume (G) in brains expressing HTTex1Q25- or HTTex1Q91-mCherry. The dark red bars in (G) represent Galectin+ surfaces that colocalized with mHTTex1. All graphed data are shown as mean ± SEM; *p < 0.05, **p < 0.01, ***p < 0.001, ****p < 0.0001 by unpaired two-tailed t test.
Figure 13.
Figure 13.
Knockdown of genes regulating lysosome acidification alters seeded aggregation of glial wtHTTex1 protein by neuronal mHTTex1 aggregates. A, Confocal stacks showing DA1 glomeruli from 8- to 9-day-old flies expressing HTTex1Q91-mCherry in DA1 ORNs and HTTex1Q25-GFP plus siRNAs targeting the indicated genes in repo+ glia. Negative controls expressed siRNAs targeting mCherry. Scale bars = 5 μm. B,C, Quantification of (B) HTTex1Q91-mCherry or (C) seeded HTTex1Q25-GFP aggregates from brains shown in (A). Data are shown as mean ± SEM; *p < 0.05, ***p < 0.005 by unpaired two-tailed t test.
Figure 14.
Figure 14.
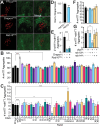
Rab10 is required for seeded aggregation of glial wtHTTex1 by neuronal mHTTex1 aggregates. A, Confocal stacks of DA1 glomeruli from 7-day-old flies expressing HTTex1Q91-mCherry in DA1 ORNs and HTTex1Q25-GFP plus siRNAs targeting firefly luciferase (FFLuc), Draper, or Rab10 in repo+ glia. Surfaces representing mHTTex1 aggregates (red) and seeded wtHTTex1 aggregates (yellow) are superimposed on the raw data. Scale bars = 5μm. B,C, mHTTex1 (B) or mHTTex1+wtHTTex1 (C) aggregates quantified from flies expressing HTTex1Q91-mCherry in DA1 ORNs and HTTex1Q25-GFP plus siRNAs targeting Draper-I (Drpr) or 23 different Rab GTPases in Repo+ glia. Negative controls expressed no siRNAs or siRNAs targeting FFLuc or mCherry (black bars). D, Normalized Draper immunofluorescence in the central brain of 4- to 5-day-old wild-type (rab10+/+) and rab10 null (rab10−/−) flies. E, Quantification of seeded wtHTTex1 aggregates in flies expressing HTTex1Q91-mCherry in DA1 ORNs and HTTex1Q25-GFP plus siRNAs targeting Rab10, without or with Draper-I cDNAs in repo+glia. F,G, Quantification of mHTTex1 (F) or mHTTex1+wtHTTex1 (G) aggregates from 10-day-old flies expressing HTTex1Q91-mCherry in DA1 ORNs and HTTex1Q25-GFP in PNs, either heterozygous or trans-heterozygous for draper (drpr/+), rab10 (rab10/+), or rab14 (rab14/+) mutant alleles. All graphed data are shown as mean ± SEM; *p < 0.05, **p < 0.01, ***p < 0.005 by one-way ANOVA or unpaired two-tailed t test comparing to controls.
Figure 15.
Figure 15.
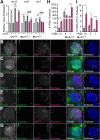
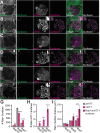
Association of neuronal mHTTex1 aggregates with Rab GTPases that associate with early, maturing, and late phagosomes. A, qPCR analysis of rab10, rab5, and rab7 expression in 8- to 11-day-old flies expressing GFP, HTTex1Q25-, or HTTex1Q91-GFP in Or83b+ ORNs. RNA was isolated from heads of uninjured flies or flies 3 h after bilateral antennal and maxillary palp nerve injury. Data are shown as mean ± SEM and normalized to the housekeeping gene rpl32. *p < 0.05, **p < 0.01, ***p < 0.001 by one-way ANOVA; asterisks and hashtags indicate statistical significance comparing ± injury or genotypes, respectively. B–G, Confocal stacks of the antennal lobe from 7-day-old flies expressing (B,D,F) HTTex1Q25- or (C,E,G) HTTex1Q91-V5 in Or83b+ ORNs and endogenously-tagged (B,C) YRab10, (D,E) YRab5, or (F,G) YRab7 in all cells. Brains were immunostained using YFP (green), V5 (magenta), and N-Cadherin (blue) antibodies. Segmented YRab+ or HTT+ surfaces are shown to the right of each set of raw fluorescent images. Insets show magnified YFP+ surfaces of interest from each image. Diffuse wtHTTex1 signal was adjusted postacquisition for increased visibility in panels (B,D,F). Scale bars = 10 μm. H,I, Quantification of YRab+ surfaces (H) and YRab+ surfaces within 0.2μm of HTTex1+ surfaces (I). Data are shown as mean ± SEM; *p < 0.05, **p < 0.01, ***p < 0.001, ****p < 0.0001 by unpaired two-tailed t test.
Figure 16.
Figure 16.
Association of neuronal mHTT aggregates with glial Rab GTPases that label early, maturing, and late phagosomes. A–F. Confocal stacks of the antennal lobe from 16- to 19-day-old flies expressing (A,C,E) HTTex1Q25- or (B,D,F) HTTex1Q91-V5 in Or83b+ ORNs together with (A,B) YFP-Rab10, (C,D) YFP-Rab5, or (E,F) YFP-Rab7 in repo+ glia. Brains were immunostained with anti-GFP to amplify YFP-Rab signals. Segmented Rab+ or HTTex1+ surfaces are shown to the right of each set of raw fluorescence images. Insets show magnified YFP-Rab+ surfaces of interest from each image. Diffuse wtHTTex1 signal was adjusted postacquisition for increased visibility in panels (A,C,E). Scale bars = 10 μm. G–I, Quantification of total YFP-Rab+ surfaces (G), YFP-Rab+ surfaces ≤0.2 μm from HTTex1 surfaces (H), and mean YFP-Rab+ surface volume (I) in brains expressing HTTex1Q25- or HTTex1Q91-mCherry. The dark red bars in (I) represent YFP-Rab+ surfaces that colocalized with mHTTex1. All graphed data are shown as mean ± SEM; *p < 0.05, **p < 0.01, ***p < 0.001, ****p < 0.0001 by unpaired two-tailed t test.
Figure 17.
Figure 17.
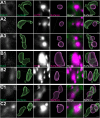
Glial YFP-Rab+ surfaces closely associate with neuronal mHTTex1 aggregates. High magnification confocal stacks showing examples of individual YFP+ surfaces within 0.2 μm of HTTex1Q91 aggregates from 21- to 22-day-old adult brains expressing HTTex1Q91-mCherry in Or83b+ ORNs and YFP-Rab10 (A1–3), YFP-Rab5 (B1,2), or YFP-Rab7 (C1,2) in repo+ glia. Brains were immunostained with anti-GFP to amplify YFP-Rab signals. Scale bars = 1 μm.
Figure 18.
Figure 18.
“Traffic jam” model illustrating effects of neuronal mHTTex1 aggregates on phagocytic glia. mHTTex1 aggregates (magenta circles) generated in axons cause phagolysosomal defects in nearby glial cells. Neuronal mHTTex1 aggregates activate glial Draper and Toll-6 signaling pathways (green arrows), but impair normal phagocytic responses to injury, including reduced nascent phagosome formation and decreased numbers of Rab5+ early phagosomes (red arrow). A buildup of engulfed mHTTex1 aggregates in glia leads to accumulation of maturing (Rab10+ or Rab7+) phagosomes and lysosomes (LAMP1+) (green arrows), possibly further slowing Draper-dependent engulfment and early phagosome formation. Defective phagocytic clearance could enhance leak or release of some mHTTex1 aggregates from phagolysosomes to increase their toxicity and capacity to seed soluble HTT proteins (magenta + green circles).

Update of

Similar articles

References

    1. Aits S, et al. (2015) Sensitive detection of lysosomal membrane permeabilization by lysosomal galectin puncta assay. Autophagy 11:1408–1424. 10.1080/15548627.2015.1063871 - DOI - PMC - PubMed
    1. Aman Y, et al. (2021) Autophagy in healthy aging and disease. Nat Aging 1:634–650. 10.1038/s43587-021-00098-4 - DOI - PMC - PubMed
    1. Bae E-J, et al. (2018) LRRK2 kinase regulates α-synuclein propagation via RAB35 phosphorylation. Nat Commun 9:3465. 10.1038/s41467-018-05958-z - DOI - PMC - PubMed
    1. Bonam SR, Wang F, Muller S (2019) Lysosomes as a therapeutic target. Nat Rev Drug Discov 18:923–948. 10.1038/s41573-019-0036-1 - DOI - PMC - PubMed
    1. Brand AH, Perrimon N (1993) Targeted gene expression as a means of altering cell fates and generating dominant phenotypes. Development 18:401–415. 10.1242/dev.118.2.401 - DOI - PubMed

MeSH terms

LinkOut - more resources