. 2024 Apr 6;14(1):8102.
doi: 10.1038/s41598-024-58439-3.

Hibiscus manihot L. flower extract induces anticancer activity through modulation of apoptosis and autophagy in A549 cells

Affiliations

Hibiscus manihot L. flower extract induces anticancer activity through modulation of apoptosis and autophagy in A549 cells

Minglu Xu et al. Sci Rep. .

Abstract

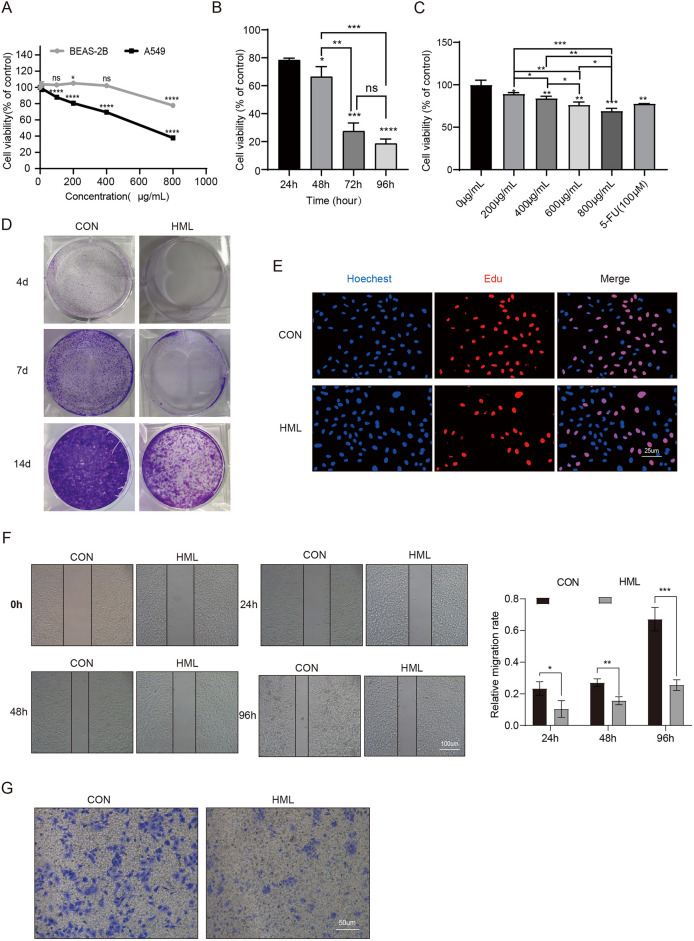
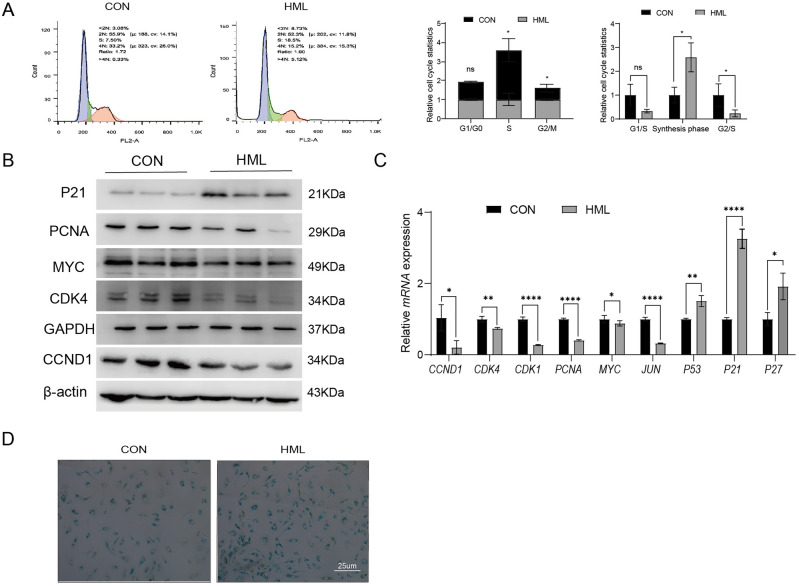
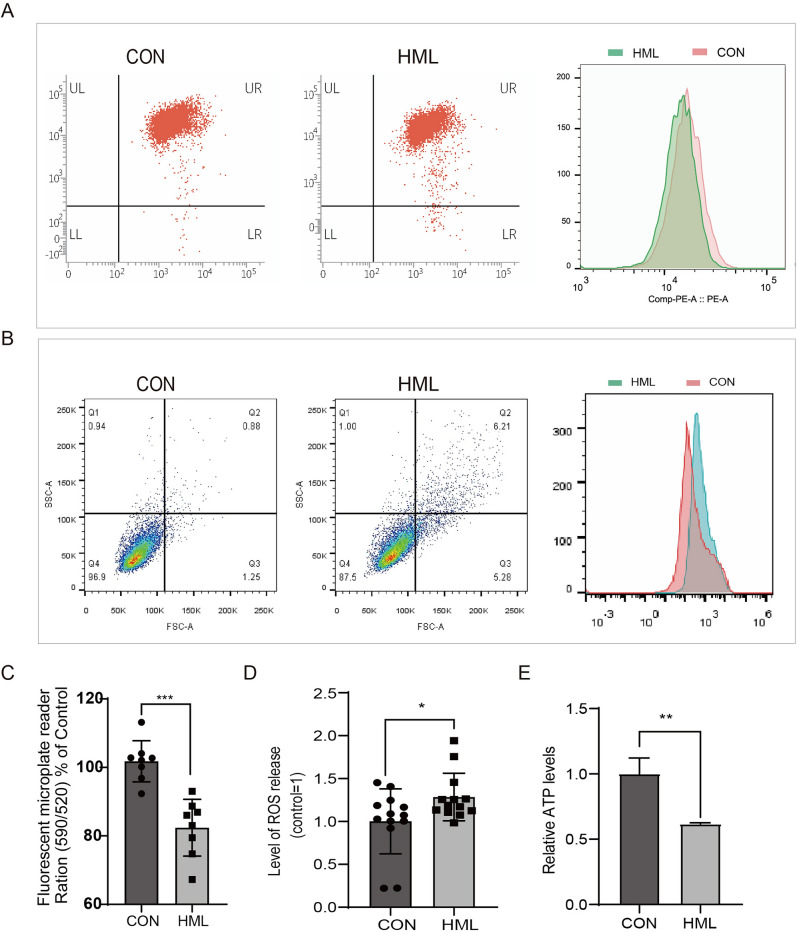
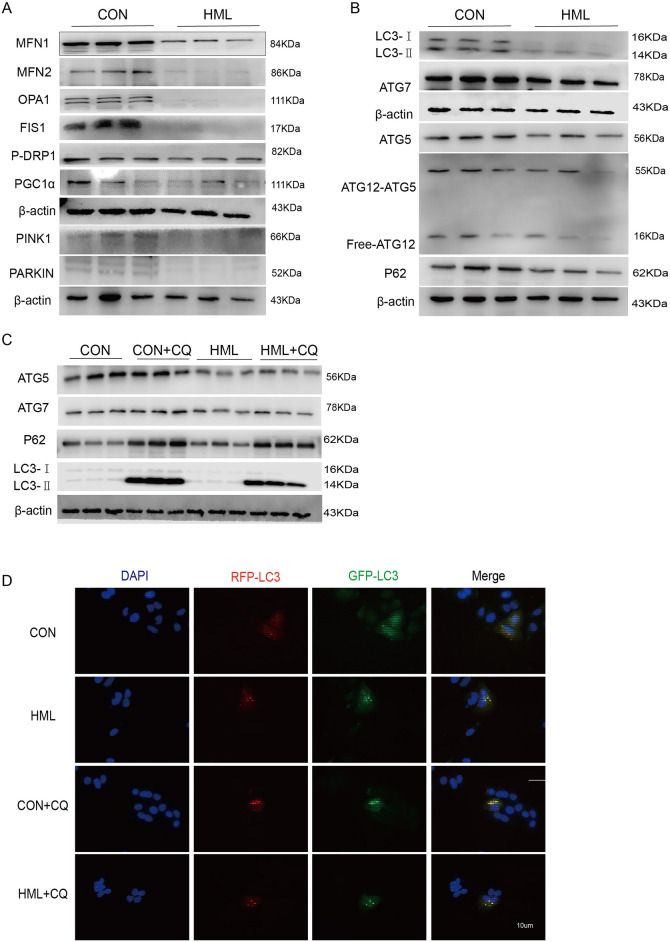
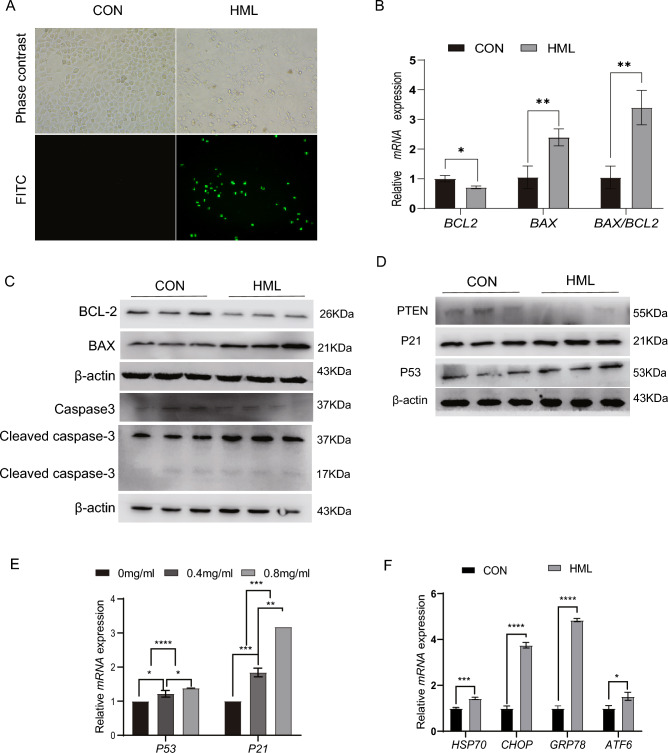
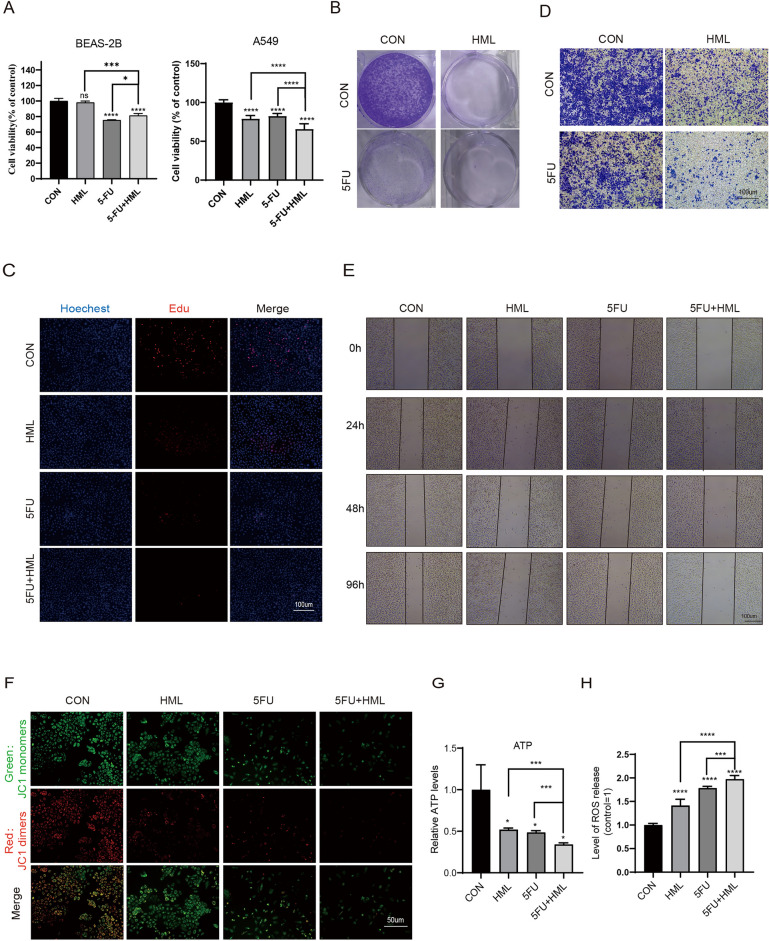
Lung cancer is a major public health issue and heavy burden in China and worldwide due to its high incidence and mortality without effective treatment. It's imperative to develop new treatments to overcome drug resistance. Natural products from food source, given their wide-ranging and long-term benefits, have been increasingly used in tumor prevention and treatment. This study revealed that Hibiscus manihot L. flower extract (HML) suppressed the proliferation and migration of A549 cells in a dose and time dependent manner and disrupting cell cycle progression. HML markedly enhanced the accumulation of ROS, stimulated the dissipation of mitochondrial membrane potential (MMP) and that facilitated mitophagy through the loss of mitochondrial function. In addition, HML induced apoptosis by activation of the PTEN-P53 pathway and inhibition of ATG5/7-dependent autophagy induced by PINK1-mediated mitophagy in A549 cells. Moreover, HML exert anticancer effects together with 5-FU through synergistic effect. Taken together, HML may serve as a potential tumor prevention and adjuvant treatment for its functional attributes.

Keywords: Hibiscus Manihot L flower; A549 cell; Apoptosis; Mitophagy; ROS.


Conflict of interest statement

The authors declare no competing interests.

Figures

Figure 1
Figure 1
HML inhibited the proliferation, migration and invasion of A549 cells. (AC) CCK-8 assays were performed to determine the cell viability, 5-FU: 100Um; (D) Representative image of colony formation experiments of the HML-treated experimental groups and the PBS-treated control groups. Each bar represents means ± SD from three independent; experiments; (E) The proliferation of A549 cell detected by EdU assay; (F) Scratch assay was performed on A549 cells after treatment with HML or PBS. The wound width was measured in 6 random sections, and the healing width was calculated by wound width at 0 h time point minus wound width at the measurement time point; (G) Transwell crystal violet staining method was used to detect cell migration and invasion ability. For (BE) data are representative of 3 or more independent experimental replicates, and data are presented as mean ± SEM for all replicates. T-test: *P < 0.05, **P < 0.01, ***P < 0.001, ****P < 0.0001.
Figure 2
Figure 2
HML induced the cell cycle arrest and cell senescence. (A) Cell cycle distribution of HML against A549 was studied by flow cytometry. Profiles were obtained by FACS. The histogram shows the percentages of treatment groups relative to the normal control group at different stages of the cell cycle (CON = 1); (B) Western blot analysis was performed to confirm the alterations in CDK4, CCND1, P21 and MYC in total protein extracts from cells treated with HML or PBS (control). β-actin was used as a loading control. Representative results of three independent experiments are shown; (C) Quantitative real-time PCR (quantitative real-time PCR) determined the changes of cell cycle related genes CCND1, CDK4, CDK1, PCNA, MYC, JUN, P53, P21 and P27 at the transcriptional level; (D) SA-β-Gal staining was applied to detect cellular senescence following treatment with HML or control. The statistical significance of differences for 2 groups was determined by 2-sided t test and among 3 or more groups it was determined using 1-way ANOVA, followed by Sidak’s post hoc tests. *P < 0.05, **P < 0.01, ***P < 0.001, ****P < 0.0001.
Figure 3
Figure 3
Effect of HML on mitochondria. (A,B) Flow cytometry analysis to determine changes in mitochondrial membrane potential (Δψm) (A) and ROS (B); (C,E) Fluorescence microplate reader analysis to determine changes in mitochondrial membrane potential (C) and ROS (E); (D) ATP level was determined by cell viability. *P < 0.05, **P < 0.01, ***P < 0.001.
Figure 4
Figure 4
HML inhibits the initiation of autophagy. (A,B) Western blot analysis of mitochondrial and autophagy-related protein levels in A549 cells after 48 h of HML treatment; (C) Expression of ATG5, ATG7 and LC3II was detected in A549 cells by western blot analysis after inhibition of autophagic degradation with the autophagy inhibitor chloroquine. (D) GFP-LC3 dual fluorescent labeling indicator system analyzes changes in autophagic flux.
Figure 5
Figure 5
HML activates mitochondrial apoptosis pathway through PTEN/P53 signaling pathway. (A) Apoptosis rate of A549 cells were determined by TUNEL staining after HML treatment for 48 h; (B,C) RT-qPCR (B) and Western blot (C) detected changes in BAX and BCL2 expression levels; (C) Immunoblot analysis was performed to confirm the alterations in BAX, BCL2, P53, Cleaved Caspase-3 and Caspase-3. (D) Expression of HML and PTEN-P53-related pathway proteins (PTEN, P53, P21) were determined by western blot analysis at 0, 0.4, 0.8 μg/mL. (E) RT- qPCR analysis was performed on the translational and transcriptional levels of P53, and P21 in A549 cells after 48 h of HML treatment at 0, 0.4, 0.8 μg/mL. (F) RT-qPCR was performed on the translational and transcriptional levels of HSP70, CHOP, GRP78 and ATF6 in A549 cells after 48 h of HML treatment at the indicated concentrations. Data are presented as mean ± SEM. *P < 0.05, **P < 0.01, ***P < 0.001.
Figure 6
Figure 6
HML synergistically enhances the therapeutic effects of 5-FU in A549 cells. (A) CCK-8 assays were performed to determine the cell viability, 5-FU: 100uM; (B) Representative images of colony-forming experiments for different treatment groups. Each bar represents the mean SD of three independent experiments; (C) The proliferation of A549 cell detected by EdU assay; (D) Transwell crystal violet staining method was used to detect cell migration and invasion ability; (E) Scratch assay was performed on A549 cells after treatment with different processing. The wound width was measured in 6 random sections, and the healing width was calculated by wound width at 0 h time point minus wound width at the measurement time point; (F) Fluorescence diagram of typical JC1 staining. Red: JC1 dimers, Green: JC1 monomers; (G): ATP level was determined by cell viability; (H) Fluorescence microplate reader analysis to determine changes in ROS.
Figure 7
Figure 7
Graphical model of HML regulation of cell death in A549 cells.

Similar articles

References

    1. Siegel RL, Miller KD, Fuchs HE, Jemal A. Cancer statistics, 2022. CA Cancer J. Clin. 2022;72:7–33. doi: 10.3322/caac.21708. - DOI - PubMed
    1. Sung H, et al. Global cancer statistics 2020: GLOBOCAN estimates of incidence and mortality worldwide for 36 cancers in 185 countries. CA Cancer J. Clin. 2021;71:209–249. doi: 10.3322/caac.21660. - DOI - PubMed
    1. Jia XB, Zhang Q, Xu L, Yao WJ, Wei L. Lotus leaf flavonoids induce apoptosis of human lung cancer A549 cells through the ROS/p38 MAPK pathway. Biol. Res. 2021;54:7. doi: 10.1186/s40659-021-00330-w. - DOI - PMC - PubMed
    1. Wu CY, et al. Dihydroisotanshinone I induced ferroptosis and apoptosis of lung cancer cells. Biomed. Pharmacother. 2021;139:111585. doi: 10.1016/j.biopha.2021.111585. - DOI - PubMed
    1. Yang J, Pi C, Wang G. Inhibition of PI3K/Akt/mTOR pathway by apigenin induces apoptosis and autophagy in hepatocellular carcinoma cells. Biomed. Pharmacother. Biomed. Pharmacother. 2018;103:699–707. doi: 10.1016/j.biopha.2018.04.072. - DOI - PubMed

Substances