. 2024 Apr 23;43(4):114072.
doi: 10.1016/j.celrep.2024.114072. Epub 2024 Apr 5.

Functionally diverse thymic medullary epithelial cells interplay to direct central tolerance

Affiliations

Functionally diverse thymic medullary epithelial cells interplay to direct central tolerance

Aya Ushio et al. Cell Rep. .

Abstract

Medullary thymic epithelial cells (mTECs) are essential for the establishment of self-tolerance in T cells. Promiscuous gene expression by a subpopulation of mTECs regulated by the nuclear protein Aire contributes to the display of self-genomic products to newly generated T cells. Recent reports have highlighted additional self-antigen-displaying mTEC subpopulations, namely Fezf2-expressing mTECs and a mosaic of self-mimetic mTECs including thymic tuft cells. In addition, a functionally different subset of mTECs produces chemokine CCL21, which attracts developing thymocytes to the medullary region. Here, we report that CCL21+ mTECs and Aire+ mTECs non-redundantly cooperate to direct self-tolerance to prevent autoimmune pathology by optimizing the deletion of self-reactive T cells and the generation of regulatory T cells. We also detect cooperation for self-tolerance between Aire and Fezf2, the latter of which unexpectedly regulates thymic tuft cells. Our results indicate an indispensable interplay among functionally diverse mTECs for the establishment of central self-tolerance.

Keywords: Aire; CCL21; CP: Immunology; Fezf2; autoimmunity; central tolerance; medullary thymic epithelial cell; negative selection; regulatory T cell; thymic tuft cell; thymus medulla.


Conflict of interest statement

Declaration of interests The authors declare no competing interests.

Figures
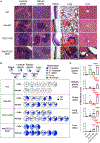
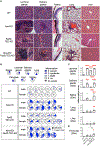
Figure 1.
Figure 1.. Tissue inflammation in mice deficient in Aire and/or CCL21
(A) Hematoxylin and eosin (H&E)-stained sections of the indicated tissues from female 20-week-old wild-type (WT), Aire knockout (KO), CCL21-KO, and Aire/ CCL21 double KO (DKO) mice. Representative data from at least 5 independent measurements (n = 5–8) are shown. Scale bars, 100 μm. (B) Pie chart showing the inflammation score of the indicated tissues from the indicated mice at 20 weeks of age. Each pie chart shows the scores for one mouse. Open and closed circles in the Aire-KO group indicate the GH strain and CB stain, respectively, as described in the STAR Methods. (C) Inflammation score of the indicated tissues from the indicated mice(n = 6–13) in at least 5 independent measurements at 10 weeks of age (lacrimal glands and salivary glands) and 20 weeks of age (retina, lungs, and liver). Means ± SEMs are plotted. **p < 0.01, ***p < 0.001, ****p < 0.0001. See also Figures S1 and S2.
Figure 2.
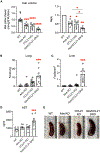
Figure 2.. Tissue damage in mice deficient in Aire and/or CCL21
(A) Tear volume measured in the indicated mice. The length of cotton threads with absorbed tears was normalized to body weight (n = 6–8, 10–11 weeks old, 6 independent measurements). Plotted is mean ± SEM. ***p < 0.001, ****p < 0.0001. (B and C) Numbers of inflammation foci in lung (B) and liver (C) sections. (D) AST concentrations in serum of the indicated mice (n = 7–8, 20 weeks old, 2 independent measurements, mean ± SEM). ***p < 0.001. (E) Representative macroscopic images of spleens from the indicated mice. Scale intervals indicate 1 mm.
Figure 3.
Figure 3.. Tissues in athymic mice transplanted with a thymus deficient in Aire and/ or CCL21
(A and B) Kidney of a B6-nude mouse 6 weeks after thymus transplantation. Shown are a macroscopic image (A) and H&E-stained sections (B) of the transplanted thymus under the kidney capsule in B6-nude mice. c, cortex. m, medulla. *, kidney. Scale bar, 100 μm. (C and D) H&E-stained liver sections from B6-nude mice transplanted with the thymus from the indicated mice. Sham operation mice received no thymus transplantation. Yellow arrowheads indicate foci, and green arrowheads indicate fibrosis (C). Representative data (n = 3–5) from 6 independent experiments are shown. Scale bars, 500 μm. Mean ± SEM of the number of foci per area (D) in the liver. *p < 0.05, ***p < 0.001; ns, not significant. See also Figures S3 and S4.
Figure 4.
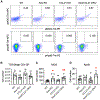
Figure 4.. Negative selection of thymocytes in mice deficient in Aire and/or CCL21
(A) Representative flow cytometry profiles for the detection of pMOG-tetramer-binding cells (top) and pApoB-tetramer-binding cells (bottom) in TCRβhigh CD4 single-positive (SP) thymocytes (PITCRβhighCD4+CD8−CD90.2 +CD11bCD11cB220NK1.1−) from indicated mice. Numbers indicate the frequency of cells in the boxes. (B–D) Numbers (means ± SEs) of TCRβhigh CD4 SP thymocytes (B), pMOG-tetramer-binding TCRβhigh CD4 SP thymocytes (n = 6–11 in 9 independent measurements) (C), and pApoB-tetramer-binding TCRβhigh CD4 SP thymocytes (n = 4–11 in 7 independent measurements) (D). Shown are data obtained from more than 5.0 × 10⁷ total thymocytes. *p < 0.05, **p < 0.01.
Figure 5.
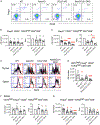
Figure 5.. CD25+ Foxp3+ Treg cells in a thymus of mice deficient in Aire and/or CCL21
(A) Representative profiles for the detection of CD25+Foxp3+ Treg cells in TCRβhigh CD4 SP thymocytes from the indicated mice. Numbers indicate the frequency of cells in the boxes. (B and C) Number (mean ± SE) of CD25Foxp3 TCRβhigh CD4 SP thymocytes (B) and CD25+Foxp3+TCRβhigh CD4 SP Treg cells (C) in the indicated mice (n = 5–13, 8–11 weeks, 6 independent experiments). (D) Representative CD73 expression profiles of CD25+Foxp3+TCRβhigh CD4 SP Treg cells in the thymus and the spleen of the indicated mice. Numbers in boxes indicate frequencies of cells. (E and F) Number (mean ± SE) of CD73+CD25+Foxp3+TCRβhigh CD4 Treg cells in the thymus (n = 7–8,8–12 weeks, 4 independent experiments, E) and the spleen (n = 5–7, 8–12 weeks, 4 independent experiments, F). (G) Number (mean ± SE) of CD25Foxp3+ TCRβhigh CD4 SP Treg cell precursor thymocytes in the indicated mice (n = 5–13, 8–11 week, 6 independent experiments). Ratios of cell numbers in comparison with the numbers in control WT mice are also shown. *p < 0.05, ***p < 0.001, ****p < 0.0001.
Figure 6.
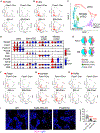
Figure 6.. Single-cell RNA sequencing analysis in Fezf2-deficient TECs
(A and B) Uniform manifold approximation and projection (UMAP) profiles of Fezf2 (A) and Aire (B) expression (red) in Epcam+Cd45 TECs (gray) isolated from the indicated mice. (C and D) UMAP profile of Epcam+Cd45 TECs (C) reveals cell clusters as indicated based on gene expression profiles shown in violin plots (D). Equivalent expression of Epcam and Foxn1 indicates that all 4 clusters are TECs (D). Selective expression of Psmb11, Prss16, Aire, Ccl21a, and Pou2f3 (D) identifies the cTEC cluster, Aire+ mTEC cluster, CCL21+ mTEC cluster, and mimetic mTEC cluster (C). Mice analyzed were Fezf2flox/flox homozygotes in the absence or presence of the Foxn1-Cre-transgene and in the absence or presence of the β5tiCre/+ heterozygous knockin allele (D). Psmb11 encodes β5t, and the β5t-iCre allele carries the iCre sequence knocked in in place of the Psmb11 sequence in the mouse genome. Consequently, Psmb11 transcripts in β5tiCre/+ TECs were reduced to 51.6% of those in β5t+/+ control mice (p < 0.001), whereas Psmb11 transcripts in Foxn1-Cre+ TECs were 89.3% of those in Foxn1-Cre control mice (not statistically significant) (D). β5tiCre/+ mice, in which Psmb11 mRNA in cTECs is reduced to approximately half, did not show any reduction in β5t protein or its function. (E) Pie charts showing the proportions of the indicated clusters in Epcam+Cd45 TECs from the indicated mice. Numbers of total Epcam+Cd45 TECs in the indicated mice are shown in parentheses. (F-H) UMAP profiles of the indicated genes (red). (I) Immunofluorescence analysis of the thymus sections from Fezf2flox/flox control mice, β5tiCre/+ Fezf2flox/flox TEC-specific Fezf2-deficient mice, and Pou2f3-deficient mice. DCLK1-expressing thymic tuft cells are detected in the Ly51 medullary region in the thymus from control mice. Representative data from 3 individual measurements are shown. Scale bars, 250 μm. Plotted are the numbers of DCLK1+ cells in 1-mm2 areas in the thymus medulla, counted in 3 areas per mouse (n = 9). See also Figures S5 and S6
Figure 7.
Figure 7.. Lymphocyte infiltration in mice deficient in Aire and Fezf2
(A) H&E-stained sections of the indicated tissues from female 20-week-old WT; Aire KO; TEC-specific, Fezf2-deficient (Fezf2-TEC-KO); and Aire-KO/Fezf2-TEC-KO mice. Representative data from at least 3 independent measurements (n = 5–6) are shown. Scale bars, 100 μm. (B) Pie chart showing the inflammation score of the indicated tissues from the indicated mice at 20 weeks of age. Closed and open circles in Fezf2-TEC-KO and Aire-KO/Fezf2-TEC-KO groups indicate β5tiCre/+ mice and Foxn1-Cre-transgenic mice, respectively. (C and D) Inflammation scores (C) and numbers of inflammation foci (D) of the indicated tissues from the indicated mice (n = 7–11) in at least 5 independent measurements at 20 weeks of age. Mean ± SEM is plotted. *p < 0.05, **p < 0.01, ***p < 0.001, ****p < 0.0001. See also Figure S7.

Similar articles

Cited by

References

    1. Derbinski J, Schulte A, Kyewski B, and Klein L (2001). Promiscuous gene expression in medullary thymic epithelial cells mirrors the peripheral self. Nat. Immunol 2, 1032–1039. 10.1038/ni723. - DOI - PubMed
    1. Derbinski J, Gäbler J, Brors B,Tierling S, Jonnakuty S, Hergenhahn M, Peltonen L, Walter J, and Kyewski B (2005). Promiscuous gene expression in thymic epithelial cells is regulated at multiple levels. J.Exp. Med 202, 33–45. 10.1084/jem.20050471. - DOI - PMC - PubMed
    1. Anderson MS, Venanzi ES, Klein L, Chen Z, Berzins SP, Turley SJ, von Boehmer H, Bronson R, Dierich A, Benoist C, and Mathis D (2002). Projection of an immunological self shadow within the thymus by the aire protein. Science 298, 1395–1401. 10.1126/science.1075958. - DOI - PubMed
    1. Bansal K, Yoshida H, Benoist C, and Mathis D (2017). The transcriptional regulator Aire binds to and activates super-enhancers. Nat. Immunol 18, 263–273. 10.1038/ni.3675. - DOI - PMC - PubMed
    1. Takaba H, Morishita Y, Tomofuji Y, Danks L, Nitta T, Komatsu N, Kodama T, and Takayanagi H (2015). Fezf2 orchestrates a thymic program of self-antigen expression for immune tolerance. Cell 163, 975–987. 10.1016/j.cell.2015.10.013. - DOI - PubMed

Publication types

LinkOut - more resources