Low Functional network integrity in cognitively unimpaired and MCI subjects with depressive symptoms: results from a multi-center fMRI study
- PMID: 38580625
- PMCID: PMC10997664
- DOI: 10.1038/s41398-024-02891-2
Low Functional network integrity in cognitively unimpaired and MCI subjects with depressive symptoms: results from a multi-center fMRI study
Abstract
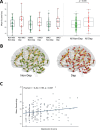
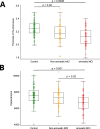
Evidence suggests that depressive symptomatology is a consequence of network dysfunction rather than lesion pathology. We studied whole-brain functional connectivity using a Minimum Spanning Tree as a graph-theoretical approach. Furthermore, we examined functional connectivity in the Default Mode Network, the Frontolimbic Network (FLN), the Salience Network, and the Cognitive Control Network. All 183 elderly subjects underwent a comprehensive neuropsychological evaluation and a 3 Tesla brain MRI scan. To assess the potential presence of depressive symptoms, the 13-item version of the Beck Depression Inventory (BDI) or the Geriatric Depression Scale (GDS) was utilized. Participants were assigned into three groups based on their cognitive status: amnestic mild cognitive impairment (MCI), non-amnestic MCI, and healthy controls. Regarding affective symptoms, subjects were categorized into depressed and non-depressed groups. An increased mean eccentricity and network diameter were found in patients with depressive symptoms relative to non-depressed ones, and both measures showed correlations with depressive symptom severity. In patients with depressive symptoms, a functional hypoconnectivity was detected between the Anterior Cingulate Cortex (ACC) and the right amygdala in the FLN, which impairment correlated with depressive symptom severity. While no structural difference was found in subjects with depressive symptoms, the volume of the hippocampus and the thickness of the precuneus and the entorhinal cortex were decreased in subjects with MCI, especially in amnestic MCI. The increase in eccentricity and diameter indicates a more path-like functional network configuration that may lead to an impaired functional integration in depression, a possible cause of depressive symptomatology in the elderly.
© 2024. The Author(s).
Conflict of interest statement
The authors declare no competing interests.
Figures


Similar articles
-
Default Mode Network Connectivity and Related White Matter Disruption in Type 2 Diabetes Mellitus Patients Concurrent with Amnestic Mild Cognitive Impairment.Curr Alzheimer Res. 2017;14(11):1238-1246. doi: 10.2174/1567205014666170417113441. Curr Alzheimer Res. 2017. PMID: 28413981
-
Frequency-Dependent Changes in the Amplitude of Low-Frequency Fluctuations in Mild Cognitive Impairment with Mild Depression.J Alzheimers Dis. 2017;58(4):1175-1187. doi: 10.3233/JAD-161282. J Alzheimers Dis. 2017. PMID: 28550250
-
Hippocampal Neuronal Integrity and Functional Connectivity Within the Default Mode Network in Mild Cognitive Impairment: A Multimodal Investigation.Brain Connect. 2023 Apr;13(3):143-153. doi: 10.1089/brain.2022.0050. Epub 2022 Dec 21. Brain Connect. 2023. PMID: 36367166
-
Tipping the scales: how clinical assessment shapes the neural correlates of Parkinson's disease mild cognitive impairment.Brain Imaging Behav. 2022 Apr;16(2):761-772. doi: 10.1007/s11682-021-00543-3. Epub 2021 Sep 22. Brain Imaging Behav. 2022. PMID: 34553331
-
Depressive symptoms in cognitively unimpaired older adults are associated with lower structural and functional integrity in a frontolimbic network.Mol Psychiatry. 2022 Dec;27(12):5086-5095. doi: 10.1038/s41380-022-01772-8. Epub 2022 Oct 18. Mol Psychiatry. 2022. PMID: 36258017 Free PMC article. Review.
References
Publication types
MeSH terms
LinkOut - more resources
Full Text Sources
Medical
Miscellaneous

