. 2024 Apr 4;57(1):15.
doi: 10.1186/s40659-024-00493-2.

Cx43 hemichannels and panx1 channels contribute to ethanol-induced astrocyte dysfunction and damage

Affiliations

Cx43 hemichannels and panx1 channels contribute to ethanol-induced astrocyte dysfunction and damage

Gonzalo I Gómez et al. Biol Res. .

Abstract

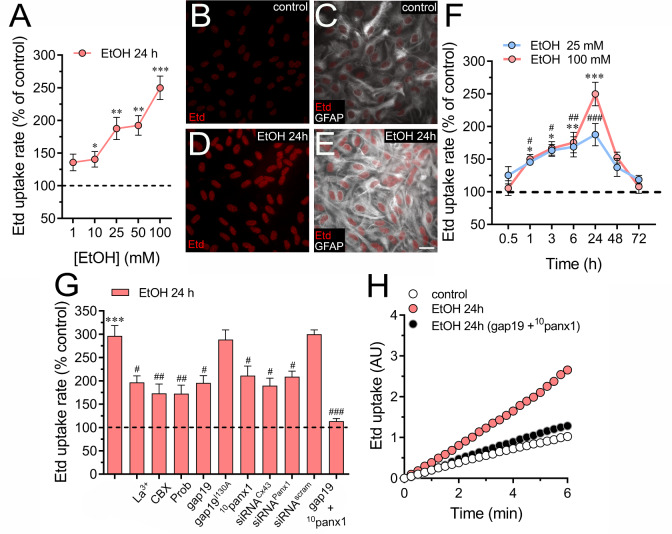
Background: Alcohol, a widely abused drug, significantly diminishes life quality, causing chronic diseases and psychiatric issues, with severe health, societal, and economic repercussions. Previously, we demonstrated that non-voluntary alcohol consumption increases the opening of Cx43 hemichannels and Panx1 channels in astrocytes from adolescent rats. However, whether ethanol directly affects astroglial hemichannels and, if so, how this impacts the function and survival of astrocytes remains to be elucidated.

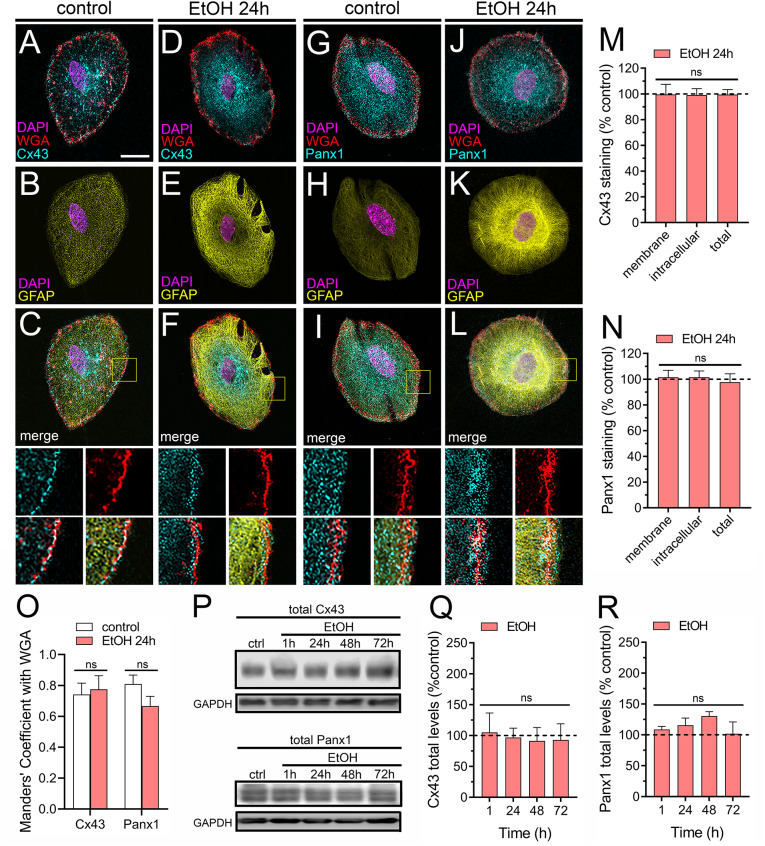
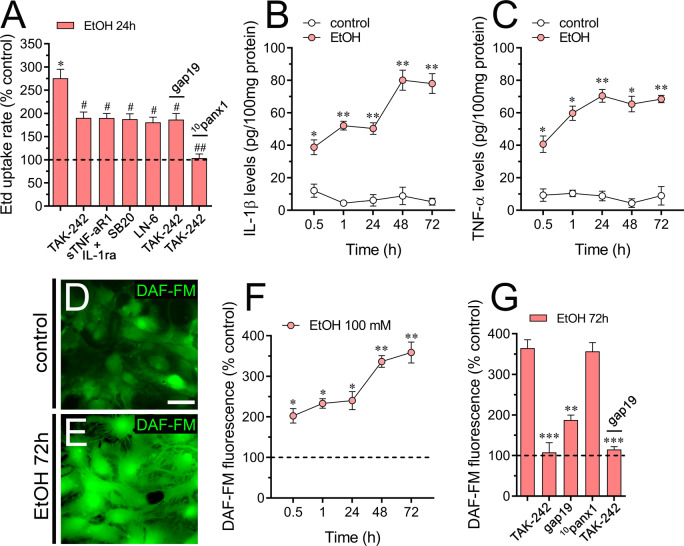
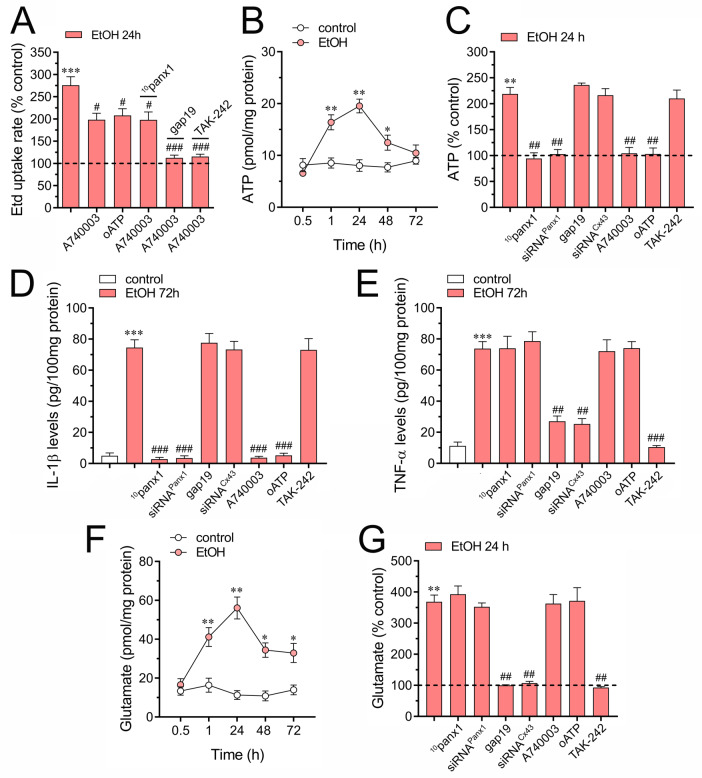
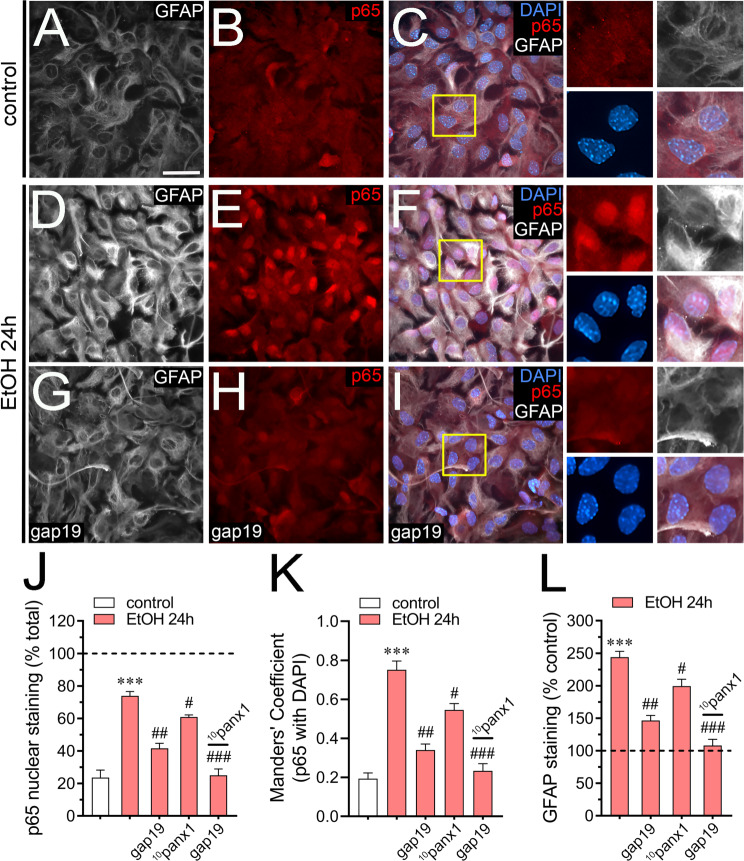
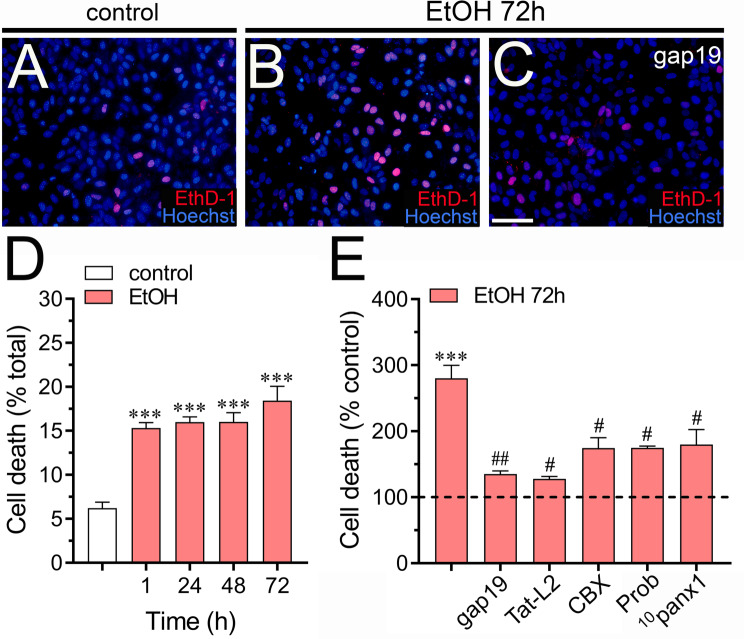
Results: Clinically relevant concentrations of ethanol boost the opening of Cx43 hemichannels and Panx1 channels in mouse cortical astrocytes, resulting in the release of ATP and glutamate. The activation of these large-pore channels is dependent on Toll-like receptor 4, P2X7 receptors, IL-1β and TNF-α signaling, p38 mitogen-activated protein kinase, and inducible nitric oxide (NO) synthase. Notably, the ethanol-induced opening of Cx43 hemichannels and Panx1 channels leads to alterations in cytokine secretion, NO production, gliotransmitter release, and astrocyte reactivity, ultimately impacting survival.

Conclusion: Our study reveals a new mechanism by which ethanol impairs astrocyte function, involving the sequential stimulation of inflammatory pathways that further increase the opening of Cx43 hemichannels and Panx1 channels. We hypothesize that targeting astroglial hemichannels could be a promising pharmacological approach to preserve astrocyte function and synaptic plasticity during the progression of various alcohol use disorders.

Keywords: Alcoholism and neuroinflammation; Astrocyte; Connexin-43; Ethanol; Hemichannels; Pannexin-1.


Conflict of interest statement

The authors declare that they have no competing interests.

Figures

Fig. 1
Fig. 1
Ethanol increases the activity of Cx43 hemichannels and Panx1 channels in cultured astrocytes. (A) Averaged Etd uptake rate (AU/min) normalized with the control condition (dashed line) by astrocytes treated for 24 h with different concentrations of ethanol (red circles). *p < 0.05, **p < 0.005, ***p < 0.0001, ethanol treatment compared to control conditions (one-way ANOVA followed by Tukey’s post-hoc test). (B-E) Representative immunofluorescence images depicting Etd and GFAP staining from dye uptake measurements (10 min exposure to Etd) in astrocytes under control conditions (B-C) or treated for 24 h with 100 mM ethanol (D-E). (F) Averaged Etd uptake rate (AU/min) normalized with the control condition (dashed line) by astrocytes treated for several time periods with ethanol at two concentrations: 25 mM (blue circles) or 100 mM (red circles). *p < 0.05, **p < 0.005, ***p < 0.0001, 100 mM ethanol treatment compared to control conditions; #p < 0.05, ##p < 0.005, ###p < 0.0001, 25 mM ethanol treatment compared to control conditions (one-way ANOVA followed by Tukey’s post-hoc test). (G) Averaged Etd uptake rate (AU/min) normalized with control condition (dashed line) by astrocytes treated for 24 h with 100 mM ethanol alone or in combination with the following blockers: 200 µM La3+, 5 µM carbenoxolone (CBX), 500 µM Probenecid (Prob), 50 µM gap19, 50 µM gap19I130A, 50 µM 10panx1, siRNACx43, siRNAPanx1; siRNAscrb and 50 µM gap19 + 50 µM 10panx1. ***p < 0.0001, ethanol compared to control; #p < 0.05, ##p < 0.005; ###p < 0.001; effect of pharmacological agents compared to ethanol treatment (one-way ANOVA followed by Tukey’s post-hoc test). (H) Time-lapse measurements of Etd uptake by astrocytes under control conditions (white circles) or treated for 24 h with 100 mM ethanol alone (red circles) or in combination with 50 µM gap19 + 50 µM 10panx1 (black circles). Data were obtained from at least three independent experiments with three or more repeats each one (≥ 30 cells analyzed for each repeat). Calibration bar = 30 μm
Fig. 2
Fig. 2
Ethanol increases the activity of large-pore channels in HeLa cells transfected with Cx43 or Panx1. (A-D) Representative images depicting Cx43EGFP (green), Panx1EGFP (green) and DAPI (blue, 5 µM and 10 min of exposure) labeling by HeLa-Cx43EGFP (A-B) and HeLa-Panx1 EGFP (C-D) cells under control conditions or treated for 24 h with 100 mM ethanol. Insets at the right of each panel depict the respective DAPI labeling alone (top) or plus the phase view merged with EGFP (bottom). (E-F) Time-lapse measurements of DAPI uptake by HeLa-Cx43EGFP (E) and HeLa-Panx1 EGFP (F) cells under control conditions (white circles) or treated for 24 h with 100 mM ethanol (red circles). (G) Averaged DAPI uptake rate (AU/min) normalized with the control condition (dashed line) by parental HeLa, HeLa-Cx43EGFP and HeLa-Panx1 EGFP cells treated for 24 h with 100 mM ethanol. In some experiments, HeLa-Cx43EGFP or HeLa-Panx1 EGFP cells were treated for 24 h with 100 mM ethanol plus 50 µM gap19 or 50 µM 10panx1, respectively. *p < 0.05, **p < 0.01, ethanol treatment compared to control conditions (two-way ANOVA followed by Tukey’s post-hoc test). Data were obtained from at least three independent experiments with three or more repeats each one (≥ 20 cells analyzed for each repeat). Calibration bar = 15 μm
Fig. 3
Fig. 3
Ethanol does not modulate levels and plasma membrane distribution of Cx43 and Panx1 in cultured astrocytes. (A-L) Representative confocal images depicting Cx43 (cyan, left panel) or Panx1 (cyan, right panel) immunostaining in combination with DAPI (magenta) and WGA (red) labeling by astrocytes under control conditions (A-C and G-I) or treated for 24 h with 100 mM ethanol (D-F and J-L). The size of the z-step acquisition for all images was 0.3 μm. Calibration Bar: 10 μm. Insets: 2X magnification of the indicated area of panels C, F, I and L. (M-N) Quantification of membrane, intracellular and total staining of Cx43 (M) and Panx1 (N) normalized to control conditions (dashed line) by astrocytes treated for 24 h with 100 mM ethanol. (O) Quantification of Manders’ overlap coefficient for Cx43 or Panx1 with WGA by astrocytes under control conditions (white bars) or treated for 24 h with 100 mM ethanol (red bars). (P) Total Cx43 (upper panel) and Panx1 (bottom panel) levels by astrocytes under control conditions or treated for 1, 24, 48–72 h with 100 mM ethanol. Total levels of each analyzed band were normalized according to the levels of GADPH detected in each lane. (Q-R) Quantification of total levels of Cx43 (Q) and Panx1 (R) normalized to control (dashed line) in astrocytes treated for 1, 24, 48–72 h with 100 mM ethanol. Averaged data were obtained from three independent experiments
Fig. 4
Fig. 4
Ethanol-induced Cx43 hemichannel activity depends on TLR4 and IL-1β/TNF-α/p38 MAPK/iNOS-dependent signaling. (A) Averaged Etd uptake rate (AU/min) normalized with control condition (dashed line) by astrocytes treated for 24 h with 100 mM ethanol alone or in combination with the following agents: 0.5 µM TAK-242, 100 ng/mL of IL-1ra + 100 ng/mL of sTNF-αR1, 1 µM SB203580, 1 µM L-N6, 20 nM 0.5 µM TAK-242 + 50 µM gap19 or 0.5 µM TAK-242 + 50 µM 10panx1. *p < 0.005, ethanol treatment compared to control conditions; #p < 0.01; ##p < 0.005; effect of pharmacological agents compared to ethanol treatment (one-way ANOVA followed by Tukey’s post-hoc test). Data were obtained from at least three independent experiments with three or more repeats each one (≥ 30 cells analyzed for each repeat). (B-C) Averaged data of IL-1β (B) and TNF-α (C) released by astrocytes under control conditions (white circles) or treated for several time periods with 100 mM ethanol (red circles). *p < 0.05, **p < 0.01, ethanol treatment compared to control conditions (one-way ANOVA followed by Tukey’s post-hoc test). (D-E) Representative fluorescence micrographs of basal NO production (DAF-FM, green) by astrocytes under control conditions (D) or treated for 24 h with 100 mM ethanol (E). Calibration Bar: 20 μm. (F) Average DAF-FM fluorescence normalized to control conditions (dashed line) by astrocytes treated with 100 mM ethanol for several time periods. *p < 0.05, **p < 0.005, ethanol treatment compared to control conditions (one-way ANOVA followed by Tukey’s post-hoc test). (G) Average DAF-FM fluorescence normalized to control conditions (dashed line) by astrocytes treated for 72 h with 100 mM ethanol alone or in combination with the following agents: 0.5 µM TAK-242, 50 µM gap19, 50 µM 10panx1 or 0.5 µM TAK-242 + 50 µM gap19. ***p < 0.005, **p < 0.001, effect of pharmacological agents compared to ethanol treatment (one-way ANOVA followed by Tukey’s post-hoc test)
Fig. 5
Fig. 5
The ethanol-induced activation of hemichannels and pannexons triggers the release of ATP and glutamate by different pathways in cultured astrocytes. (A) Averaged Etd uptake rate (AU/min) normalized with control condition (dashed line) by astrocytes treated for 24 h with 100 mM ethanol alone or in combination with the following agents: 200 nM A740003, 200 µM oATP, 200 nM A740003 + 50 µM 10panx1, 200 nM A740003 + 50 µM gap19 or 200 nM A740003 + 0.5 µM TAK-242. ***p < 0.001, ethanol treatment compared to control conditions; #p < 0.05; ###p < 0.005; effect of pharmacological agents compared to ethanol treatment (one-way ANOVA followed by Tukey’s post-hoc test). (B) Averaged data of ATP release by astrocytes under control conditions (white circles) or treated with 100 mM ethanol for different time periods (red circles). *p < 0.05, **p < 0.01, ethanol treatment compared to control conditions (one-way ANOVA followed by Tukey’s post-hoc test). (C) Averaged data of ATP release by astrocytes under control conditions (dashed line) or treated for 24 h with 100 mM ethanol alone or in combination with the following agents: 50 µM 10panx1, siRNAPanx1, 50 µM gap19, siRNACx43, 200 nM A740003, 200 µM oATP or 0.5 µM TAK-242. **p < 0.01, ethanol treatment compared to control conditions; ##p < 0.01; effect of pharmacological agents compared to ethanol treatment (one-way ANOVA followed by Tukey’s post-hoc test). (D-E) Averaged data of IL-1β (D) and TNF-α (E) release by astrocytes under control conditions (white bar) or treated for 72 h with 100 mM ethanol (red bars) or in combination with the following agents: 50 µM 10panx1, siRNAPanx1, 50 µM gap19, siRNACx43, 200 nM A740003, 200 µM oATP or 0.5 µM TAK-242. ***p < 0.005, ethanol treatment compared to control conditions; ###p < 0.005; effect of pharmacological agents compared to ethanol treatment (one-way ANOVA followed by Tukey’s post-hoc test). (F) Averaged data of glutamate release by astrocytes under control conditions (white circles) or treated with 100 mM ethanol for different time periods (red circles). *p < 0.05, **p < 0.01, ethanol treatment compared to control conditions (one-way ANOVA followed by Tukey’s post-hoc test). (G) Averaged data of glutamate release by astrocytes under control conditions (dashed line) or treated for 24 h with 100 mM ethanol alone or in combination with the following agents: 50 µM 10panx1, siRNAPanx1, 50 µM gap19, siRNACx43, 200 nM A740003, 200 µM oATP or 0.5 µM TAK-242. **p < 0.01, ethanol treatment compared to control conditions; ##p < 0.01; effect of pharmacological agents compared to ethanol treatment (one-way ANOVA followed by Tukey’s post-hoc test). Data were obtained from at least three independent experiments with three or more repeats each one (≥ 30 cells analyzed for each repeat)
Fig. 6
Fig. 6
Ethanol boosts the expression of GFAP and NF-κB p65 by a mechanism involving the activation of hemichannels and pannexons in cultured astrocytes. (A-I) Representative fluorescence micrographs of GFAP (white), NF-κB p65 (red) and DAPI (blue) labeling by astrocytes under control conditions (A-C) or treated for 24 h with 100 mM ethanol alone (D-F) or in combination with 50 µM gap19 (G-I). Insets: 2X magnification of the indicated area of panels C, F and I. (J) Quantitation of NF-κB p65 nuclear staining by astrocytes under control conditions (white bars) or treated for 24 h with 100 mM ethanol alone (red bars) or in combination with 50 µM gap19, 50 µM 10panx1 or 50 µM gap19 plus 50 µM 10panx1. (K) Quantification of Manders’ overlap coefficient for NF-κB p65 with DAPI by astrocytes under control conditions (white bars) or treated for 24 h with 100 mM ethanol alone (red bars) or in combination with 50 µM gap19, 50 µM 10panx1 or 50 µM gap19 plus 50 µM 10panx1. (L) Quantitation of GFAP staining normalized to control conditions (dashed line) by astrocytes treated for 24 h with 100 mM ethanol alone (red bars) or in combination with 50 µM gap19, 50 µM 10panx1 or 50 µM gap19 plus 50 µM 10panx1. ***p < 0.0005, ethanol treatment compared to control conditions, #p < 0.05, ##p < 0.001, effect of pharmacological agents compared to ethanol treatment (one-way ANOVA followed by Tukey’s post-hoc test). Data were obtained from at least three independent experiments with three or more repeats each one (≥ 20 cells analyzed for each repeat). Calibration bar = 80 μm
Fig. 7
Fig. 7
Hemichannels and pannexons contribute to ethanol-induced cell death in cultured astrocytes. (A-C) Representative fluorescence micrographs of Eth-D1 (red) uptake and Hoechst 33,342 nuclear staining (blue) by astrocytes under control conditions (A) or treated for 72 h with 100 mM ethanol alone (B) or in combination with 50 µM gap19 (C). (D) Quantitation of cell death (Eth-D1 staining) as a percentage of total cells (Hoechst 33,342) by astrocytes under control conditions (white bars) or treated for 1, 24, 48 or 72 h with 100 mM ethanol (red bars). **p < 0.001, ethanol treatment compared to control conditions (one-way ANOVA followed by Tukey’s post-hoc test). (E) Quantitation of cell death normalized to control conditions (dashed line) by astrocytes treated for 72 h with 100 mM ethanol alone (red bars) or in combination with the following pharmacological agents: 50 µM gap19, 50 µM Tat-L2, 5 µM CBX, 500 µM Prob or 50 µM 10panx1. ***p < 0.0005, ethanol compared to control; #p < 0.05, ##p < 0.001; effect of pharmacological agents compared to ethanol treatment (one-way ANOVA followed by Tukey’s post-hoc test). Data were obtained from at least three independent experiments with three or more repeats each one. Calibration bar = 150 μm

Similar articles

Cited by

References

    1. Koob GF, Le Moal M. Plasticity of reward neurocircuitry and the ‘dark side’ of drug addiction. Nat Neurosci. 2005;8(11):1442–4. doi: 10.1038/nn1105-1442. - DOI - PubMed
    1. Organization WH. Global status report on alcohol and health 2018. Geneva: Licence: CC BY-NC-SA 3.0 IGO.; 2018.
    1. Morisot N, Ron D. Alcohol-dependent molecular adaptations of the NMDA receptor system. Genes Brain Behav. 2017;16(1):139–48. doi: 10.1111/gbb.12363. - DOI - PMC - PubMed
    1. Forstera B, Castro PA, Moraga-Cid G, Aguayo LG. Potentiation of Gamma Aminobutyric Acid receptors (GABAAR) by ethanol: how are inhibitory receptors affected? Front Cell Neurosci. 2016;10:114. doi: 10.3389/fncel.2016.00114. - DOI - PMC - PubMed
    1. Burgos CF, Munoz B, Guzman L, Aguayo LG. Ethanol effects on glycinergic transmission: from molecular pharmacology to behavior responses. Pharmacol Res. 2015;101:18–29. doi: 10.1016/j.phrs.2015.07.002. - DOI - PMC - PubMed