[Preprint]. 2024 Mar 21:rs.3.rs-4016606.
doi: 10.21203/rs.3.rs-4016606/v1.

Auto-sumoylation of the Ubc9 E2 SUMO-conjugating Enzyme Extends Cellular Lifespan

Affiliations

Auto-sumoylation of the Ubc9 E2 SUMO-conjugating Enzyme Extends Cellular Lifespan

Hong-Yeoul Ryu et al. Res Sq. .

Abstract

Calorie restriction (CR) provides anti-aging benefits through diverse processes, such as reduced metabolism and growth and increased mitochondrial activity. Although controversy still exists regarding CR-mediated lifespan effects, many researchers are seeking interventions that mimic the effects of CR. Yeast has proven to be a useful model system for aging studies, including CR effects. We report here that yeast adapted through in vitro evolution to the severe cellular stress caused by loss of the Ulp2 SUMO-specific protease exhibit both enhanced growth rates and replicative lifespan, and they have altered gene expression profiles similar to those observed in CR. Notably, in certain evolved ulp2Δ lines, a dramatic increase in the auto-sumoylation of Ubc9 E2 SUMO-conjugating enzyme results in altered regulation of multiple targets involved in energy metabolism and translation at both transcriptional and post-translational levels. This increase is essential for the survival of aged cells and CR-mediated lifespan extension. Thus, we suggest that high Ubc9 auto-sumoylation exerts potent anti-aging effects by promoting efficient energy metabolism-driven improvements in cell replication abilities. This potential could be therapeutically explored for the development of novel CR-mimetic strategies.

Keywords: SUMO; Ubc9; calorie restriction; energy metabolism; lifespan.


Conflict of interest statement

Conflict of interest The author declares no conflict of interest.

Figures

Figure 1
Figure 1. Changes in gene expression profiles in ulp2Δ cells during passaging.
a, Scheme for the creation of nascent ulp2Δ cells and subsequent laboratory evolution steps. The ulp2Δ cells containing YCplac33-ULP2(MHY1379) were sequentially streaked on SD + FOA plates twice to evict the YCplac33-ULP2 plasmid and then transformed with either YCplac33 orYCplac33-ULP2. Cells grew for ~50 generations (G) during these procedures. The cells were grown until saturation, then diluted 1:120 in fresh YPD (6.9 generations per dilution) for long-term passaging. This process was repeated daily for 65 days (~500G), which corrected the growth defects of ulp2Δ cells. b,c, Venn diagram and Gene Ontology (GO) enrichment analysis of genes with significantly decreased (<2-fold, b) or increased (>2-fold, c) expression in nascent (low passage) ulp2D, ulp2D 500G (Uba2C162S), and ulp2D 500G (Uba2C162S, A414P), compared to WT strain MHY1379 (ulp2Δ + YCplac33-ULP2). Bars indicate the fold-enrichment of each GO biological process in PANTHER (http://pantherdb.org/). The genes used for GO analysis are listed in Supplementary Data 1. d, Schematic summary of the expression changes in ulp2D 500G (Uba2C162S) compared to nascent ulp2Δ cells depicted in b and c. e, Mutations in ulp2D 500G (Uba2C162S) and ulp2D 500G (Uba2C162S, A414P). Missense or silent represents alteration of amino acids by point mutation or not, respectively.
Figure 2
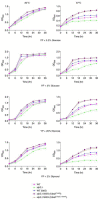
Figure 2. Growth rates of high-passage ulp2Δ cells exceed WT rates.
Cells of the indicated strains pregrown in yeast extract-peptone-dextrose (YPD; 2% glucose) at 30°C were adjusted to an optical density (OD)600 value of 0.1, then cultured in YP with 0.2%, 2%, or 20% glucose or 2% glycerol at either 30°C or 37°C. Growth curves were derived from OD600 measurements every 6 h for 36 h.
Figure 3
Figure 3. Replicated lifespan (RLS) is extended in evolved ulp2Δ cells.
a-f, RLS analysis of indicated strains (a-e) and uba2Δ ulp2Δ cells with indicated plasmids (f). RLS was measured on yeast extract-peptone-dextrose (YPD) (a-d, f) and YPD supplemented with 3 jjg/mL Antimycin A (e), respectively. Rho0 represents cells lacking mitochondrial DNA. The RLS means are shown in parentheses. Asterisks indicate statistically significant differences (*P < 0.05; **P < 0.01; *** P < 0.001; ****P < 0.0001; Wilcoxon Rank Sum Test).
Figure 4
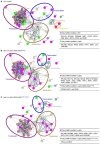
Figure 4. Analysis of SUMO-modified proteins in evolved ulp2Δ cells.
a-c, Sumoylated proteins were purified under denaturing conditions from the wild-type (WT), ulp2D, ulp2D 500G (Uba2C162S), and ulp2D 500G (Uba2C162S) cells expressing 6His-FLAG–tagged SUMO and were identified via mass spectrometry. Sumoylated proteins were compared between the indicated groups (a, WT and ulp2D, b, ulp2D and ulp2D 500G (Uba2C162S); and c, ulp2D and ulp2D 500G (Uba2C162S, A414P)). The protein interaction network was constructed via STRING (https://string-db.org/). Each node and distance between the nodes indicate identified proteins and their relatedness, respectively. Magenta and green circles denote the SUMO-modified proteins in each strain only. Violet, blue, brown, gray, and yellow open circles indicate proteins involved in translation, transcription, metabolism, sumoylation, and cytokinesis, respectively.
Figure 5
Figure 5. Auto-sumoylation of Ubc9 is enhanced in ulp2D500G (Uba2C162S) cells.
a, Immunoprecipitation (IP) of Ubc9-FLAG with anti-FLAG agarose from denatured yeast extracts in the indicated strains expressing FLAG-tagged Ubc9 followed by immunoblot analysis with anti-SUMO or anti-FLAG antibodies. Anti-Pgk1 was used as a loading control for protein input. Arrowheads, open circles, and asterisks indicate sumoylated Ubc9, unsumoylated Ubc9, and nonspecific bands, respectively, b, Growth of the ubc9-K153/157R (ubc9-RR) mutants from two different strain backgrounds (W303 and MHY500). After spotting cells in five-fold serial dilutions, the YPD plates were incubated for 2 days at 30°C. c,f,g, Immunoblot assay of sumoylated proteins in extracts prepared from the indicated strains. The plus and minus symbols represent the presence and absence of YCplac33-ULP2 in the indicated uba2, ubc9, and ulp2 mutants, respectively. Anti-Pgk1 blotting was used to verify equal loading. The stacking gel (bracket) and molecular size standards are indicated. d,e,h, RLS analysis of indicated strains, as shown in Fig. 3a.
Figure 6
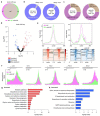
Figure 6. Ubc9 auto-sumoylation-associated changes in the genome-wide pattern of SUMO enrichment.
a, Venn diagram showing overlapping ChIP-seq peaks of HF-Smt3 (SUMO) in wild-type (WT; magenta) and ubc9-RR (green) strains. The ChIP-seq data were obtained from duplicate samples. b,c, Pie chart depicting the distribution of HF-Smt3 peaks at promoter and other regions (b) and ORF and ncRNA loci (c) in a. The number in the parentheses indicates the number of identified peaks and their percentages, d, Volcano plots displaying the distinct HF-Smt3 peaks in a. The y-axis is the mean of the negative logarithm of FDR-corrected P-values. The x-axis corresponds the log2 fold change value. Red and blue dots denote the significantly increased and decreased peaks in ubc9-RR, respectively, compared to the WT. e, ChIP read-density plot for levels of HF-Smt3 from the significantly increased (left panel) and decreased (right panel) peaks in ubc9-RR in d. A ±3 kb window relative to the center of the peaks is shown. Bottom panels indicate heatmaps of SUMO occupancy in WT and ubc9-RR. f, Representative data in a. The y-axis shows fold enrichment normalized to the input DNA. Gray arrows and boxes with gene names indicate locations of ORFs. g,h, KEGG analysis of the significantly increased (g) and decreased (h) peaks displayed in d. Bar diagrams indicate the fold-enrichment in each pathway in DAVID (https://david.ncifcrf.gov/).
Figure 7
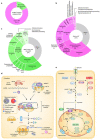
Figure 7. Auto-sumoylation of Ubc9 is required for the regulation of sumoylation of factors involved in translation and energy metabolism.
a, Pie chart showing the distribution of SUMO-modified proteins in only wild-type (WT; magenta) and in both WT and ubc9-RR (green). SUMO-modified proteins were identified via mass spectrometry, as shown in Fig. 4a. b,c, KEGG analysis of SUMO-modified proteins in only WT (b) and in both WT and ubc9-RR(c) displayed in a, as shown in Fig. 6g. Numbers indicate the number of proteins identified in each pathway. d,e, Schematic diagram showing the list of Ubc9 auto-sumoylation-governed targets in the translation (d) and energy metabolism (e) pathways. Proteins in the two pathways depicted in b and care marked as red and blue colors, respectively. Solid and dashed arrows denote the direction of fluxes and pathways in which intermediate molecules are not depicted, respectively. Metabolites in metabolic reactions are represented as yellow hexagons. The pie graph within d shows the distribution of SUMO targets among ribosomal subunits and are classified by the indicated groups. PPP: pentose phosphate pathway; DHAP: dihydroxyacetone phosphate; PDH complex: pyruvate dehydrogenase complex; Ac-CoA: Acetyl-CoA; OAA: oxaloacetate; ETC: electron transport chain.
Figure 8
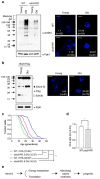
Figure 8. Level of Ubc9 auto-sumoylation is increased in old-aged cells.
a,b, Immunoblot assay of sumoylated proteins (a) and Ubc9-FLAG (b) after old cell sorting in the indicated young and old cells, as shown in Fig. 5a. Calcofluor staining images of young and old cells are shown on the right. The number outside of and within the parentheses represents the average number of bud scars (i.e., the replicative age) and the number of cells measured for counting, respectively. Scale bar: 5 μm c, RLS analysis of the indicated strains on the SC plates supplemented with 2.0% or 0.5% glucose, as shown in Fig. 3a. d, Quantification of RLS ratio of 0.5% to 2.0% in c and Extended Data Fig. 6. The error bars represent the SD from three independent experiments. Asterisks indicate statistically significant differences (*P< 0.05, two-tailed Student’s t-test). e, Schematic diagram depicting the role of Ubc9 auto-sumoylation in longevity.

Similar articles

References

    1. MacColl A. D. The ecological causes of evolution. Trends Ecol Evol 26, 514–522, doi:10.1016/j.tree.2011.06.009 (2011). - DOI - PubMed
    1. Ryu H. Y., Ahn S. H. & Hochstrasser M. SUMO and cellular adaptive mechanisms. Experimental and Molecular Medicine 52, 931–939, doi:10.1038/s12276-020-0457-2 (2020). - DOI - PMC - PubMed
    1. Fulda S., Gorman A. M., Hori O. & Samali A. Cellular stress responses: cell survival and cell death. Int J Cell Biol 2010, 214074, doi:10.1155/2010/214074 (2010). - DOI - PMC - PubMed
    1. Mans R., Daran J. M. G. & Pronk J. T. Under pressure: evolutionary engineering of yeast strains for improved performance in fuels and chemicals production. Current Opinion in Biotechnology 50,47–56, doi:10.1016/j.copbio.2017.10.011 (2018). - DOI - PubMed
    1. Enserink J. M. Sumo and the cellular stress response. Cell Div 10,4, doi:10.1186/s13008-015-0010-1 (2015). - DOI - PMC - PubMed

Publication types

LinkOut - more resources