Regulation of CTLs/Tregs via Highly Stable and Ultrasound-Responsive Cerasomal Nano-Modulators for Enhanced Colorectal Cancer Immunotherapy
- PMID: 38552151
- PMCID: PMC11165532
- DOI: 10.1002/advs.202400485
Regulation of CTLs/Tregs via Highly Stable and Ultrasound-Responsive Cerasomal Nano-Modulators for Enhanced Colorectal Cancer Immunotherapy
Abstract
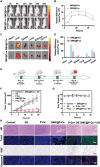
Immunotherapy is showing good potential for colorectal cancer therapy, however, low responsive rates and severe immune-related drug side effects still hamper its therapeutic effectiveness. Herein, a highly stable cerasomal nano-modulator (DMC@P-Cs) with ultrasound (US)-controlled drug delivery capability for selective sonodynamic-immunotherapy is fabricated. DMC@P-Cs' lipid bilayer is self-assembled from cerasome-forming lipid (CFL), pyrophaeophorbid conjugated lipid (PL), and phospholipids containing unsaturated chemical bonds (DOPC), resulting in US-responsive lipid shell. Demethylcantharidin (DMC) as an immunotherapy adjuvant is loaded in the hydrophilic core of DMC@P-Cs. With US irradiation, reactive oxygen species (ROS) can be effectively generated from DMC@P-Cs, which can not only kill tumor cells for inducing immunogenic cell death (ICD), but also oxidize unsaturated phospholipids-DOPC to change the permeability of the lipid bilayers and facilitate controlled release of DMC, thus resulting in down-regulation of regulatory T cells (Tregs) and amplification of anti-tumor immune responses. After intravenous injection, DMC@P-Cs can efficiently accumulate at the tumor site, and local US treatment resulted in 94.73% tumor inhibition rate. In addition, there is no detectable systemic toxicity. Therefore, this study provides a highly stable and US-controllable smart delivery system to achieve synergistical sonodynamic-immunotherapy for enhanced colorectal cancer therapy.
Keywords: cerasomes; immunoregulation; immunotherapy; sonodynamic therapy; ultrasound‐responsive.
© 2024 The Authors. Advanced Science published by Wiley‐VCH GmbH.
Conflict of interest statement
The authors declare no conflict of interest.
Figures


Similar articles
-
Bubble-Manipulated Local Drug Release from a Smart Thermosensitive Cerasome for Dual-Mode Imaging Guided Tumor Chemo-Photothermal Therapy.Theranostics. 2019 Oct 18;9(26):8138-8154. doi: 10.7150/thno.36762. eCollection 2019. Theranostics. 2019. PMID: 31754386 Free PMC article.
-
Mitochondria-targeted and ultrasound-responsive nanoparticles for oxygen and nitric oxide codelivery to reverse immunosuppression and enhance sonodynamic therapy for immune activation.Theranostics. 2021 Jul 25;11(17):8587-8604. doi: 10.7150/thno.62572. eCollection 2021. Theranostics. 2021. PMID: 34373760 Free PMC article.
-
Gene augmented nuclear-targeting sonodynamic therapy via Nrf2 pathway-based redox balance adjustment boosts peptide-based anti-PD-L1 therapy on colorectal cancer.J Nanobiotechnology. 2021 Oct 29;19(1):347. doi: 10.1186/s12951-021-01094-x. J Nanobiotechnology. 2021. PMID: 34715867 Free PMC article.
-
T-cell immunoglobulin and ITIM domain, as a potential immune checkpoint target for immunotherapy of colorectal cancer.IUBMB Life. 2021 May;73(5):726-738. doi: 10.1002/iub.2461. Epub 2021 Mar 30. IUBMB Life. 2021. PMID: 33686787 Review.
-
Boosting immune system against cancer by melatonin: A mechanistic viewpoint.Life Sci. 2019 Dec 1;238:116960. doi: 10.1016/j.lfs.2019.116960. Epub 2019 Oct 17. Life Sci. 2019. PMID: 31629760 Review.
Cited by
-
Biopolymer-Based Nanomedicine for Cancer Therapy: Opportunities and Challenges.Int J Nanomedicine. 2024 Jul 22;19:7415-7471. doi: 10.2147/IJN.S460047. eCollection 2024. Int J Nanomedicine. 2024. PMID: 39071502 Free PMC article. Review.
References
-
- a) Pardoll D. M., Nat. Rev. Cancer 2012, 12, 252; - PMC - PubMed
- b) Schreiber R. D., Old L. J., Smyth M. J., Science 2011, 331, 1565; - PubMed
- c) Luo M., Wang H., Wang Z., Cai H., Lu Z., Li Y., Du M., Huang G., Wang C., Chen X., Porembka M. R., Lea J., Frankel A. E., Fu Y.‐X., Chen Z. J., Gao J., Nat. Nanotechnol. 2017, 12, 648. - PMC - PubMed
-
- a) Tumeh P. C., Harview C. L., Yearley J. H., Shintaku I. P., Taylor E. J. M., Robert L., Chmielowski B., Spasic M., Henry G., Ciobanu V., West A. N., Carmona M., Kivork C., Seja E., Cherry G., Gutierrez A. J., Grogan T. R., Mateus C., Tomasic G., Glaspy J. A., Emerson R. O., Robins H., Pierce R. H., Elashoff D. A., Robert C., Ribas A., Nature 2014, 515, 568; - PMC - PubMed
- b) Herbst R. S., Soria J.‐C., Kowanetz M., Fine G. D., Hamid O., Gordon M. S., Sosman J. A., McDermott D. F., Powderly J. D., Gettinger S. N., Kohrt H. E. K., Horn L., Lawrence D. P., Rost S., Leabman M., Xiao Y., Mokatrin A., Koeppen H., Hegde P. S., Mellman I., Chen D. S., Hodi F. S., Nature 2014, 515, 563. - PMC - PubMed
-
- Goldberg M. S., Nat. Rev. Cancer 2019, 19, 587. - PubMed
MeSH terms
Substances
Grants and funding
LinkOut - more resources
Full Text Sources
Medical
