. 2024 Mar 11;27(4):109486.
doi: 10.1016/j.isci.2024.109486. eCollection 2024 Apr 19.

TNFR1 mediates heterogeneity in single-cell NF-κB activation

Affiliations

TNFR1 mediates heterogeneity in single-cell NF-κB activation

Chieh-Teng Cheng et al. iScience. .

Abstract

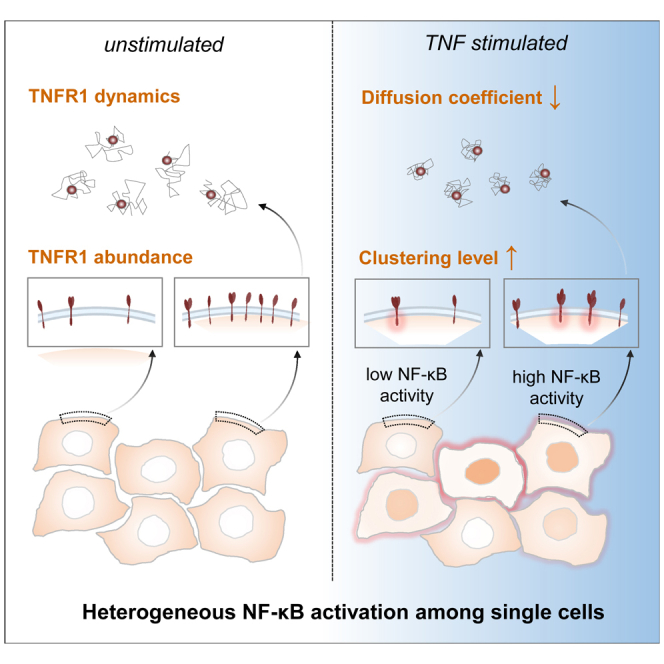
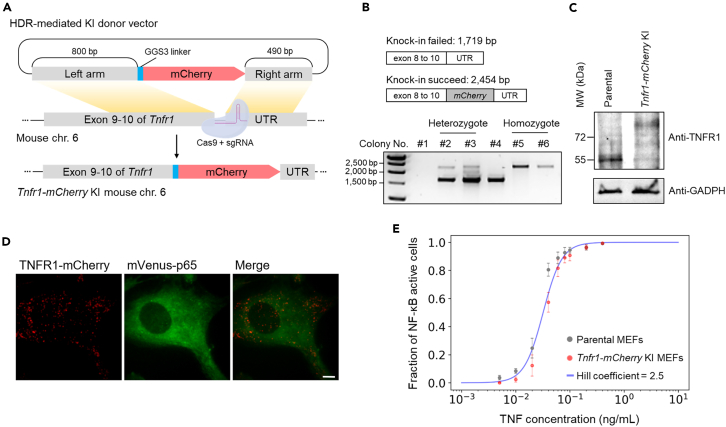
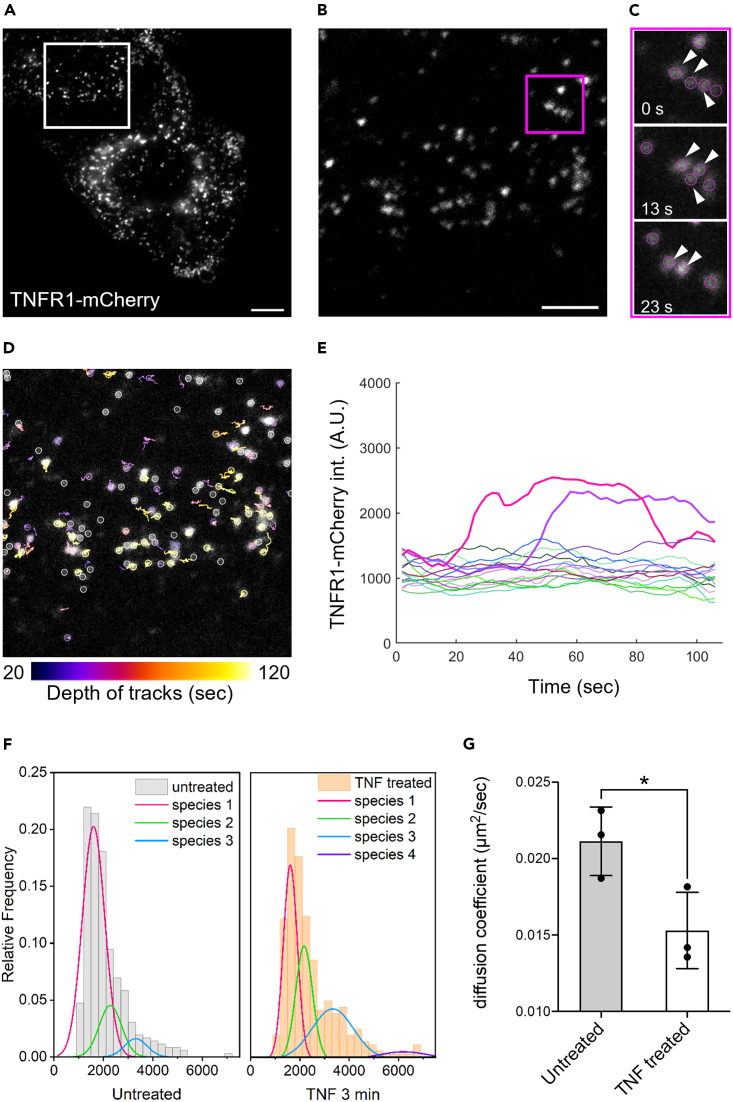
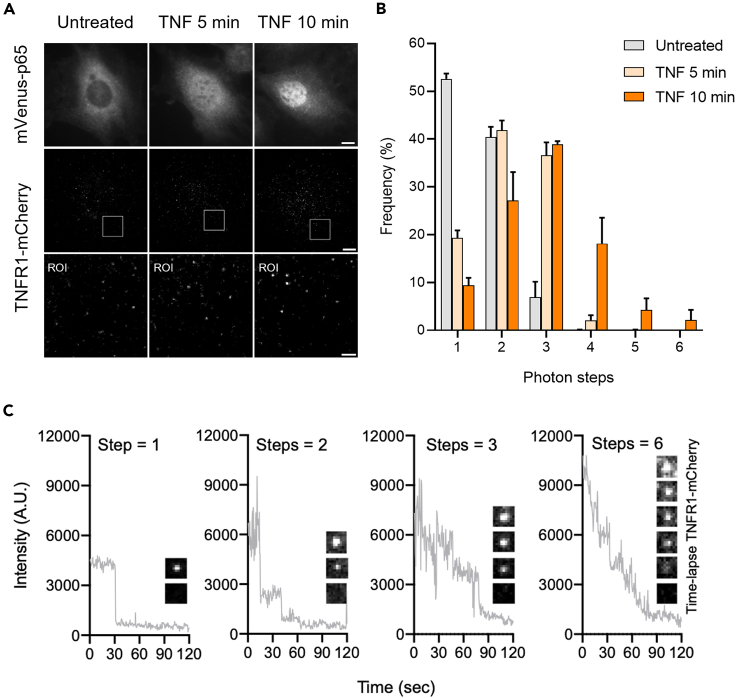
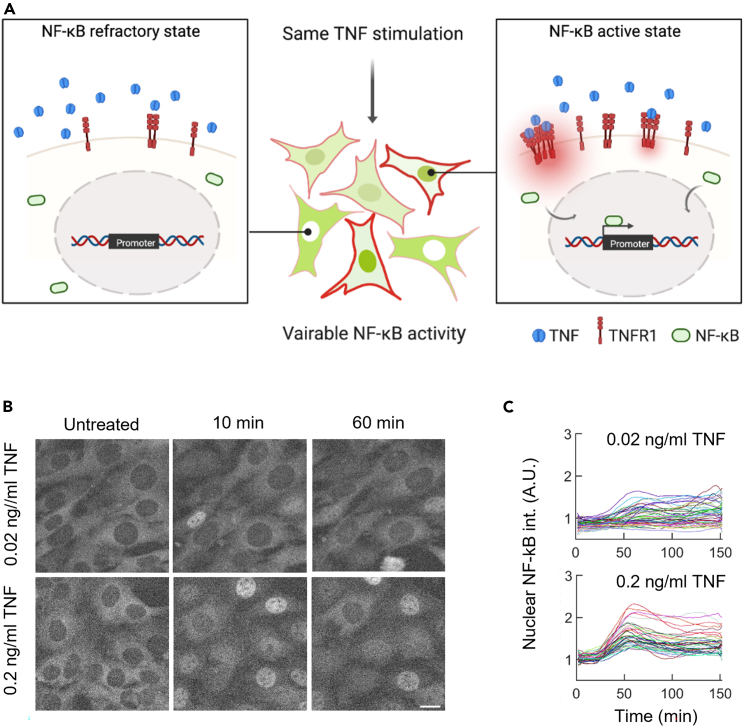
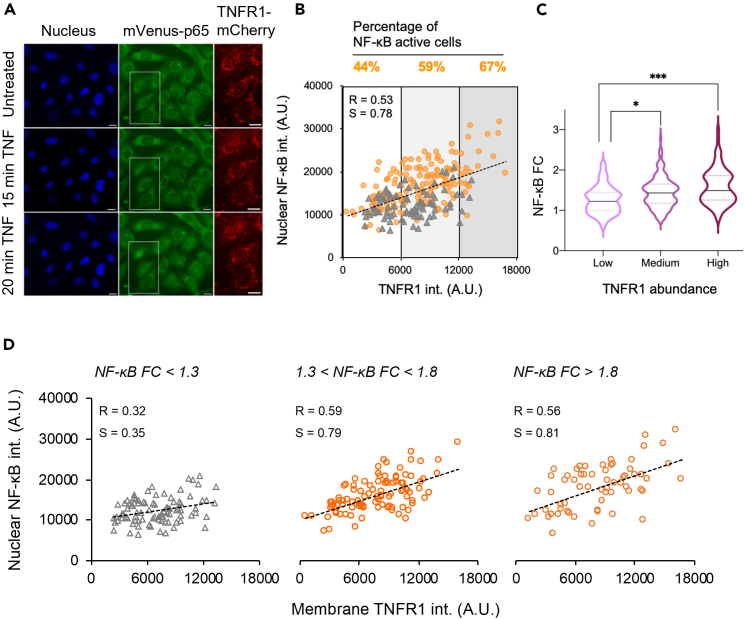
Nuclear factor kappa B (NF-κB) is a key regulator in immune signaling and is known to exhibit a digital activation pattern. Yet the molecular basis underlying the heterogeneity in NF-κB activation at single-cell level is not entirely understood. Here, we show that NF-κB activation in single cells is largely regulated by intrinsic differences at the receptor level. Using the genome editing and time-lapse imaging, we directly characterize endogenous TNFR1 dynamics and NF-κB activation from the same single cells. Total internal reflection fluorescence (TIRF) microscopy shows that endogenous TNFR1 forms pre-ligand clusters in the resting cells. Upon tumor necrosis factor (TNF) stimulation, the diffusion coefficient of membrane TNFR1 was significantly decreased and a substantial level of TNFR1 undergoes oligomerization to form trimers and hexamers. Moreover, multi-color cell imaging reveals that both digital and graded information processing regulate NF-κB activation across different TNFR1 expression levels. Our results indicate that single-cell NF-κB activation potential strongly correlates with its TNFR1 characteristics.

Keywords: Biological sciences; Cell biology; Molecular biology.


Conflict of interest statement

The authors declare no competing interests.

Figures

None
Graphical abstract
Figure 1
Figure 1
Generation of the double KI MEFs expressing endogenous Tnfr1-mCherry and mVenus-p65 via CRISPR mediated genome editing (A) A schematic diagram of the KI plasmid design for CRISPR/cas9-mediated fluorescent tagging of Tnfr1-mCherry into MEF cells stably expressing mVenus-p65. Top row: the HDR donor vector containing mCherry, left (800 bp), and right (490 bp) homologous arms targeting to the Tnfr1 locus of M. musculus. Bottom: The mCherry KI site was next to the stop codon of Tnfr1 at exon 10. (B) Genotyping of selected single cell colonies. The primers were designed to target the Tnfr1 sequence from exon 8 to UTR. The signal of colonies with successful mCherry integration was shown at 2,454 bp. All homozygous Tnfr1-mCherry KI colonies were confirmed by Sanger sequencing. (C) The western blot analysis of cell lysates from the parental and Tnfr1-mCherry KI cells. GADPH was used as loading controls. (D) Fluorescent images of endogenous TNFR1-mCherry and mVenus-p65 in the double KI MEFs. Scale bar, 10 μm. (E) The fraction of NF-κB active cells across different concentrations of TNF-α stimulations. The dose-response curve is fitted by a Hill function with Hill coefficient n = 2.5 and K = 0.035 ng/mL. Data points represent means ± SEM (n = 3 independent experiments). See also Figure S1.
Figure 2
Figure 2
The membrane distribution of TNFR1 in MEF cells at the resting state and upon TNR-α stimulation (A) A TIRF image showing the TNFR1-mCherry distribution on the cell membrane. Scale bar, 10 μm. (B) A magnified view of the ROI shown in (A). Scale bar, 5 μm. (C) Zoom-in images of the ROI shown in (B). The time-lapse images reveal a merging event of TNFR1-mCherry. The magenta circles highlight the tracked TNFR1 and white arrows were used to mark TNFR1 that formed oligomer. (D) Single particle analysis showing the temporal depth of trajectories (different colored circles and lines) for TNFR1-mCherry spots in 2 min. Gray circles represent eliminated objects due to insufficient tracking depth. Scale bar, 5 μm. (E) Representative intensity trajectories showing the dynamics of TNFR1-mCherry spots on the cell membrane. The bolded lines show TNFR1 undergoing oligomerization. The data are representative of at least three cells. (F) The intensity distribution of TNFR1-mCherry of the untreated (left) and TNF-α stimulated (right) cells. Each group contains ≥350 trajectories of TNFR1-mCherry spots. The data are representative of at least three cells. See also Figures S2 and S3. (G) The mean diffusion coefficient of TNFR1-mCherry in the untreated and TNF-α stimulated cells from three independent experiments (∗p < 0.05 by one-way ANOVA). Each experiment contains >250 tracked TNFR1 spots.
Figure 3
Figure 3
TNFR1 forms higher-order clusters upon TNF-α stimulation in MEF cells (A) Representative epi-fluorescence and TIRF images of the untreated and TNF-α stimulated cells showing the distribution of mVenus-p65 and TNFR1-mCherry in the fixed MEF cell. Scale bar is 10 μm in the top and middle panel, and 2 μm in the bottom panel. (B) Photobleaching step analysis showing the distribution of TNFR1-mCherry clusters in the untreated and TNF-α stimulated (5 and 10 min) cells from three independent experiments. (C) Representative intensity traces and images of TNFR1-mCherry exhibiting 1, 2, 3, and 6 photobleaching step events.
Figure 4
Figure 4
NF-κB activation exhibits a high level of cellular heterogeneity upon TNF-α stimulations (A) An illustration showing how TNFR1 may be one of molecular contributors for the heterogeneous NF-κB activity at single-cell level when receiving identical cytokine input. (B) Time-lapse images showing the nuclear translocation of mVenus-p65 upon TNF-α stimulation in MEF cells at 2 different concentrations. Scale bar, 20 μm. (C) Trajectories of single-cell nuclear NF-κB intensity at 2 TNF-α concentrations.
Figure 5
Figure 5
Quantitative analysis reveals the combination of digital and graded patterns in single-cell NF-κB activation among different TNFR1 abundances (A) Multi-color time-lapse images of the nucleus, NF-κB and TNFR1 in MEF cells upon receiving the TNF-α input. The Hoechst dye was used as a nucleus marker. Scale bar: 20 μm for nucleus and mVenus-p65 images and 10 μm for the TNFR1-mCherry channel. (B) A plot showing the single-cell nuclear NF-κB intensity as a function of TNFR1 abundances measured in MEF cells upon 0.03 ng/mL TNF-α stimulation. NF-κB inactive and activated cells were marked in gray triangle and orange circle respectively. The percentage of NF-κB activated cells were shown on the top. Cells were binned into three populations based on their TNFR1 abundances. R represents the Pearson correlation coefficient. (C) The violin plot showing the fold-change (FC) of nuclear NF-κB intensity across the graded TNFR1 abundances in single cells (∗p < 0.05 and ∗∗∗p < 0.001 by one-way ANOVA) from three independent experiments. The black line represents median while dash line represents quartile. (D) Data points from (B) were separated by the FC of nuclear NF-κB intensity. Cells exhibiting FC < 1.3 were assumed to be inactive while those with FC > 1.8 were highly active cells. See also Figure S6.

Similar articles

References

    1. Delves P.J., Roitt I.M. The immune system. First of two parts. N. Engl. J. Med. 2000;343:37–49. doi: 10.1056/NEJM200007063430107. - DOI - PubMed
    1. Hoffmann A., Levchenko A., Scott M.L., Baltimore D. The IkappaB-NF-kappaB signaling module: temporal control and selective gene activation. Science. 2002;298:1241–1245. doi: 10.1126/science.1071914. - DOI - PubMed
    1. Kawai T., Akira S. Signaling to NF-kappaB by Toll-like receptors. Trends Mol. Med. 2007;13:460–469. doi: 10.1016/j.molmed.2007.09.002. - DOI - PubMed
    1. Nelson D.E., Ihekwaba A.E.C., Elliott M., Johnson J.R., Gibney C.A., Foreman B.E., Nelson G., See V., Horton C.A., Spiller D.G., et al. Oscillations in NF-kappaB signaling control the dynamics of gene expression. Science. 2004;306:704–708. doi: 10.1126/science.1099962. - DOI - PubMed
    1. Parameswaran N., Patial S. Tumor necrosis factor-alpha signaling in macrophages. Crit. Rev. Eukaryot. Gene Expr. 2010;20:87–103. doi: 10.1615/critreveukargeneexpr.v20.i2.10. - DOI - PMC - PubMed