. 2024 Mar 29;10(13):eadi4310.
doi: 10.1126/sciadv.adi4310. Epub 2024 Mar 27.

Lupus susceptibility gene Pbx1 controls the development, stability, and function of regulatory T cells via Rtkn2 expression

Affiliations

Lupus susceptibility gene Pbx1 controls the development, stability, and function of regulatory T cells via Rtkn2 expression

Seung-Chul Choi et al. Sci Adv. .

Abstract

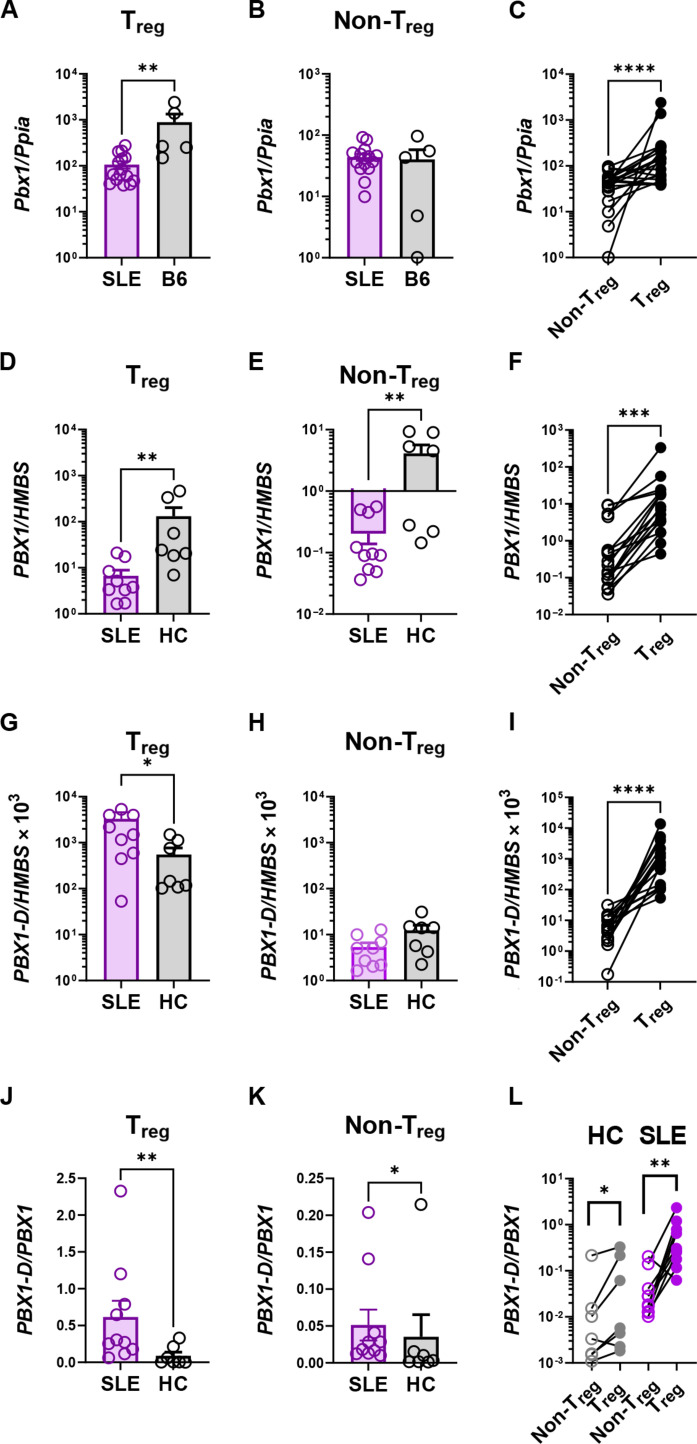
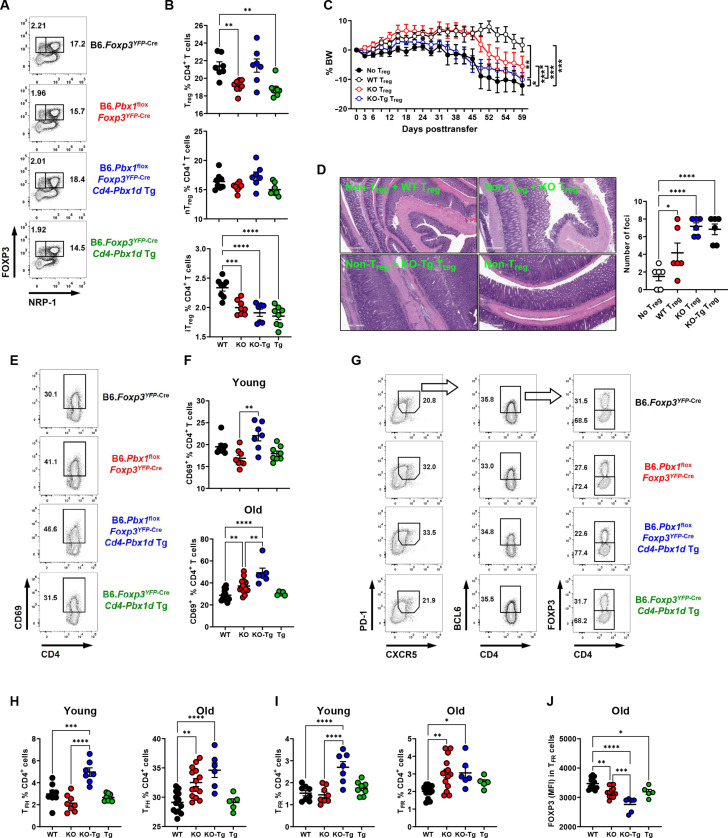
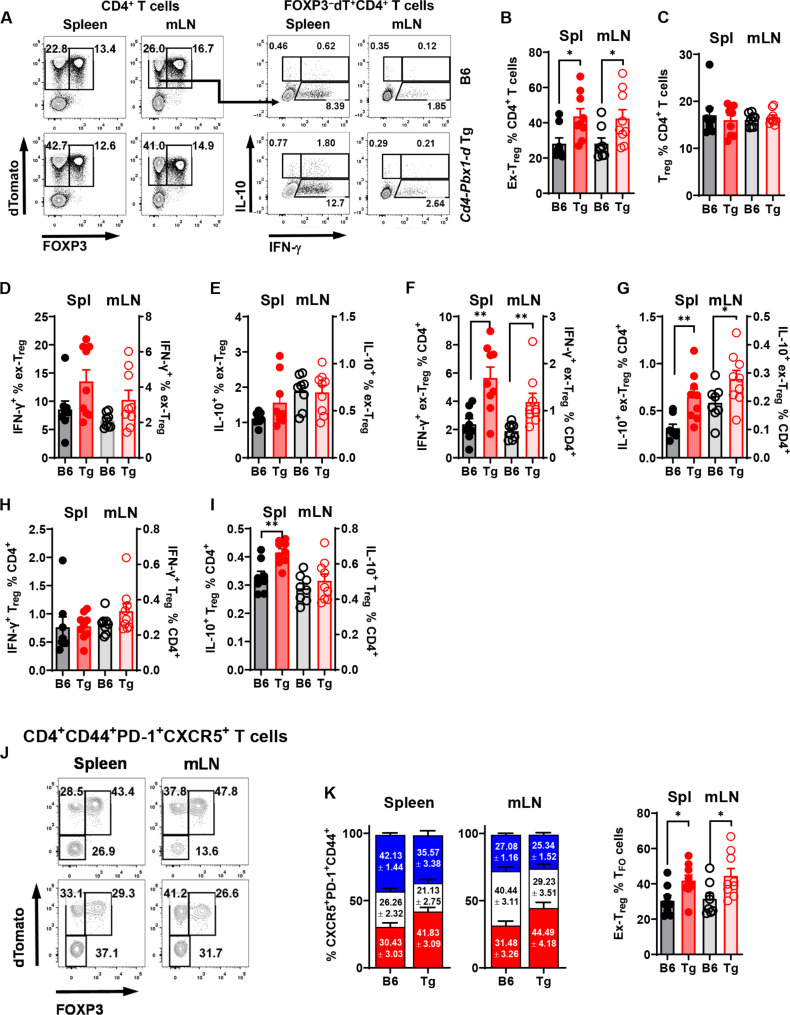
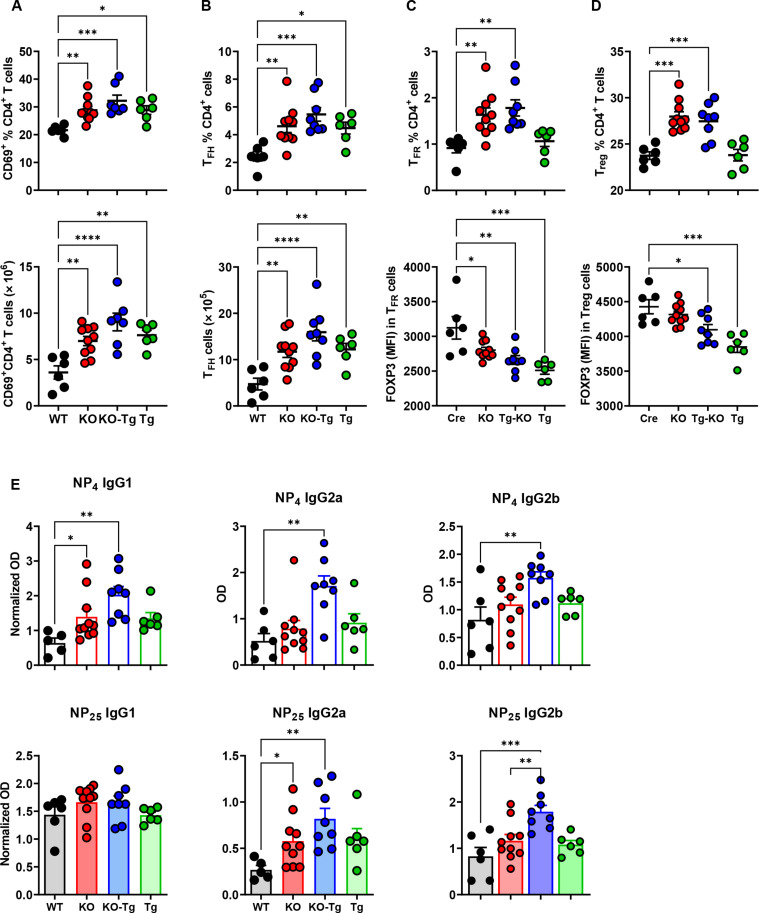
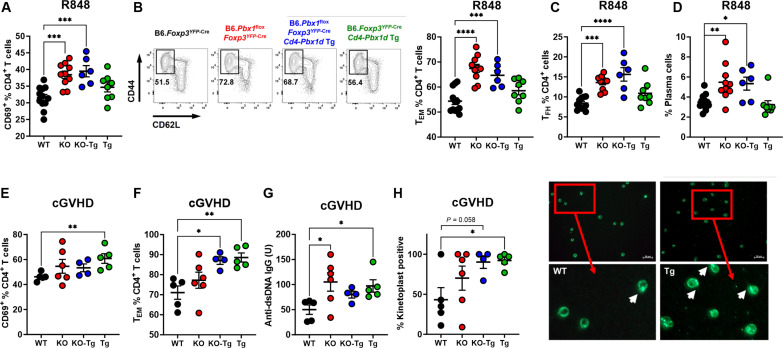
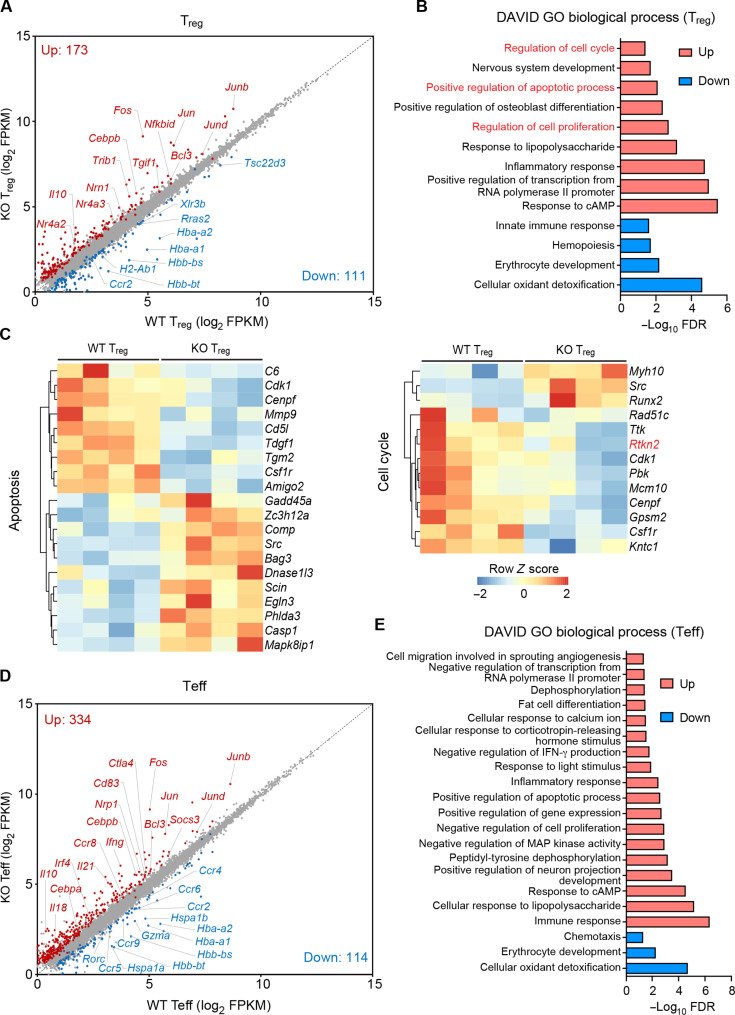
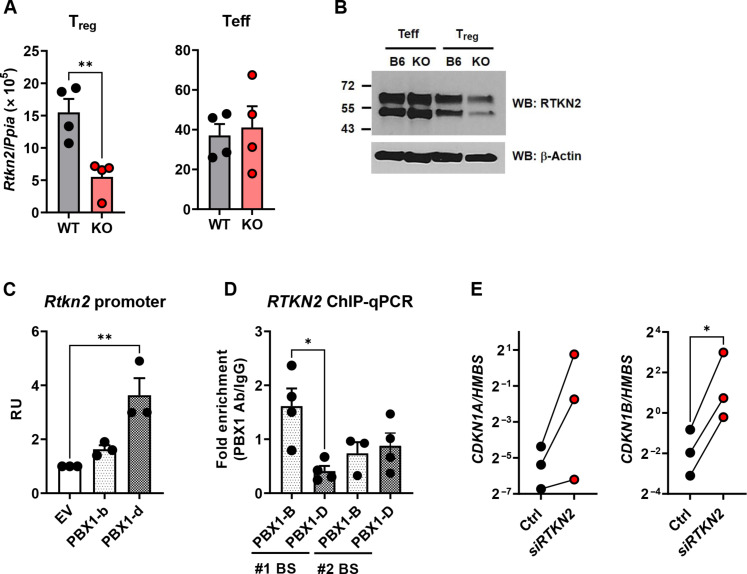
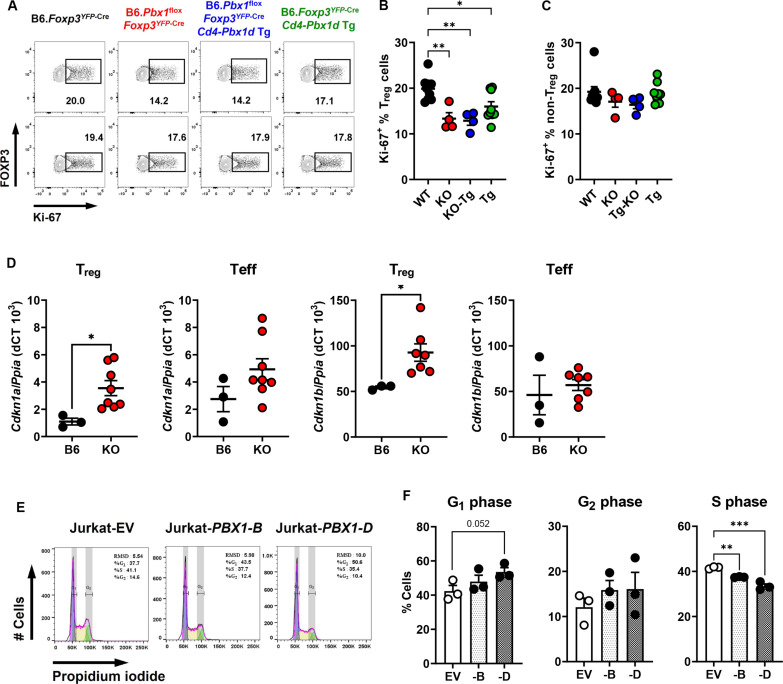
The maintenance of regulatory T (Treg) cells critically prevents autoimmunity. Pre-B cell leukemia transcription factor 1 (Pbx1) variants are associated with lupus susceptibility, particularly through the expression of a dominant negative isoform Pbx1-d in CD4+ T cells. Pbx1-d overexpression impaired Treg cell homeostasis and promoted inflammatory CD4+ T cells. Here, we showed a high expression of Pbx1 in human and murine Treg cells, which is decreased in lupus patients and mice. Pbx1 deficiency or Pbx1-d overexpression reduced the number, stability, and suppressive activity of Treg cells, which increased murine responses to immunization and autoimmune induction. Mechanistically, Pbx1 deficiency altered the expression of genes implicated in cell cycle and apoptosis in Treg cells. Intriguingly, Rtkn2, a Rho-GTPase previously associated with Treg homeostasis, was directly transactivated by Pbx1. Our results suggest that the maintenance of Treg cell homeostasis and stability by Pbx1 through cell cycle progression prevent the expansion of inflammatory T cells that otherwise exacerbates lupus progression in the hosts.


Figures

Fig. 1.
Fig. 1.. PBX1 is preferentially expressed in Treg cells.
(A to C) Pbx1 expression in murine Treg (A) and non-Treg T (B) cells from B6 and the combination of three lupus-prone strains (SLE: TC, BWF1, and BXSB.Yaa). (C) Paired analysis between Treg and non-Treg cells for all strains combined (N = 5 per strain). (D to I) PBX1 (D to F) and PBX1-D [(G) to (I)] expression in human Treg [(D) and (G)] and non-Treg (E and H) T cells from patients with SLE (N = 10) and HCs (N = 7). (F) and (I) Paired analysis between Treg and non-Treg cells for all human samples combined. (J to L) PBX1-D/PBX1 ratios corresponding to the human T cells shown in (D) to (I). Mean + SEM compared with Mann-Whitney tests or paired t tests. *P < 0.05, **P < 0.01, ***P < 0.001, and ****P < 0.0001.
Fig. 2.
Fig. 2.. Pbx1 deletion or Pbx1-d sole expression decreased the peripheral Treg cell population and their suppressive function.
(A and B) Representative FACS plots (A) and frequency (B) of total splenic Treg cells, CD4+FOXP3+NRP-1+ nTreg cells, and CD4+FOXP3+NRP-1 iTreg cells. (C and D) WT non-Treg cells were transferred into B6.Rag-1−/− mice without or with Treg cells from WT, KO, or KO-Tg mice. (C) Changes in body weight (BW) after transfer. (D) Representative histopathology of hematoxylin and eosin–stained colons (original magnification: ×60, scale bar: 200 μm) for the four groups and corresponding number of foci. (E and F) Representative fluorescence-activated cell sorting(FACS) plots and frequency of splenic CD69+CD4+ T cells. (G to J) Representative FACS plots and frequency of splenic CD4+CXCXR5+PD1+BCL6+FOXP3 TFH (H), CD4+CXCXR5+PD1+BCL6+FOXP3+ TFR cells (I) in CD4+ T cells, and FOXP3 MFI in TFR cells (J). Mean ± SEM of N = 5 to 14 3-month-old [graphs in (B) and young] mice and 8- to 10-month-old (old) mice compared with Dunnett’s multiple comparisons tests. (C) and (D) Mean + SEM of N = 6 mice per group compared with two-way analysis of variance (ANOVA) (C) or Dunnett’s multiple comparisons tests (D). *P < 0.05, **P < 0.01, ***P < 0.001, and ****P < 0.0001. PD-1, Programmed cell death protein 1.
Fig. 3.
Fig. 3.. Pbx1-d expression promotes Treg instability.
Representative FACS plots (A) and frequency of CD4+dTomato+FOXP3 ex-Treg cells and CD4+dTomato+FOXP3+ Treg cells analyzed in CD4+ T cells (B and C) in the spleen and mLN from 3-month-old B6.R26RRFP and Tg.R26RRFP mice. Frequency of IFN-γ+ (D) and IL-10+ (E) cells in ex-Treg cells. Frequency of IFN-γ+ ex-Treg (F) and IL-10+ ex-Treg (G) in CD4+ T cells. Frequency of IFN-γ+ Treg (H) and IL-10+ Treg (I) in CD4+ T cells. Representative FACS plots (J) and frequency of ex-Treg cells and Treg cells in CD4+CD44+PD-1+CXCR5+ follicular T (TFO) cells (K). The graphs on the left show distributions, and the graph on the right shows the comparison between ex-Treg cells. Mean + SEM of N = 8 to 9 mice per group compared with t tests. *P < 0.05 and **P < 0.01.
Fig. 4.
Fig. 4.. Tregcell–specific Pbx1 deletion or Pbx1-d sole expression enhanced TD-humoral response.
Mice were immunized with NP-KLH in alum, boosted 6 weeks later, and analyzed at week 7. (A and B) Frequency (top) and absolute number (bottom) of CD4+CD69+ cells (A) and TFH cells (B). (C and D) Frequency (top) and FOXP3 mean fluorescence intensity (MFI) (bottom) in TFR (C) and Treg (D) cells. (E) Serum levels of high-affinity anti-NP4 and low-affinity anti-NP25 IgG1, IgG2a, and IgG2b. Optical density (OD) values were normalized between three cohorts. Mean ± SEM of N = 5 to 10 mice per group performed in three cohorts, compared with Dunnett’s multiple comparisons tests. *P < 0.05, **P < 0.01, ***P < 0.001, and ****P < 0.0001.
Fig. 5.
Fig. 5.. Pbx1 deletion or Pbx1-d sole expression in Treg cells enhanced CD4+ T cell autoimmune responses.
(A to D) Mice were treated with R848 for 1 week and sacrificed at day 10. (A) Frequency of CD4+CD69+ cells. (B) Representative FACS plot and frequency of CD4+CD44+CD62L TEM cells. Frequency of TFH cells (C) and IgDCD138+ plasma cells (D). (E to H) cGVHD induced by transfer of B6.bm12 splenocytes into the four strains of recipient mice. Frequency of CD4+CD69+ cells (E) and TEM cells (F). Levels of anti-dsDNA IgG (G) and anti-kinetoplast IgG positive Crithidia cells (H). The representative images in (H) show a Crithidia assay for a WT and a Tg recipient mouse with the low power showing the entire well, with magnification of the boxed areas. Arrows indicate anti-kinetoplast IgG-positive cells. Mean ± SEM of N = 4 to 12 mice per group compared with Dunnett’s multiple comparisons tests. *P < 0.05, **P < 0.01, ***P < 0.001, and ****P < 0.0001.
Fig. 6.
Fig. 6.. Transcriptional regulation of Treg and Teff cells in mice with Pbx1-deficient Treg cells.
RNA-seq analysis was conducted on CD4+FOXP3+ Treg cells and CD4+CD44+FOXP3 Teff cells from WT and KO mice (N = 4). (A) Scatterplot of DEGs in Treg cells. (B) GO biological processes enriched in genes that were up-regulated (top) or down-regulated (bottom) in KO Treg cells. (C) Heatmap of DEGs in the apoptosis and cell cycle/proliferation pathways between WT and KO Treg cells. (D) Scatterplot of DEGs in Teff cells from WT and KO mice. (E) Database for Annotation, Visualization and Integrated Discovery Gene Ontology (DAVID GO) biological processes that were up-regulated or down-regulated in KO Teff cells compared to WT controls. cAMP, cyclic adenosine 3′,5′-monophosphate; MAP, mitogen-activated protein.
Fig. 7.
Fig. 7.. Pbx1 directly regulates Rtkn2 expression.
(A and B) Rtkn2 gene (A) and RTKN2 protein (B) expression in Treg and Teff cells. N = 4. (C) Dual-luciferase analysis of murine Rtkn2 expression in HEK293T cells in the presence of PBX1-B or PBX1-D, showing fold change relative to the control expression plasmid [empty vector (EV)]. (D) ChIP-qPCR analysis of the human RTKN2 promoter in PBX1-B or PBX1-D overexpressing Jurkat T cells. Results are shown relative to the IgG control. N = 3 to 4. (E) CDKN1A and CDKN1B expression normalized to HMBS in Jurkat T cells treated with siRTKN2 or si control. N = 3. Mean + SEM compared with t tests *P < 0.05 and **P < 0.01. Ab, antibody. WB, Western blot; RU, relative unit; BS, binding site.
Fig. 8.
Fig. 8.. Pbx1 regulates cell proliferation in Treg cells.
Representative FACS plot (A) and frequency of Ki-67+ cells in Treg (B) and non-Treg (C) cells from WT, KO, KO-Tg, or Tg mice. Mean ± SEM of N = 4 to 9 3-month-old mice per group compared with Dunnett’s multiple comparison tests. (D) Cdkn1a and Cdkn1b expression in Treg and Teff cells from WT and KO mice. Mean ± SEM of N = 3 to 8 3-month-old mice per strain compared with Mann-Whitney tests. Representative FACS histograms of propidium iodide staining relative to cell cycle phases (E) and corresponding frequency (F) in PBX1-B or PBX1-D overexpressing Jurkat T cells as compared to empty vector controls. Mean + SEM of N = 3 compared with t tests. *P < 0.05, **P < 0.01, and ***P < 0.001. RMSD, root mean square deviation.

Similar articles

Cited by

References

    1. Josefowicz S. Z., Lu L. F., Rudensky A. Y., Regulatory T cells: Mechanisms of differentiation and function. Annu. Rev. Immunol. 30, 531–564 (2012). - PMC - PubMed
    1. Wing K., Sakaguchi S., Regulatory T cells exert checks and balances on self tolerance and autoimmunity. Nat. Immunol. 11, 7–13 (2010). - PubMed
    1. Jordan M. S., Boesteanu A., Reed A. J., Petrone A. L., Holenbeck A. E., Lerman M. A., Naji A., Caton A. J., Thymic selection of CD4+CD25+ regulatory T cells induced by an agonist self-peptide. Nat. Immunol. 2, 301–306 (2001). - PubMed
    1. Morales-Nebreda L., McLafferty F. S., Singer B. D., DNA methylation as a transcriptional regulator of the immune system. Transl. Res. 204, 1–18 (2019). - PMC - PubMed
    1. Ohkura N., Hamaguchi M., Morikawa H., Sugimura K., Tanaka A., Ito Y., Osaki M., Tanaka Y., Yamashita R., Nakano N., Huehn J., Fehling H. J., Sparwasser T., Nakai K., Sakaguchi S., T cell receptor stimulation-induced epigenetic changes and Foxp3 expression are independent and complementary events required for Treg cell development. Immunity 37, 785–799 (2012). - PubMed

MeSH terms

Substances