Blood Markers Show Neural Consequences of LongCOVID-19
- PMID: 38534322
- PMCID: PMC10969290
- DOI: 10.3390/cells13060478
Blood Markers Show Neural Consequences of LongCOVID-19
Abstract
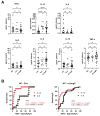
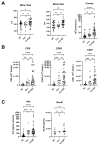
Severe acute respiratory syndrome coronavirus 2 (SARS-CoV-2) persists throughout the world with over 65 million registered cases of survivors with post-COVID-19 sequelae, also known as LongCOVID-19 (LongC). LongC survivors exhibit various symptoms that span multiple organ systems, including the nervous system. To search for neurological markers of LongC, we investigated the soluble biomolecules present in the plasma and the proteins associated with plasma neuronal-enriched extracellular vesicles (nEVs) in 33 LongC patients with neurological impairment (nLongC), 12 COVID-19 survivors without any LongC symptoms (Cov), and 28 pre-COVID-19 healthy controls (HC). COVID-19 positive participants were infected between 2020 and 2022, not hospitalized, and were vaccinated or unvaccinated before infection. IL-1β was significantly increased in both nLongC and Cov and IL-8 was elevated in only nLongC. Both brain-derived neurotrophic factor and cortisol were significantly elevated in nLongC and Cov compared to HC. nEVs from people with nLongC had significantly elevated protein markers of neuronal dysfunction, including amyloid beta 42, pTau181 and TDP-43. This study shows chronic peripheral inflammation with increased stress after COVID-19 infection. Additionally, differentially expressed nEV neurodegenerative proteins were identified in people recovering from COVID-19 regardless of persistent symptoms.
Keywords: BDNF; LongCOVID-19; blood markers; cognition; cortisol; neuronal extracellular vesicles.
Conflict of interest statement
The authors declare no conflicts of interest.
Figures


Similar articles
-
Microfluidic Isolation of Neuronal-Enriched Extracellular Vesicles Shows Distinct and Common Neurological Proteins in Long COVID, HIV Infection and Alzheimer's Disease.Int J Mol Sci. 2024 Mar 29;25(7):3830. doi: 10.3390/ijms25073830. Int J Mol Sci. 2024. PMID: 38612641 Free PMC article.
-
Erratum: Eyestalk Ablation to Increase Ovarian Maturation in Mud Crabs.J Vis Exp. 2023 May 26;(195). doi: 10.3791/6561. J Vis Exp. 2023. PMID: 37235796
-
Antibody tests for identification of current and past infection with SARS-CoV-2.Cochrane Database Syst Rev. 2022 Nov 17;11(11):CD013652. doi: 10.1002/14651858.CD013652.pub2. Cochrane Database Syst Rev. 2022. PMID: 36394900 Free PMC article. Review.
-
Accuracy of routine laboratory tests to predict mortality and deterioration to severe or critical COVID-19 in people with SARS-CoV-2.Cochrane Database Syst Rev. 2024 Aug 6;8(8):CD015050. doi: 10.1002/14651858.CD015050.pub2. Cochrane Database Syst Rev. 2024. PMID: 39105481 Free PMC article. Review.
-
RETRACTED: Hydroxychloroquine and azithromycin as a treatment of COVID-19: results of an open-label non-randomized clinical trial.Int J Antimicrob Agents. 2020 Jul;56(1):105949. doi: 10.1016/j.ijantimicag.2020.105949. Epub 2020 Mar 20. Int J Antimicrob Agents. 2020. Retraction in: Int J Antimicrob Agents. 2025 Jan;65(1):107416. doi: 10.1016/j.ijantimicag.2024.107416 PMID: 32205204 Free PMC article. Retracted. Clinical Trial.
Cited by
-
Exploring the role of brain-derived extracellular vesicles in viral infections: from pathological insights to biomarker potential.Front Cell Infect Microbiol. 2024 Jun 3;14:1423394. doi: 10.3389/fcimb.2024.1423394. eCollection 2024. Front Cell Infect Microbiol. 2024. PMID: 38887492 Free PMC article. Review.
-
Neurological Complications of COVID-19: Unraveling the Pathophysiological Underpinnings and Therapeutic Implications.Viruses. 2024 Jul 24;16(8):1183. doi: 10.3390/v16081183. Viruses. 2024. PMID: 39205157 Free PMC article. Review.
-
Early 2-Factor Transcription Factors Associated with Progression and Recurrence in Bevacizumab-Responsive Subtypes of Glioblastoma.Cancers (Basel). 2024 Jul 14;16(14):2536. doi: 10.3390/cancers16142536. Cancers (Basel). 2024. PMID: 39061176 Free PMC article.
-
Microfluidic Isolation of Neuronal-Enriched Extracellular Vesicles Shows Distinct and Common Neurological Proteins in Long COVID, HIV Infection and Alzheimer's Disease.Int J Mol Sci. 2024 Mar 29;25(7):3830. doi: 10.3390/ijms25073830. Int J Mol Sci. 2024. PMID: 38612641 Free PMC article.
-
Organ-Dysfunction Markers in Mild-to-Moderate COVID-19 Convalescents.J Clin Med. 2024 Apr 12;13(8):2241. doi: 10.3390/jcm13082241. J Clin Med. 2024. PMID: 38673514 Free PMC article.
References
-
- Fischer A., Zhang L., Elbéji A., Wilmes P., Oustric P., Staub T., Nazarov P.V., Ollert M., Fagherazzi G. Long COVID Symptomatology After 12 Months and Its Impact on Quality of Life According to Initial Coronavirus Disease 2019 Disease Severity. Open Forum Infect. Dis. 2022;9:ofac397. doi: 10.1093/ofid/ofac397. - DOI - PMC - PubMed
-
- FAIR Health . Patients Diagnosed with Post-COVID-19 Conditions: An Analysis of Private Healthcare Claims Using the Official ICD-10 Diagnostic Code. FAIR Health, Inc.; New York, NY, USA: 2022. white paper.
-
- Stefanou M.I., Palaiodimou L., Bakola E., Smyrnis N., Papadopoulou M., Paraskevas G.P., Rizos E., Boutati E., Grigoriadis N., Krogias C., et al. Neurological manifestations of long-COVID syndrome: A narrative review. Ther. Adv. Chronic Dis. 2022;13:20406223221076890. doi: 10.1177/20406223221076890. - DOI - PMC - PubMed
Publication types
MeSH terms
Substances
Grants and funding
LinkOut - more resources
Full Text Sources
Medical
Miscellaneous

