. 2024 Jul;23(7):e14151.
doi: 10.1111/acel.14151. Epub 2024 Mar 26.

Combinatorial transcriptomic and genetic dissection of insulin/IGF-1 signaling-regulated longevity in Caenorhabditis elegans

Affiliations

Combinatorial transcriptomic and genetic dissection of insulin/IGF-1 signaling-regulated longevity in Caenorhabditis elegans

Seokjin Ham et al. Aging Cell. 2024 Jul.

Abstract

Classical genetic analysis is invaluable for understanding the genetic interactions underlying specific phenotypes, but requires laborious and subjective experiments to characterize polygenic and quantitative traits. Contrarily, transcriptomic analysis enables the simultaneous and objective identification of multiple genes whose expression changes are associated with specific phenotypes. Here, we conducted transcriptomic analysis of genes crucial for longevity using datasets with daf-2/insulin/IGF-1 receptor mutant Caenorhabditis elegans. Our analysis unraveled multiple epistatic relationships at the transcriptomic level, in addition to verifying genetically established interactions. Our combinatorial analysis also revealed transcriptomic changes associated with longevity conferred by daf-2 mutations. In particular, we demonstrated that the extent of lifespan changes caused by various mutant alleles of the longevity transcription factor daf-16/FOXO matched their effects on transcriptomic changes in daf-2 mutants. We identified specific aging-regulating signaling pathways and subsets of structural and functional RNA elements altered by different genes in daf-2 mutants. Lastly, we elucidated the functional cooperation between several longevity regulators, based on the combination of transcriptomic and molecular genetic analysis. These data suggest that different biological processes coordinately exert their effects on longevity in biological networks. Together our work demonstrates the utility of transcriptomic dissection analysis for identifying important genetic interactions for physiological processes, including aging and longevity.

Keywords: Caenorhabditis elegans; daf‐2; insulin/IGF‐1 signaling; longevity; transcriptome.


Conflict of interest statement

The authors declare that they have no competing interests.

Figures

FIGURE 1
FIGURE 1
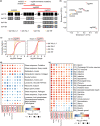
Transcriptomic epistasis analysis between daf‐2 and various genes crucial for reduced insulin/IGF‐1 signaling (IIS)‐mediated longevity. (a) Overall workflow of combinatorial transcriptomic and genetic dissection analyses. See methods for particular analysis tools that were used in this study. (b) Schematic diagram of transcriptomic epistasis between A and B genotypes for a certain phenotype (Ph) (Angeles‐Albores et al., 2018). Epistasis coefficient, (s) = 0: additive (orange), −1/2 < s < 0: branched (green), s = −1/2: unbranched (blue), s = −1: repressive (red). A > B indicates that the phenotype of a single mutant A is similar to that of the double mutant AB, whereas B > A suggests the opposite. (c) Epistasis coefficients between daf‐2 and various genes whose depletion suppresses the longevity of daf‐2 mutants. (d–f) Comparison of simulated epistasis coefficients against the observed coefficients between daf‐2 and daf‐16 (d), pfd‐6 (e), and hlh‐30 (f). Distribution was calculated based on empirical bootstrapping. A dashed green line indicates the average of the data. Datasets include RNA‐seq data using daf‐2 mutants in combination with genetic inhibition of PFD‐6/PFDN6 (Son et al., 2018), HLH‐30/TFEB (Lin et al., 2018), DAF‐16/FOXO (Lin et al., 2018), MATH‐33/USP7 (Heimbucher et al., 2015), HIS‐71 and HIS‐72/H3.3 (Piazzesi et al., 2016), SPR‐3 and SPR‐4/REST (Zullo et al., 2019) SMG‐2/UPF1 (Son et al., 2017), and HEL‐1/DDX39A (Seo et al., 2015).
FIGURE 2
FIGURE 2
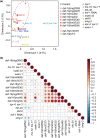
Transcriptomic dissection of factors that mediate longevity caused by daf‐2 mutations. (a) A multidimensional scaling plot showing relative Euclidian distances of top 500 genes among various genetic factors that contribute to the longevity of daf‐2 mutants (Control) at transcriptome levels after regularized log transformation (Love et al., 2014) and batch effect correction (Risso et al., 2014). A dotted red oval represents datasets of multiple daf‐16, daf‐18, hel‐1, swsn‐1, and math‐33 mutant alleles that clustered together. (b) Pearson's correlation coefficients of transcriptome levels using colors (red: positive, blue: negative) changed by the analyzed genetic factors in daf‐2 mutant backgrounds. Datasets include RNA‐seq data with daf‐2 mutants in combination with genetic inhibition of DAF‐16/FOXO (Chen et al., ; Heimbucher et al., ; Kumar et al., ; Lin et al., ; Riedel et al., 2013), DAF‐18/PTEN (Park et al., 2021), HEL‐1/DDX39A (Seo et al., 2015), HIS‐71 and HIS‐72/H3.3 (Piazzesi et al., 2016), HLH‐30/TFEB (Lin et al., 2018), HSF‐1/HSF1 (Lee et al., 2021), MATH‐33/USP7 (Heimbucher et al., 2015), PFD‐6/PFDN6 (Son et al., 2018), SMG‐2/UPF1 (Son et al., 2017), SPR‐3 and SPR‐4/REST (Zullo et al., 2019), and SWSN‐1/SMARCC (Riedel et al., 2013). See Appendix S3 for detailed values used for this figure.
FIGURE 3
FIGURE 3
Transcriptomic analysis of seven selected daf‐16 mutant alleles in daf‐2 mutant backgrounds. (a) Schematic diagram of the daf‐16 mutant alleles along daf‐16 gene (black) and daf‐16 transcript isoforms (gray). Colors of the alleles indicate the extents of their impacts on phenotypic and transcriptomic changes: red > pink > orange > yellow. (b) A multidimensional scaling plot showing relative Euclidian distances among the seven daf‐16 mutant alleles that we analyzed in daf‐2 mutant backgrounds at transcriptome levels. (c) Cumulative fraction of the genes in an ascending order of the extent of gene expression changes conferred by the daf‐16 mutant alleles in daf‐2 mutant backgrounds. daf‐16 isoforms that are affected by mutant alleles are indicated. (d) Normalized enrichment scores (NES) of transcriptomic changes in indicated WormCat terms at intermediate levels caused by various daf‐16 mutant alleles. q‐values were obtained by calculating the false discovery rate corresponding to each NES. Representative terms were selected based on minimum q‐values (q = 0.05) among different conditions. The terms were further selected if at least four conditions showed absolute NES greater than 1.5. Terms were sorted based on the number of upregulated terms. (e) NES of transcriptomic changes for biomarkers elicited by various daf‐16 mutant alleles in indicated cells (Preston et al., 2019). NES range from −3 (blue) to +3 (red). The size of black circles correlates with −log10(q‐value). References for datasets with the same mutant alleles were indicated as follows: Riedel mgDf47 (Riedel et al., 2013), Lin mgDf47 (Lin et al., 2018), Chen mu86 (Chen et al., 2015), and Heimbucher mu86 (Heimbucher et al., 2015).
FIGURE 4
FIGURE 4
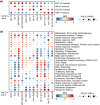
The effects of four representative longevity‐promoting transcription factors that act downstream of daf‐2 mutants on transcriptomic changes. (a) NES of transcriptomic changes of target genes of representative longevity transcription factors acting in the IIS: DAF16/FOXO (Riedel et al., 2013), SKN‐1/NRF (Ewald et al., 2015), HLH‐30 (Lin et al., 2018), and HSF‐1/HSF1 (Lee et al., 2021). q‐values were obtained by calculating the false discovery rate corresponding to each NES. Datasets were sorted based on hierarchical clustering. (b) NES of transcriptomic changes in indicated WormCat terms at intermediate levels by the mutations analyzed in this study. q‐values were obtained by calculating the false discovery rate corresponding to each NES. Representative terms were selected based on minimum q‐values (q = 0.05) among different conditions. The terms were further selected when at least five conditions showed absolute NES greater than 1.5 or at least six conditions showed absolute NES greater than 1.25. Terms were sorted based on hierarchical clustering. NES range from −3 (blue) to +3 (red). The size of black circles correlates with −log10(q‐value).
FIGURE 5
FIGURE 5
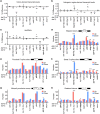
Analysis of representative non‐coding RNAs and splicing of mRNAs affected by genetic inhibitions that suppress the longevity of daf‐2 mutants. (a–c) Overall changes in the levels of intron‐derived transcripts (a), intergenic region‐derived transcripts (b), and long intergenic noncoding RNA (lincRNA) (c) by mutations in the longevity‐promoting genetic factors analyzed in this study. p value of two‐tailed Welch's t test is shown on top of each panel, *p < 0.05, **p < 0.01, ***p < 0.001. Genes whose mutations elicited significant changes are indicated in bold in this figure. (d–h) The number of splicing events, including skipped exons (d), proximal 5′ splice sites (e), distal 3′ splice sites (f), mutually exclusive exons (usage of distal exons) (g), and retained introns (h), which were upregulated or downregulated by the mutations analyzed in this study. p values of two‐tailed Fisher's exact test for counts are shown on top of each panel, *p < 0.05, **p < 0.01, ***p < 0.001.
FIGURE 6
FIGURE 6
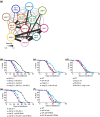
SMG‐2/UPF1, HLH‐30/TFEB, and PFD‐6/PFDN6 act coordinately to promote longevity caused by daf‐2 mutations. (a) A network of various longevity factors reconstructed by using a consensus approach based on correlation coefficients of transcriptome data. The widths and darkness of lines that connect datasets correlate with the intensities of the links from 0.8 (gray) to 1 (black). Links with intensities ≥0.8 are shown. See Appendix S7 for detailed values of the links. (b) Lifespan curves of daf‐2 ( e1370 ) [daf‐2 (−)], daf‐2 (−) ; hlh‐30 ( tm1978 ) [hlh‐30 (−)], smg‐2 ( qd101 ) [smg‐2 (−)]; daf‐2 (−), and smg‐2 (−) ; daf‐2 (−) ; hlh‐30 (−) animals. (c) The lifespan of wild‐type (WT), smg‐2 (−), hlh‐30 overexpressing (o/e) (sqIs17 [ hlh‐30p::hlh‐30::GFP; rol‐6 ( su1006 )]), and smg‐2 (−) ; hlh‐30 o/e animals. (d) The lifespan of WT, hlh‐30 (−), smg‐1 o/e (yhEx330 [ smg‐1p::smg‐1::gfp ; odr‐1p::RFP ]), and hlh‐30 (−) ; smg‐1 o/e animals. (e) Lifespan curves of daf‐2 (−) and daf‐2 (−) ; hlh‐30 (−)animals treated with pfd‐6 RNAi. (f) Lifespan of WT and hlh‐30 o/e animals treated with pfd‐6 RNAi. At least 75 animals were used for each condition of lifespan assays. See Table S3 for additional repeats and statistical analysis of the lifespan data shown in this figure.

Similar articles

References

    1. Akay, A. , Jordan, D. , Navarro, I. C. , Wrzesinski, T. , Ponting, C. P. , Miska, E. A. , & Haerty, W. (2019). Identification of functional long non‐coding RNAs in C. elegans . BMC Biology, 17(1), 14. 10.1186/s12915-019-0635-7 - DOI - PMC - PubMed
    1. Altintas, O. , Park, S. , & Lee, S. J. (2016). The role of insulin/IGF‐1 signaling in the longevity of model invertebrates, C. elegans and D. melanogaster . BMB Reports, 49(2), 81–92. 10.5483/bmbrep.2016.49.2.261 - DOI - PMC - PubMed
    1. Aman, Y. , Schmauck‐Medina, T. , Hansen, M. , Morimoto, R. I. , Simon, A. K. , Bjedov, I. , Palikaras, K. , Simonsen, A. , Johansen, T. , Tavernarakis, N. , Rubinsztein, D. C. , Partridge, L. , Kroemer, G. , Labbadia, J. , & Fang, E. F. (2021). Autophagy in healthy aging and disease. Nature Aging, 1(8), 634–650. 10.1038/s43587-021-00098-4 - DOI - PMC - PubMed
    1. Angeles‐Albores, D. , Puckett Robinson, C. , Williams, B. A. , Wold, B. J. , & Sternberg, P. W. (2018). Reconstructing a metazoan genetic pathway with transcriptome‐wide epistasis measurements. Proceedings of the National Academy of Sciences of the United States of America, 115(13), E2930–E2939. 10.1073/pnas.1712387115 - DOI - PMC - PubMed
    1. Avery, L. , & Wasserman, S. (1992). Ordering gene function: The interpretation of epistasis in regulatory hierarchies. Trends in Genetics, 8(9), 312–316. 10.1016/0168-9525(92)90263-4 - DOI - PMC - PubMed

MeSH terms

LinkOut - more resources