

Helicobacter pylori, persistent infection burden and structural brain imaging markers
- PMID: 38529358
- PMCID: PMC10961948
- DOI: 10.1093/braincomms/fcae088
Helicobacter pylori, persistent infection burden and structural brain imaging markers
Abstract
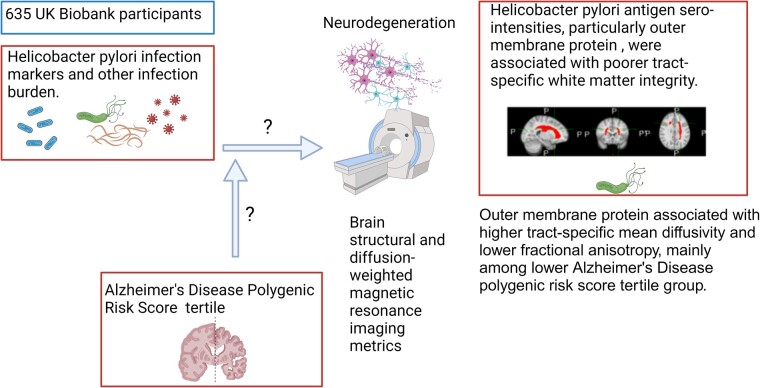
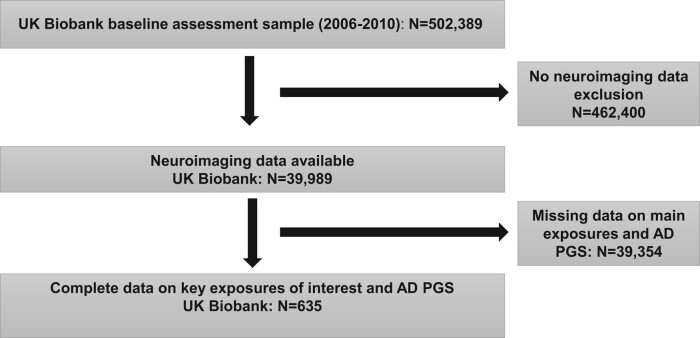
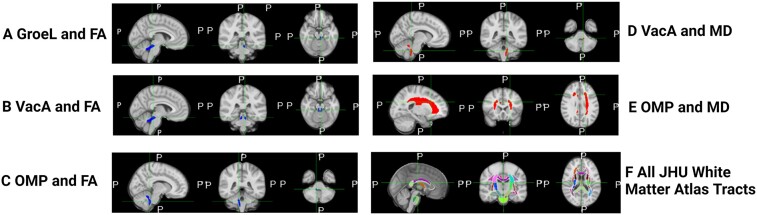
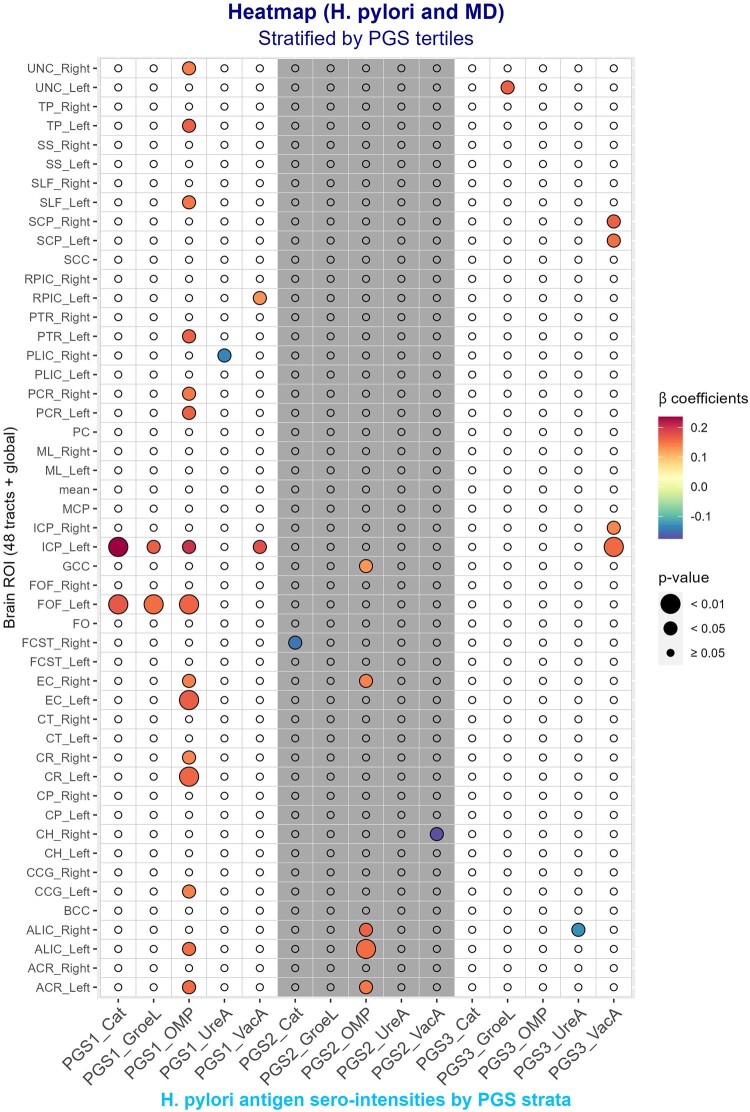
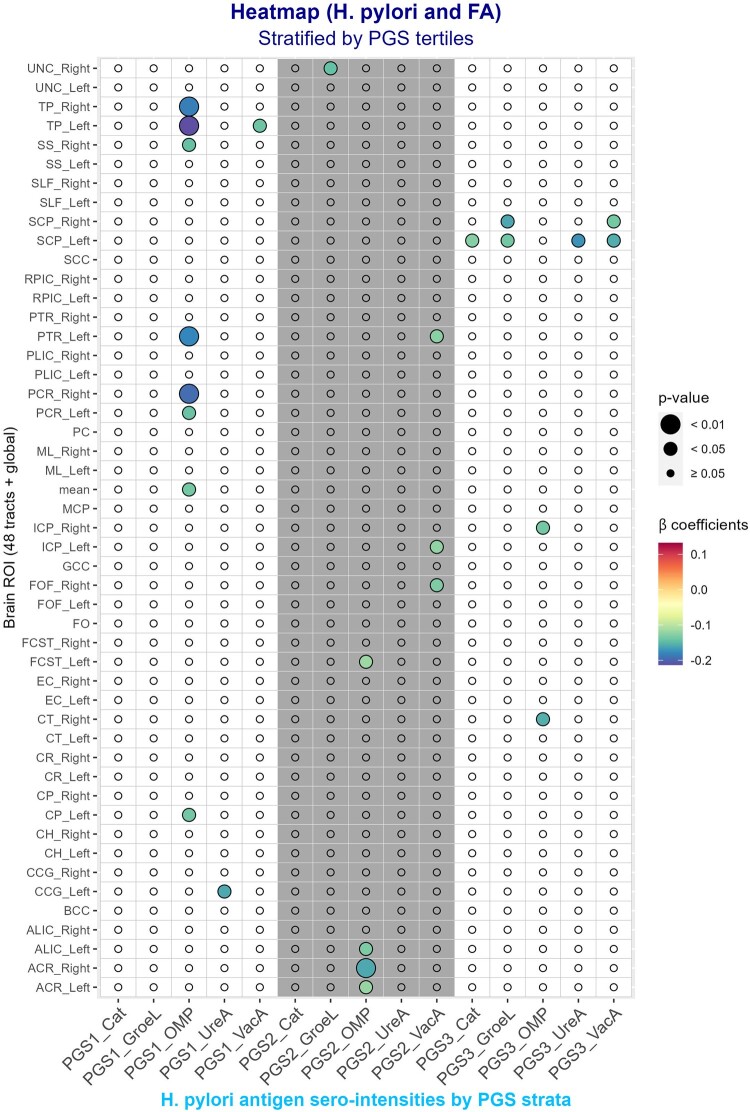
Persistent infections, whether viral, bacterial or parasitic, including Helicobacter pylori infection, have been implicated in non-communicable diseases, including dementia and other neurodegenerative diseases. In this cross-sectional study, data on 635 cognitively normal participants from the UK Biobank study (2006-21, age range: 40-70 years) were used to examine whether H. pylori seropositivity (e.g. presence of antibodies), serointensities of five H. pylori antigens and a measure of total persistent infection burden were associated with selected brain volumetric structural MRI (total, white, grey matter, frontal grey matter (left/right), white matter hyperintensity as percent intracranial volume and bi-lateral sub-cortical volumes) and diffusion-weighted MRI measures (global and tract-specific bi-lateral fractional anisotropy and mean diffusivity), after an average 9-10 years of lag time. Persistent infection burden was calculated as a cumulative score of seropositivity for over 20 different pathogens. Multivariable-adjusted linear regression analyses were conducted, whereby selected potential confounders (all measures) and intracranial volume (sub-cortical volumes) were adjusted, with stratification by Alzheimer's disease polygenic risk score tertile when exposures were H. pylori antigen serointensities. Type I error was adjusted to 0.007. We report little evidence of an association between H. pylori seropositivity and persistent infection burden with various volumetric outcomes (P > 0.007, from multivariable regression models), unlike previously reported in past research. However, H. pylori antigen serointensities, particularly immunoglobulin G against the vacuolating cytotoxin A, GroEL and outer membrane protein antigens, were associated with poorer tract-specific white matter integrity (P < 0.007), with outer membrane protein serointensity linked to worse outcomes in cognition-related tracts such as the external capsule, the anterior limb of the internal capsule and the cingulum, specifically at low Alzheimer's disease polygenic risk. Vacuolating cytotoxin A serointensity was associated with greater white matter hyperintensity volume among individuals with mid-level Alzheimer's disease polygenic risk, while among individuals with the highest Alzheimer's disease polygenic risk, the urease serointensity was consistently associated with reduced bi-lateral caudate volumes and the vacuolating cytotoxin A serointensity was linked to reduced right putamen volume (P < 0.007). Outer membrane protein and urease were associated with larger sub-cortical volumes (e.g. left putamen and right nucleus accumbens) at middle Alzheimer's disease polygenic risk levels (P < 0.007). Our results shed light on the relationship between H. pylori seropositivity, H. pylori antigen levels and persistent infection burden with brain volumetric structural measures. These data are important given the links between infectious agents and neurodegenerative diseases, including Alzheimer's disease, and can be used for the development of drugs and preventive interventions that would reduce the burden of those diseases.
Keywords: Helicobacter pylori; brain imaging; cognitive aging; persistent infection.
Published by Oxford University Press on behalf of the Guarantors of Brain 2024.
Conflict of interest statement
The authors report no competing interests. The views expressed in this article are those of the authors and do not necessarily reflect the official policy or position of Fort Belvoir Community Hospital, the Defense Health Agency, the Department of Defense or the U.S. Government. Reference to any commercial products within this publication does not create or imply any endorsement by Fort Belvoir Community Hospital, the Defense Health Agency, the Department of Defense or the U.S. Government.
Figures
Similar articles
-
Cardiovascular health, infection burden and their interactive association with brain volumetric and white matter integrity outcomes in the UK Biobank.Brain Behav Immun. 2023 Oct;113:91-103. doi: 10.1016/j.bbi.2023.06.028. Epub 2023 Jun 29. Brain Behav Immun. 2023. PMID: 37393057 Free PMC article.
-
Magnetic resonance imaging evidence for presymptomatic change in thalamus and caudate in familial Alzheimer's disease.Brain. 2013 May;136(Pt 5):1399-414. doi: 10.1093/brain/awt065. Epub 2013 Mar 28. Brain. 2013. PMID: 23539189 Free PMC article.
-
Association between insomnia and cognitive performance, gray matter volume, and white matter microstructure in cognitively unimpaired adults.Alzheimers Res Ther. 2020 Jan 7;12(1):4. doi: 10.1186/s13195-019-0547-3. Alzheimers Res Ther. 2020. PMID: 31907066 Free PMC article.
-
Cognitive function in UK adults seropositive for Helicobacter pylori.PLoS One. 2023 Jun 7;18(6):e0286731. doi: 10.1371/journal.pone.0286731. eCollection 2023. PLoS One. 2023. PMID: 37285350 Free PMC article.
-
Review: Impact of Helicobacter pylori on Alzheimer's disease: What do we know so far?Helicobacter. 2018 Feb;23(1). doi: 10.1111/hel.12454. Epub 2017 Nov 27. Helicobacter. 2018. PMID: 29181894 Review.
References
-
- Huang WS, Yang TY, Shen WC, Lin CL, Lin MC, Kao CH. Association between Helicobacter pylori infection and dementia. J Clin Neurosci. 2014;21(8):1355–1358. - PubMed
-
- Prince M, Bryce R, Albanese E, Wimo A, Ribeiro W, Ferri CP. The global prevalence of dementia: A systematic review and metaanalysis. Alzheimers Dement. 2013;9(1):63–75.e2. - PubMed
-
- Sosa-Ortiz AL, Acosta-Castillo I, Prince MJ. Epidemiology of dementias and Alzheimer’s disease. Arch Med Res. 2012;43(8):600–608. - PubMed
-
- Lindeboom J, Weinstein H. Neuropsychology of cognitive ageing, minimal cognitive impairment, Alzheimer’s disease, and vascular cognitive impairment. Eur J Pharmacol. 2004;490(1–3):83–86. - PubMed
Grants and funding
LinkOut - more resources
Full Text Sources
Research Materials
Miscellaneous