

Phylogenomics resolves the higher-level phylogeny of herbivorous eriophyoid mites (Acariformes: Eriophyoidea)
- PMID: 38519936
- PMCID: PMC10960459
- DOI: 10.1186/s12915-024-01870-9
Phylogenomics resolves the higher-level phylogeny of herbivorous eriophyoid mites (Acariformes: Eriophyoidea)
Abstract
Background: Eriophyoid mites (Eriophyoidea) are among the largest groups in the Acariformes; they are strictly phytophagous. The higher-level phylogeny of eriophyoid mites, however, remains unresolved due to the limited number of available morphological characters-some of them are homoplastic. Nevertheless, the eriophyoid mites sequenced to date showed highly variable mitochondrial (mt) gene orders, which could potentially be useful for resolving the higher-level phylogenetic relationships.
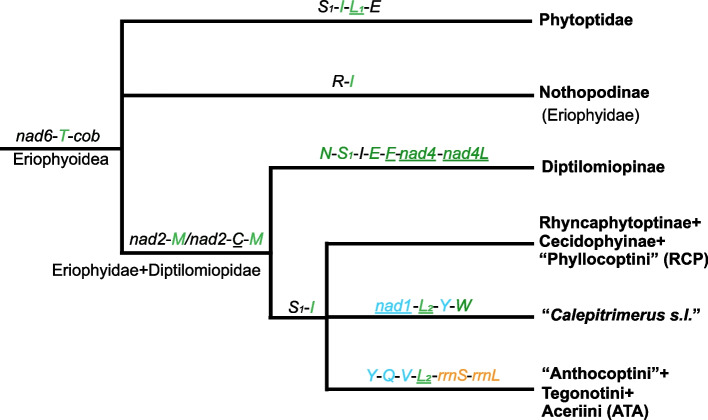
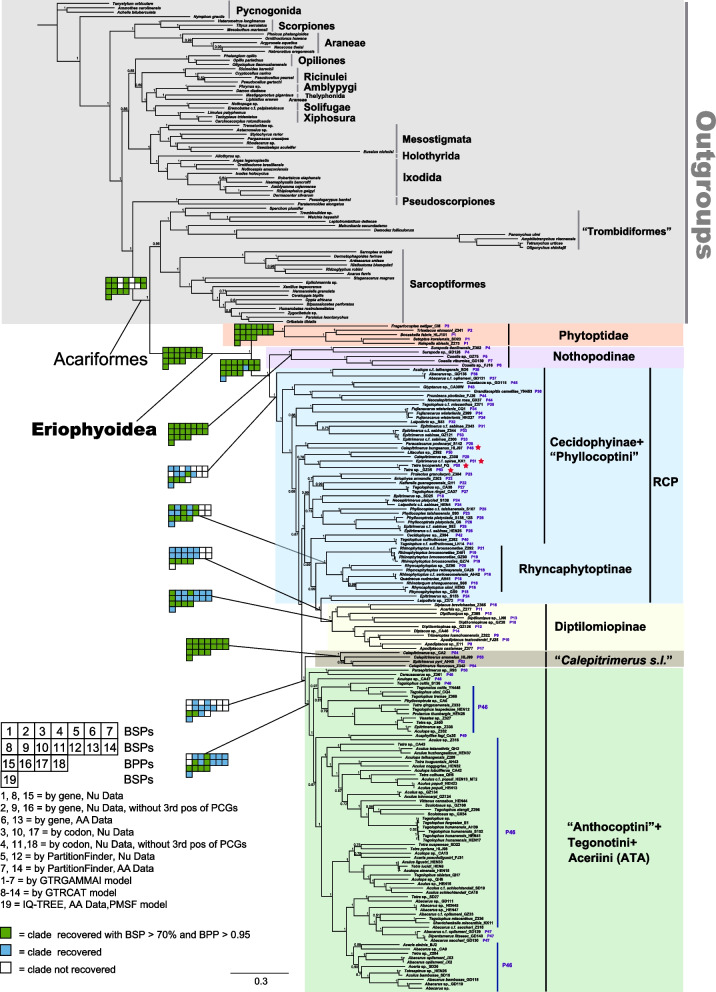
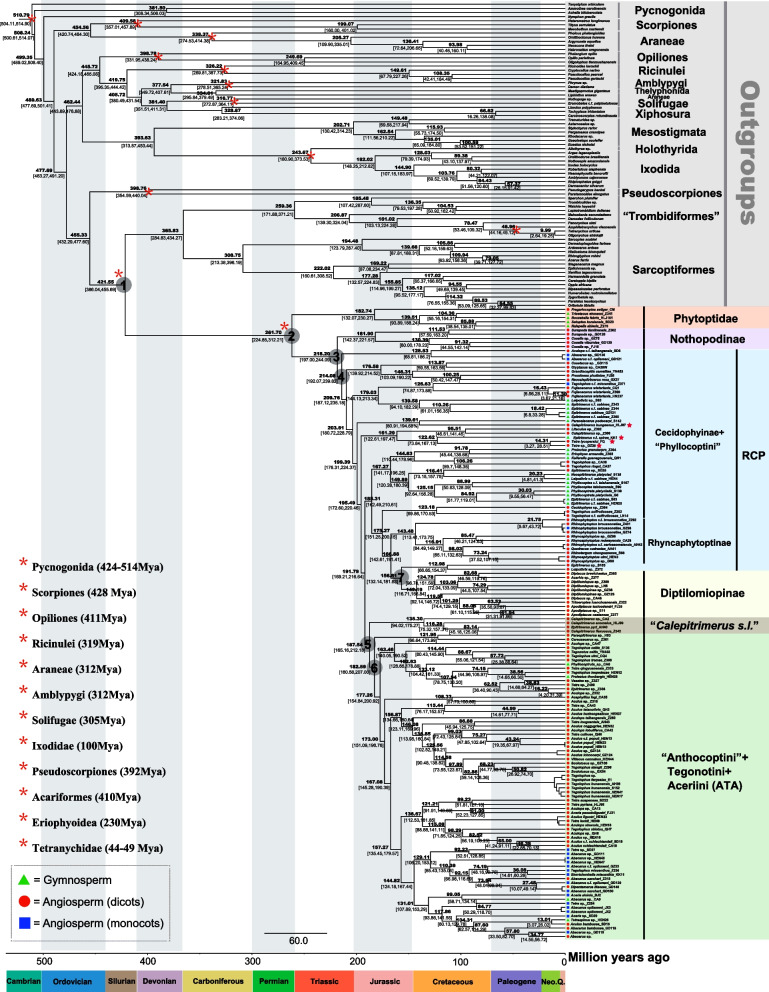
Results: Here, we sequenced and compared the complete mt genomes of 153 eriophyoid mite species, which showed 54 patterns of rearranged mt gene orders relative to that of the hypothetical ancestor of arthropods. The shared derived mt gene clusters support the monophyly of eriophyoid mites (Eriophyoidea) as a whole and the monophylies of six clades within Eriophyoidea. These monophyletic groups and their relationships were largely supported in the phylogenetic trees inferred from mt genome sequences as well. Our molecular dating results showed that Eriophyoidea originated in the Triassic and diversified in the Cretaceous, coinciding with the diversification of angiosperms.
Conclusions: This study reveals multiple molecular synapomorphies (i.e. shared derived mt gene clusters) at different levels (i.e. family, subfamily or tribe level) from the complete mt genomes of 153 eriophyoid mite species. We demonstrated the use of derived mt gene clusters in unveiling the higher-level phylogeny of eriophyoid mites, and underlines the origin of these mites and their co-diversification with angiosperms.
Keywords: Divergence time; Eriophyoid mites; Gene order; Higher-level phylogeny; Mitochondrial genomes; Synteny.
© 2024. The Author(s).
Conflict of interest statement
The authors declare that they have no competing interests.
Figures
Similar articles
-
The phylogenetic position of eriophyoid mites (superfamily Eriophyoidea) in Acariformes inferred from the sequences of mitochondrial genomes and nuclear small subunit (18S) rRNA gene.Mol Phylogenet Evol. 2017 Apr;109:271-282. doi: 10.1016/j.ympev.2017.01.009. Epub 2017 Jan 22. Mol Phylogenet Evol. 2017. PMID: 28119107
-
Mitochondrial genome evolution and tRNA truncation in Acariformes mites: new evidence from eriophyoid mites.Sci Rep. 2016 Jan 6;6:18920. doi: 10.1038/srep18920. Sci Rep. 2016. PMID: 26732998 Free PMC article.
-
Macroevolutionary analyses point to a key role of hosts in diversification of the highly speciose eriophyoid mite superfamily.Mol Phylogenet Evol. 2023 Feb;179:107676. doi: 10.1016/j.ympev.2022.107676. Epub 2022 Dec 16. Mol Phylogenet Evol. 2023. PMID: 36535519
-
DNA-based methods for eriophyoid mite studies: review, critical aspects, prospects and challenges.Exp Appl Acarol. 2010 Jul;51(1-3):257-71. doi: 10.1007/s10493-009-9301-z. Epub 2009 Oct 14. Exp Appl Acarol. 2010. PMID: 19826904 Review.
-
An Intimate Relationship Between Eriophyoid Mites and Their Host Plants - A Review.Front Plant Sci. 2018 Dec 4;9:1786. doi: 10.3389/fpls.2018.01786. eCollection 2018. Front Plant Sci. 2018. PMID: 30564261 Free PMC article. Review.
References
-
- Zhang Z-Q. Phylum Arthropoda von Siebold, 1848 In: Zhang Z-Q, editor. Animal biodiversity: an outline of higher-level classification and survey of taxonomic richness. Zootaxa. 2011;3148(1):99–103. - PubMed
-
- Zhang Z-Q. Eriophyoidea and allies: where do they belong? Syst Appl Acarol. 2017;22:1091–1095.
-
- Li N, Sun J-T, Yin Y, Hong X-Y, Xue X-F. Global patterns and drivers of herbivorous eriophyoid mite species diversity. J Biogeogr. 2023;50:330–340. doi: 10.1111/jbi.14535. - DOI
-
- Amrine JW, Jr, Stasny TAH, Flechtmann CHW. Revised keys to world genera of Eriophyoidea (Acari: Prostigmata) Michigan: Indira Publishing House; 2003.
MeSH terms
Grants and funding
LinkOut - more resources
Full Text Sources
