. 2024 Mar 7:11:1332090.
doi: 10.3389/fmolb.2024.1332090. eCollection 2024.

A GC-MS-based untargeted metabolomics approach for comprehensive metabolic profiling of mycophenolate mofetil-induced toxicity in mice

Affiliations

A GC-MS-based untargeted metabolomics approach for comprehensive metabolic profiling of mycophenolate mofetil-induced toxicity in mice

Tongfeng Zhao et al. Front Mol Biosci. .

Abstract

Background: Mycophenolate mofetil (MMF), the morpholinoethyl ester of mycophenolic acid, is widely used for maintenance immunosuppression in transplantation. The gastrointestinal toxicity of MMF has been widely uncovered. However, the comprehensive metabolic analysis of MMF-induced toxicity is lacking. This study is aimed to ascertain the metabolic changes after MMF administration in mice. Methods: A total of 700 mg MMF was dissolved in 7 mL dimethyl sulfoxide (DMSO), and then 0.5 mL of mixture was diluted with 4.5 mL of saline (100 mg/kg). Mice in the treatment group (n = 9) were given MMF (0.1 mL/10 g) each day via intraperitoneal injection lasting for 2 weeks, while those in the control group (n = 9) received the same amount of blank solvent (DMSO: saline = 1:9). Gas chromatography-mass spectrometry was utilized to identify the metabolic profiling in serum samples and multiple organ tissues of mice. The potential metabolites were identified using orthogonal partial least squares discrimination analysis. Meanwhile, we used the MetaboAnalyst 5.0 (http://www.metaboanalyst.ca) and Kyoto Encyclopedia of Genes and Genomes database (http://www.kegg.jp) to depict the metabolic pathways. The percentages of lymphocytes in spleens were assessed by multiparameter flow cytometry analysis. Results: Compared to the control group, we observed that MMF treatment induced differential expression of metabolites in the intestine, hippocampus, lung, liver, kidney, heart, serum, and cortex tissues. Subsequently, we demonstrated that multiple amino acids metabolism and fatty acids biosynthesis were disrupted following MMF treatment. Additionally, MMF challenge dramatically increased CD4+ T cell percentages but had no significant influences on other types of lymphocytes. Conclusion: MMF can affect the metabolism in various organs and serum in mice. These data may provide preliminary judgement for MMF-induced toxicity and understand the metabolic mechanism of MMF more comprehensively.

Keywords: gas chromatography-mass spectrometry; lymphocytes; multiparameter flow cytometry analysis; mycophenolate mofetil; toxicity.


Conflict of interest statement

The authors declare that the research was conducted in the absence of any commercial or financial relationships that could be construed as a potential conflict of interest.

Figures

FIGURE 1
FIGURE 1
Representative gas chromatography–mass spectrometry (GC–MS) total ion chromatograms (TICs) of quality control (QC). (A) Intestine (B) Hippocampus (C) Lung (D) Liver (E) Kidney (F) Heart (G) Serum (H) Cortex.
FIGURE 2
FIGURE 2
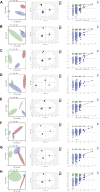
PCA analysis, OPLS-DA score plots and 200 permutation tests. (A) Intestine (B) Hippocampus (C) Lung (D) Liver (E) Kidney (F) Heart (G) Serum (H) Cortex.
FIGURE 3
FIGURE 3
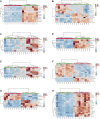
Heatmap of differential metabolites in (A) Intestine (B) Hippocampus (C) Lung (D) Liver (E) Kidney (F) Heart (G) Serum (H) Cortex in the mycophenolate mofetil (MMF) groups compared with controls. The color of each part represents the importance of metabolite changes (blue, downregulated; red, upregulated). Rows represent samples, and columns represent metabolites.
FIGURE 4
FIGURE 4
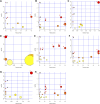
Summary of pathway analysis performed using MetaboAnalyst 5.0. (A) Intestine: (a) Aminoacyl-tRNA biosynthesis; (b) Galactose metabolism; (c) Phenylalanine, tyrosine and tryptophan biosynthesis; (d) Fatty acid biosynthesis. (B) Hippocampus: (c) Phenylalanine, tyrosine and tryptophan biosynthesis; (e) Aminoacyl-tRNA biosynthesis; (f) Alanine, aspartate and glutamate metabolism; (g) Valine, leucine and isoleucine biosynthesis; (h) Arginine biosynthesis; (i) Histidine metabolism; (j) Nitrogen metabolism; (k) D-Glutamine and D-glutamate metabolism; (C) Lung: (e) Aminoacyl-tRNA biosynthesis; (g) Valine, leucine and isoleucine biosynthesis; (l) Glycine, serine and threonine metabolism. (D) Liver: (a) Biosynthesis of unsaturated fatty acids. (E) Kidney: (c) Phenylalanine, tyrosine and tryptophan biosynthesis; (d) Fatty acid biosynthesis; (e) Aminoacyl-tRNA biosynthesis; (l) Glycine, serine and threonine metabolism; (m) Glyoxylate and dicarboxylate metabolism; (n) Primary bile acid biosynthesis. (F) Heart: (a) Biosynthesis of unsaturated fatty acids; (c) Phenylalanine, tyrosine and tryptophan biosynthesis; (d) Fatty acid biosynthesis; (e) Aminoacyl-tRNA biosynthesis; (j) Nitrogen metabolism; (k) D-Glutamine and D-glutamate metabolism. (G) Serum: (e) Aminoacyl-tRNA biosynthesis; (f) Alanine, aspartate and glutamate metabolism; (o) Ascorbate and aldarate metabolism. (H) Cortex: (c) Phenylalanine, tyrosine and tryptophan biosynthesis; (e) Aminoacyl-tRNA biosynthesis; (f) Alanine, aspartate and glutamate metabolism; (h) Arginine biosynthesis; (i) Histidine metabolism; (m) Glyoxylate and dicarboxylate metabolism; (p) Glutathione metabolism; (q) Porphyrin and chlorophyll metabolism. Black font represents pathways with p-value < 0.05 and impact = 0. Red font represents pathways with p-value < 0.05 and impact > 0. No labeling font represents pathways with p-value > 0.05.
FIGURE 5
FIGURE 5
Schematic diagram of related metabolic pathways affected by MMF in serum and major tissues. The activation metabolic pathways were marked in red box. Solid arrows represent a single process, while dashed arrows represent multiple processes. Differential metabolites enriched in pathways were marked in bold.
FIGURE 6
FIGURE 6
Multiparameter flow cytometry analysis for the percentages of lymphocytes from spleen. (A) Representative images of multiparameter flow cytometry analysis. (B) The percentages of CD3+ T cells, CD4+ T cells, CD8+ T cells, Natural Killer (NK) cells, B cells, Treg cells, peripheral granulocytic-myeloid-derived suppressor cells (G-MDSCs) and monocytic-myeloid-derived suppressor cells (M-MDSCs) in the control and MMF groups. *p < 0.05. ns, no significance.

Similar articles

References

    1. Allison A. C., Eugui E. M. (1993). The design and development of an immunosuppressive drug, mycophenolate mofetil. Springer Semin. Immunopathol. 14 (4), 353–380. 10.1007/BF00192309 - DOI - PubMed
    1. Augustin R. (2010). The protein family of glucose transport facilitators: it's not only about glucose after all. IUBMB Life 62 (5), 315–333. 10.1002/iub.315 - DOI - PubMed
    1. Balal M., Demir E., Paydas S., Sertdemir Y., Erken U. (2005). Uncommon side effect of MMF in renal transplant recipients. Ren. Fail. 27 (5), 591–594. 10.1080/08860220500200171 - DOI - PubMed
    1. Bhattacharya S., Stoleru G., Patel P., Abutaleb A., Stashek K., Cross R. K. (2022). Characterization of mycophenolate mofetil gastrointestinal toxicity and risk factors for severe disease and poor prognosis. Inflamm. Bowel Dis. 28 (5), 811–814. 10.1093/ibd/izab254 - DOI - PMC - PubMed
    1. Calmet F. H., Yarur A. J., Pukazhendhi G., Ahmad J., Bhamidimarri K. R. (2015). Endoscopic and histological features of mycophenolate mofetil colitis in patients after solid organ transplantation. Ann. gastroenterology Q. Publ. Hellenic Soc. Gastroenterology 28 (3), 366–373. - PMC - PubMed

Grants and funding

The authors declare financial support was received for the research, authorship, and/or publication of this article. This study was supported by Key R&D Program of Jining (No. 2021YXNS042), Doctoral Research Startup Foundation of Jining No.1 People’s Hospital (No. 2019003), Shandong Medicine and Health Science Technology Development Plan (No. 202203040532), the Projects of medical and health technology development program in Shandong province (No. 202113050502), the Key R&D Program of Jining (No. 2022YXNS118) and Shandong Medicine and Health Science Technology Development Plan (No. 2018WS475).