. 2024 Mar 20;15(1):2484.
doi: 10.1038/s41467-024-46785-9.

Reciprocal inhibition between TP63 and STAT1 regulates anti-tumor immune response through interferon-γ signaling in squamous cancer

Affiliations

Reciprocal inhibition between TP63 and STAT1 regulates anti-tumor immune response through interferon-γ signaling in squamous cancer

Yuan Jiang et al. Nat Commun. .

Abstract

Squamous cell carcinomas (SCCs) are common and aggressive malignancies. Immune check point blockade (ICB) therapy using PD-1/PD-L1 antibodies has been approved in several types of advanced SCCs. However, low response rate and treatment resistance are common. Improving the efficacy of ICB therapy requires better understanding of the mechanism of immune evasion. Here, we identify that the SCC-master transcription factor TP63 suppresses interferon-γ (IFNγ) signaling. TP63 inhibition leads to increased CD8+ T cell infiltration and heighten tumor killing in in vivo syngeneic mouse model and ex vivo co-culture system, respectively. Moreover, expression of TP63 is negatively correlated with CD8+ T cell infiltration and activation in patients with SCC. Silencing of TP63 enhances the anti-tumor efficacy of PD-1 blockade by promoting CD8+ T cell infiltration and functionality. Mechanistically, TP63 and STAT1 mutually suppress each other to regulate the IFNγ signaling by co-occupying and co-regulating their own promoters and enhancers. Together, our findings elucidate a tumor-extrinsic function of TP63 in promoting immune evasion of SCC cells. Over-expression of TP63 may serve as a biomarker predicting the outcome of SCC patients treated with ICB therapy, and targeting TP63/STAT/IFNγ axis may enhance the efficacy of ICB therapy for this deadly cancer.


Conflict of interest statement

Y.Y.J., Y.J., J.D., S.K., D.Z. and C.Y. are named inventors on patent pending related to this study entitled “Application of Trp63 inhibition in improving the efficacy of immunotherapy for squamous cancer” (identification number: CNIPA. 202311497087.3). Other authors declare that they have no other competing interests.

Figures

Fig. 1
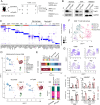
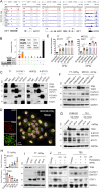
Fig. 1. TP63 suppresses IFNγ response signaling in SCC tumors.
A Scheme of RNA-seq analysis in SCC primary tumors and cell lines. Right upper: Hallmark pathway enrichment analysis showing the top 10 pathways that are negatively correlated with the expression of TP63. Right lower: gene set enrichment analysis (GSEA) plots revealing significant enrichment of IFNγ and IFNα response pathways in TP63-low expressed SCC cells. Data were from TCGA (n = 1077) and CCLE (n = 112), respectively. ESCC: esophageal squamous cell carcinoma; HNSC: head and neck squamous cell carcinoma; LUSC: lung squamous cell carcinoma. B GSEA revealing significant enrichment of upregulated genes in IFNγ and IFNα response pathways upon knockdown of TP63 expression in 3 SCC cell lines. RNA-seq data were from in-house (GSE106564) and public datasets (GSE88833 and GSE4975). C Venn diagram representing TP63 negatively regulated IFNα/γ response genes in three types of SCCs. 23 overlapped ISGs are listed below. D, E qRT-PCR analysis showing relative mRNA levels of TP63 (D) and the 23 ISGs (E) in human (TT) and murine SCC (MOC22) cells expressing non-targeting control (Scramble) or TP63-targeting shRNA (shTP63) pulsed with IFNγ (100 ng/mL) for 48 h. Data represent mean ± SD, n = 3 biologically independent experiments. F Western blotting analysis showing the protein levels of TP63 and representative ISGs of E in TT and MOC22 cells expressing non-targeting control (Scramble) or TP63-targeting shRNA (shTP63) pulsed with IFNγ (100 ng/mL) for 48 h. The results were repeated with three biologically independent experiments in two cell lines. Source data and exact P values for Fig. 1D–F are provided as a Source Data file.
Fig. 2
Fig. 2. TP63 suppresses CD8+ T cells infiltration and activation in immune-competent murine SCC models.
A Schematic graph of the in vivo syngeneic experiments. B TP63 expression assessed by western blotting in murine SCC cell lines transduced with Dox-inducible Trp63 shRNA. The similar results were repeated in three biologically independent cells. C Dotplot showing the expression levels of representative marker genes across each immune cell type. For scRNA-seq experiment, each group included 4 tumors from 4 mice, which were combined and dissociated into single cells capture. A total of 1911 CD45+ immune cells were analyzed. D UMAP plots of the clustering of 1911 cells from 854 Scramble and 1,057 Trp63 knockdown cells, showing all the intratumoral immune cells (upper) or the immune cells in either Scramble or shTrp63 MOC22 tumors (bottom). E The proportion of each immune cell type in the Scramble and Trp63 knockdown tumors. F UMAP plots showing the subgroups of 645 CD8+ T cells from Scramble and shTrp63 MOC22 tumors. G The expression levels of canonical markers for each cell cluster. H The proportion of CD8+ T cell subgroups in Scramble and shTrp63 MOC22 tumors. I The proportion of CD3+ and CD8+ in CD45+ immune cells and CD69+, GZMB+ and IFNγ+ in CD8+ T cells from shTrp63 or Scramble HNM007 and AKR allografts revealed by FACS analysis. Bars represent mean ± SD of three biologically independent experiments. For the comparison of each population between the Scramble and shTP63 group in HNM007 and AKR allografts: CD45+ CD3+ (P = 0.0434/0.0792), CD45+ CD8+ (P = 0.0072/0.7600), CD8+ CD69+ (P = 0.0003/0.0033), CD8+ GZMB+ (P = 0.0229/0.0500), CD8+ IFNG+ (P = 0.0017/0.0495). P values were determined using a two-sided t-test. *P < 0.05, **P < 0.01, *** P < 0.001. The gating strategy are provided in Supplementary Fig. 3B. Source data and the exact cell number of each subgroup in Fig. 1C and E–H are provided as a Source Data file.
Fig. 3
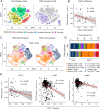
Fig. 3. TP63 expression level is negatively correlated with CD8+ T cell infiltration in ESCC patient tumors.
A t-SNE plots of 97,631 CD45- cells in 60 human ESCC tumor and 4 adjacent normal tissue samples, colored by cell types (left) or TP63 expression level (right). scRNA-seq dataset (GSE160269) and cell annotations were obtained from Zhang et al. . B Scatter plot showing a negative correlation between total T cell fraction and TP63 expression. The average TP63 expression in CD45 cells in each tumor was calculated, n = 60 independent ESCC patients. C t-SNE plots of the clustering of T cells in 9 TP63-high vs. 9 TP63-low tumor samples. D The fraction of T cell subgroups in TP63-high vs. -low ESCC tumors. E Negative correlation between CD8+ T cell fraction and TP63 expression in 76 ESCC (left), 501 LUSC (middle), and 500 HNSC (right) patient samples. The fraction in LUSC and HNSC samples were predicted by TIMER2 using TCGA expression datasets. Pearson Correlation Coefficient was calculated in B and E. The error bands show 95% confidence interval. R: Pearson’s product-moment correlation; P value: two-sided t-test.
Fig. 4
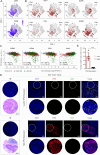
Fig. 4. Over-expression of TP63 impairs CD8+ T cells infiltration and activation.
A, B t-SNE plots showing the expression levels of CD8 (A) and cytotoxic marker genes (B) of CD8+ T cells. Cells with the expression level of cytotoxic marker genes (TPM) high than 1 was labeled. A total of 69,278 T cells from scRNA-seq of 60 ESCC patients (GSE160269) were re-analyzed. TP63 High: 9001 T cells; TP63 Low: 11,012 T cells. C Scatter plots showing the significant negative correlation between cytotoxic marker genes and TP63 expression in three types of SCC patient samples. SOX2 is shown as a positive control. The gene expression was extracted from TCGA bulk RNA-seq. n = 76 (ESCC), 500 (HNSC) and 501 (LUSC) independent patient samples, respectively. Pearson Correlation Coefficient was calculated. R: Pearson’s product-moment correlation; P value: Two-sided t-test. D, E H&E and immunofluorescence (IF) staining of TP63 and CD8 in TP63-high or -low expressing ESCC patient samples. D Representative images. Zoom-in view of the area with white circle as shown below at each right panel. White arrows denote CD8+ cells. E Quantification of infiltrated CD8+ T cells. A total of 10 slides from 10 ESCC patient samples (one slide per patient) were analyzed (TP63-low patients, n = 5; TP63-high patients, n = 5). IF images were acquired at the same exposure time. The staining results were scored by two different researchers according to the fluorescence intensity of TP63; five cases with highest TP63 scores and five with the lowest scores were defined based on the median score. Five fields representing tumor regions were randomly selected for each slide, and the number of CD8+ T cell was counted under ×20 field of view which was then averaged across 5 fields. Statistical analysis was performed by comparing the average CD8+ T cell number of each slide from five TP63-high vs. five TP63-low patients. Data represent mean ± SD. P values were determined using a two-sided t-test. P = 0.0002. ***P < 0.001.
Fig. 5
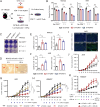
Fig. 5. Repression of TP63 results in efficient T cell killing and enhances the efficacy of PD-1 mAb therapy in murine SCC models.
A Flowchart of ex vivo co-culture of murine SCC and OT-I CD8+ T cells. B, C Relative cell viability analysis (B) and crystal violet staining (C) of SCC cells incubation with or without OT-I CD8+ T cells at the indicated effector: target (E: T) ratios. P value for each comparison from left to right in B: 0.1080 (N.S.), 0.0531 (N.S.), 0.0013 (**), 0.0005 (***), 0.0001 (***), 1.88E-05 (***), 0.0988 (N.S.), 0.0846 (N.S.), 0.0059 (**), 0.0249 (*), 5.43E-05 (***), 1.17E-05 (***). D Bright field images showing representative co-cultured MOC22 and OT-I CD8+ T cells. Red arrows indicate a cancer cell killed by activated OT-I CD8+ T cells following 48 hr co-culture (Scale bar, 10 μm). E, F Percent of GZMB and IFNγ production in Scramble or shTrp63 MOC22 (E) and AKR (F) co-cultures. P value for each comparison from left to right in E and F: 0.0467/0.0038, 0.0092/0.0020, 0.0086/0.0072, 0.0281/0.0057. The gating strategy are provided in Supplementary Fig. 6D. G, H Plots of AKR (G) and HNM007 (H) tumor volumes measured every 3 days. C57BL/6J mice were implanted with shTrp63 SCC or Scramble cells and received PD-1 mAb treatment or IgG isotype control (IgG2a). n = 5 for each group. For the tumor volume comparison of Scramble + IgG2a vs. Scramble + α-PD1, Scramble + IgG2a vs. shTrp63 + IgG2a, shTrp63 + IgG2a vs. shTrp63 + α-PD1 and Scramble + α-PD1 vs. shTrp63 + α-PD1 in AKR and HNM007-derived tumor allografts: P = 0.0176/0.0500, P = 0.0014/0.0002, 2.1E-05/.00002, 0.0002/0.0013. (I) Representative IF staining of CD8α of Scramble and shTrp63 AKR allografts, mice were treated with either PD-1 mAb or IgG isotype control (Scale bar, 50 μm). The results were repeated in three biologically independent samples. J, K Tumor growth curves of shTrp63 AKR-bearing (J; P = 0.0001) or HNM007-bearing (K; P = 0.0003) mice treated with PD-1 mAb in combination with CD8 mAb (CD8 T-cell-depletion antibody; n = 5) or IgG isotype control (IgG2b; n = 5). Bars of BF represent mean ± SD of three biologically independent experiments. P values were determined using a two-sided t -test. The data of (G, H, J, K) were analyzed by a one-sided t -test. N.S. not significant; *P < 0.05, **P < 0.01, ***P < 0.001. Source data are provided as a Source Data file.
Fig. 6
Fig. 6. TP63 suppresses ISGs by inhibiting STAT1.
A Integrative genomic viewer (IGV) tracks of ChIP-seq revealing binding peaks for STAT1 and TP63 on the promoter or enhancer loci of indicated IFN response genes. The occupancy of TP63 at the SOX2 locus is shown as a positive control. ChIP-seq data were retrieved from GSE78212, GSE46837, GSE106563, and GSE148920. Gray shadows highlighting promoter region of each gene. B TP63-interactome analysis by cross-referencing immunoprecipitation-mass spectrometry (IP-MS). Blue, green, and red dots indicate respectively solo-, duo- or trio-interacted proteins with TP63, KLF5, or SOX2. The 12 common proteins showing interaction with TP63, KLF5, and SOX2 in both datasets were listed. Data in red dotted-line rectangle were from our previous publication; SOX2-MS data was retrieved from Watanabe et al. . C Co-IP followed by Western blotting analysis showing the protein interaction between TP63 and phosphorylated STAT1 (Ser727 and Tyr701) in both human TT and murine MOC22 cells. D Representative IF staining displaying the localization of TP63 and p-STAT1 (Ser727) in MOC22 cells stimulated with IFNγ (100 ng/mL). Zoom-in view as shown on the right. The similar results were repeated in three biologically independent experiments. E, F qRT-PCR (E) and Western blotting (F) analysis revealing relative mRNA and protein levels of STAT1, TP63 and p-STAT1 in both TT and MOC22 cells expressing Scramble or shTP63/shTrp63 ± IFNγ (100 ng/mL) for 48 h. P value for the comparison from left to right in E: 0.0081, 0.0099, 0.0061, 0.0049, 0.0064, 0.0314, 0.0056, and 0.0463. G Western blotting analysis showing levels of indicated proteins. SCC cells (KYSE410 and TE1) with low expression of TP63 were transfected with TP63 over-expression (OE) or empty vector (Control) following 24 and 48 hr stimulation of IFNγ (100 ng/mL). The results were repeated with three biologically independent experiments in two cell lines. H, I qRT-PCR (H) and Western blotting (I) analysis revealing a time-dependent expression of STAT1, TP63, and p-STAT1 in TT cells in responding to the stimulation of IFNγ (100 ng/mL). P value for the comparison from left to right in H: 0.0017, 0.0020, 0.0021, 0.0013 for STAT1 expression; 0.0191, 0.0004, 0.0002, 5.08E-05 for TP63 expression. J Western blotting showing expression of STAT1, TP63, and p-STAT1 in both TT and TE5 cells treated with IFNγ (100 ng/mL) or/and Fludarabine, a STAT1-specific inhibitor. The results of panels (EH, J) were repeated with three biologically independent experiments in two cell lines. The results of panels (C, I) were repeated in four biologically independent cell lines. E, H Data represent mean ± SD of three biologically independent experiments. P values were determined using a two-sided t test. *P < 0.05, **P < 0.01, ***P < 0.001. Source data are provided as a Source Data file.
Fig. 7
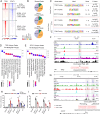
Fig. 7. Antagonistic transcription regulation between TP63 and STAT1 in SCCs.
A Density plots of ChIP-seq signals of TP63 and STAT1 at ± 3 kb windows flanking the center of TP63 peaks. Color bars at the bottom show reads-per-million-normalized signals. Data were from GSE46837, GSE106563, and GSE148920. B Pie chart showing genome-wide distribution of the regions uniquely- or co-occupied by TP63 and STAT1. C Representative top TF motif sequences enriched at TP63 or/and STAT1 uniquely- or co-occupied loci revealed by de novo motif analysis. D, E Gene Ontology (GO) functional categories of TP63 (D) or STAT1 (E) uniquely occupied peak-assigning genes in A. F, G IGV tracks from ChIP-seq data of indicated factors at either TP63 (F) or STAT1 (G) gene loci. Gray shadows highlighting enhancer or promoter elements that are co-occupied by TP63 and STAT1. Black font sequences: TP63 binding motif; Red font sequences: STAT1 binding motif. H, I Relative luciferase activity of pGL3-enhancer (1st Empty), pGL3-enhancer+STAT1 promoter, pGL3-promoter (2nd Empty), pGL3-promoter+ STAT1 enhancer, pGL3-promoter+e8 upon stimulation with IFNγ (100 ng/mL) +/− Fludarabine (10 µM) in TP63-high TE5 cells (H) or over-expression of TP63 in TP63-low TE1 cells (I). Relative luciferase activity comparison of Control vs. IFNγ, IFNγ vs. IFNγ + Fludarabine in H: P = 0.0251 (*) and P = 0.0492 (*) for STAT1-promoter group, P = 0.0037 (**) and P = 0.0213 (*) for STAT1-enhancer group, P = 0.0033 (**) and P = 0.0318 (*) for e8 group. Relative luciferase activity comparison of Control vs. OE-TP63 in I: P = 0.0137 (*) for STAT1-promoter group, P = 0.0068 (**) for STAT1-enhancer group, P = 0.0016 for e8 group. CE Statistical analysis was determined by hypergeometric test. H, I Data represent mean ± SD of three biologically independent experiments. P values were determined using a two-sided t -test. Source data are provided as a Source Data file.
Fig. 8
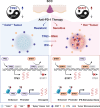
Fig. 8. Proposed model of TP63-suppressed immune response in squamous cancer.
Squamous cell master regulator TP63 represses the IFNγ signaling through antagonizing STAT1 in occupying the regulatory elements of themselves. The relative expression between STAT1 and TP63 dictates the strength of IFNγ signaling, which determines immune response by regulating CD8+ T cell activity. Inhibition of TP63 improves anti-tumor effect of PD-1 mAb therapy. The Figure was created with BioRender.com.

Similar articles

Cited by

References

    1. Jemal A, et al. Annual Report to the Nation on the Status of Cancer, 1975-2009, featuring the burden and trends in human papillomavirus(HPV)-associated cancers and HPV vaccination coverage levels. J. Natl Cancer Inst. 2013;105:175–201. doi: 10.1093/jnci/djs491. - DOI - PMC - PubMed
    1. Sung H, et al. Global Cancer Statistics 2020: GLOBOCAN Estimates of Incidence and Mortality Worldwide for 36 Cancers in 185 Countries. CA Cancer J. Clin. 2021;71:209–249. doi: 10.3322/caac.21660. - DOI - PubMed
    1. Doki Y, et al. Nivolumab combination therapy in advanced esophageal squamous-cell carcinoma. N. Engl. J. Med. 2022;386:449–462. doi: 10.1056/NEJMoa2111380. - DOI - PubMed
    1. Garon EB, et al. Pembrolizumab for the treatment of non-small-cell lung cancer. N. Engl. J. Med. 2015;372:2018–2028. doi: 10.1056/NEJMoa1501824. - DOI - PubMed
    1. Hellmann MD, et al. Nivolumab plus ipilimumab in advanced non-small-cell lung cancer. N. Engl. J. Med. 2019;381:2020–2031. doi: 10.1056/NEJMoa1910231. - DOI - PubMed

MeSH terms