. 2024 Jul;67(7):1368-1385.
doi: 10.1007/s00125-024-06128-1. Epub 2024 Mar 20.

CK2 activity is crucial for proper glucagon expression

Affiliations

CK2 activity is crucial for proper glucagon expression

Emmanuel Ampofo et al. Diabetologia. 2024 Jul.

Abstract

Aims/hypothesis: Protein kinase CK2 acts as a negative regulator of insulin expression in pancreatic beta cells. This action is mainly mediated by phosphorylation of the transcription factor pancreatic and duodenal homeobox protein 1 (PDX1). In pancreatic alpha cells, PDX1 acts in a reciprocal fashion on glucagon (GCG) expression. Therefore, we hypothesised that CK2 might positively regulate GCG expression in pancreatic alpha cells.

Methods: We suppressed CK2 kinase activity in αTC1 cells by two pharmacological inhibitors and by the CRISPR/Cas9 technique. Subsequently, we analysed GCG expression and secretion by real-time quantitative RT-PCR, western blot, luciferase assay, ELISA and DNA pull-down assays. We additionally studied paracrine effects on GCG secretion in pseudoislets, isolated murine islets and human islets. In vivo, we examined the effect of CK2 inhibition on blood glucose levels by systemic and alpha cell-specific CK2 inhibition.

Results: We found that CK2 downregulation reduces GCG secretion in the murine alpha cell line αTC1 (e.g. from 1094±124 ng/l to 459±110 ng/l) by the use of the CK2-inhibitor SGC-CK2-1. This was due to a marked decrease in Gcg gene expression through alteration of the binding of paired box protein 6 (PAX6) and transcription factor MafB to the Gcg promoter. The analysis of the underlying mechanisms revealed that both transcription factors are displaced by PDX1. Ex vivo experiments in isolated murine islets and pseudoislets further demonstrated that CK2-mediated reduction in GCG secretion was only slightly affected by the higher insulin secretion after CK2 inhibition. The kidney capsule transplantation model showed the significance of CK2 for GCG expression and secretion in vivo. Finally, CK2 downregulation also reduced the GCG secretion in islets isolated from humans.

Conclusions/interpretation: These novel findings not only indicate an important function of protein kinase CK2 for proper GCG expression but also demonstrate that CK2 may be a promising target for the development of novel glucose-lowering drugs.

Keywords: Glucagon; Glucose homeostasis; PDX1; Pancreatic alpha cells; Protein kinase CK2.


Figures

Fig. 1
Fig. 1
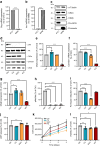
Effect of CK2 downregulation on proliferation and viability of αTC1 cells. (a, b) Quantitative analysis of Gcg (a) and Ins1 (b) mRNA expression in αTC1 and MIN6 cells (n=3 each). (c) Representative western blots of α-tubulin, CK2α, CK2β, pro-GCG and proinsulin expression from whole cell extracts of αTC1 and MIN6 cells. (d) Representative western blots of pAkt, Akt, CK2α, GAPDH and CK2β expression from whole cell extracts of WT αTC1 cells exposed to CX-4945, SGC-CK2-1 or DMSO (control) for 24 h, as well as from αTC1 KO cells. (e) Quantitative analysis of CK2α expression shown in (d) (n=3 each). (f) Quantitative analysis of Csnk2a1 mRNA expression in αTC1 cells as described in (d) (n=3 each). (g, h) Quantitative analysis of CK2β and pAkt/Akt expression shown in (d) (n=3 each). (i, j) αTC1 cells were treated as described in (d) and the viability was analysed by a WST-1 assay (i) and LDH assay (j) (n=3 each). (k, l) αTC1 cells were treated as described in (d), the cell number was determined after 1, 2 and 3 days (k) and the cell viability, measured by Trypan Blue exclusion assay, was assessed on day 3 (l) (n=3 each). Data are shown as mean ± SD. *p<0.05, **p<0.01, ***p<0.001. Ctrl, control (DMSO); CX, CX-4945; KO, αTC1 KO cells; SGC, SGC-CK2-1
Fig. 2
Fig. 2
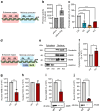
Effect of CK2 downregulation on GCG expression and secretion in αTC1 cells. (a) Representative western blots of pro-GCG and GAPDH expression from whole cell extracts of WT αTC1 cells exposed to CX-4945, SGC-CK2-1 or DMSO (control) for 24 h, as well as αTC1 KO cells. (b) Quantitative analysis of pro-GCG expression shown in (a) (n=3 each). (c) Quantitative analysis of GCG secretion (ng/l) from αTC1 cells treated as described in (a) (n=5 each). (d) Quantitative analysis of Gcg mRNA expression in αTC1 cells treated as described in (a) (n=3 each). Data are shown as mean ± SD. ***p<0.001. Ctrl, control (DMSO); CX, CX-4945; KO, αTC1 KO cells; SGC, SGC-CK2-1
Fig. 3
Fig. 3
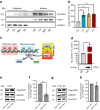
Effect of CK2 downregulation on Gcg gene expression in αTC1 cells. (a) Schematic illustration of the enhancer region (G3, G2 and G5) and the minimal promoter (G4 and G1) of the Gcg gene. (b) αTC1 cells were transfected with pGL4-Gcg or pGL4 empty vector as control for 24 h, cells were lysed and the promoter activity was detected by a luciferase assay (n=3 each). (c) αTC1 cells were transfected with pGL4-Gcg for 24 h and subsequently exposed to CX-4945, SGC-CK2-1 or DMSO (control) for 24 h; αTC1 KO cells were transfected with pGL4-Gcg for 24 h (n=3 each). The cells were lysed and the activity was detected by a luciferase assay. (d) Schematic illustration of the binding of PAX6 and MafB to the G1 element of the Gcg gene. (e) Representative western blots of nucleolin, PAX6, MafB and GAPDH expression from cytoplasmic and nuclear extracts of WT αTC1 cells and αTC1 KO cells. (fh) Quantitative analysis of cytoplasmic MafB (f), nuclear MafB (g) and nuclear PAX6 (h) expression from cells shown in (e) (n=3 each). (i, j) Representative western blots of MafB (i) and PAX6 (j) from DNA pull-down assay, together with quantitative analysis (n=3 each). Data are shown as mean ± SD. *p<0.05, **p<0.01, ***p<0.001. (a, d) Generated using Servier Medical Art, provided by Servier, licensed under a Creative Commons Attribution 3.0 unported license. Ctrl, control (DMSO); CX, CX-4945; KO, αTC1 KO cells; SGC, SGC-CK2-1
Fig. 4
Fig. 4
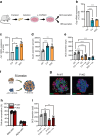
Effect of CK2 downregulation on PDX1-mediated Gcg gene expression in αTC1 cells. (a) Representative western blots of nucleolin, PDX1 and GAPDH expression from cytoplasmic and nuclear extracts of WT αTC1 cells exposed to CX-4945, SGC-CK2-1 or DMSO (control) for 24 h, as well as αTC1 KO cells. (b) Quantitative analysis of nuclear PDX1 expression from cells shown in (a) (n=3 each). (c) Schematic illustration of the orchestrated dissociation of PAX6 and MafB and CK2-mediated binding of PDX1 to the G1 element of the Gcg gene. (d) Representative western blot of PDX1 from a DNA pull-down assay and quantitative analysis of PDX1 from the indicated western blot (n=3 each). (e) Representative western blots of Flag-PDX1, GAPDH and pro-GCG expression from whole cell extracts of αTC1 cells overexpressing PDX1 WT or PDX1 Mut. (f) Quantitative analysis of pro-GCG expression from cells shown in (e) (n=3 each). (g). Representative western blots of Flag-PDX1, GAPDH and pro-GCG expression from whole cell extracts of αTC1 KO cells overexpressing PDX1 WT or PDX1 Mut. (h) Quantitative analysis of pro-GCG from cells shown in (g) (n=3 each). Data are shown as mean ± SD. *p<0.05,***p<0.001. (c) Generated using Servier Medical Art, provided by Servier, licensed under a Creative Commons Attribution 3.0 unported license. Ctrl, control (DMSO); CX, CX-4945; INS, insulin; KO, αTC1 KO cells; SGC, SGC-CK2-1
Fig. 5
Fig. 5
Effect of CK2 downregulation on insulin and GCG secretion ex vivo. Schematic illustration of the murine islet isolation procedure, exposure to the inhibitors and the analyses of endocrine function. (b, c) Quantitative analysis of Gcg (b) and Ins1 (c) mRNA expression in isolated murine islets exposed to CX-4945, SGC-CK2-1 or DMSO (control) for 24 h (n=3 each). (d) Quantitative analysis of insulin secretion (pmol/l) from isolated murine islets (10 islets per well of 24 well plate) treated as described in (b) (n=5 each). (e) Quantitative analysis of GCG secretion (ng/l) from isolated murine islets (20 islets per well of a 24 well plate) exposed to CX-4945, CX-4945 + linsitinib, SGC-CK2-1, SGC + linsitinib, DMSO (control) or DMSO + linsitinib for 24 h (n=5 each). (f) Schematic illustration of PI formation from MIN6 cells and αTC1 cells (PI WT) or MIN6 cells and αTC1 KO cells (PI KO). (g) Representative immunofluorescence staining of insulin (green) and GCG (red) in PI WT and PI KO. Cell nuclei were stained with Hoechst 33342 (blue). Scale bar, 75 µm. (h) Quantitative analysis of insulin- (beta cells) and GCG- (alpha cells) positive cells (expressed as % of all PI cells) in PI WT and PI KO (n=20 each). (i) Quantitative analysis of GCG secretion (ng/l) from PI WT, PI WT exposed to linsitinib, PI KO and PI KO exposed to linsitinib (n=5 each). Data are shown as mean ± SD. *p<0.05, **p<0.01, ***p<0.001. (a, f) Generated using Servier Medical Art, provided by Servier, licensed under a Creative Commons Attribution 3.0 unported license. Ctrl, control (DMSO); CX, CX-4945; KO, αTC1 KO cells; INS, insulin; Lin, linsitinib; SGC, SGC-CK2-1
Fig. 6
Fig. 6
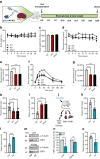
Effect of CK2 downregulation on blood glucose, hormone secretion and FBP1 expression in mice. (a) Schematic illustration of the experimental setting. On day 0, αTC1 cells (WT or KO) were transplanted under the left kidney capsule of mice. Sham-transplanted mice served as negative control. Fasting blood glucose levels and body weights were measured over 28 days twice a week. On day 28, IPGTT was performed. (b) Body weight of mice transplanted with WT or KO cells from day 0 to day 28 (n=6 each). Sham-transplanted mice served as negative control (n=5 each). (c) AUC of the body weights shown in (b). (d) Blood glucose levels of mice transplanted with WT or KO cells from day 0 to day 28 (n=6 each). Sham-transplanted mice served as negative control (n=5 each). (e) AUC of the blood glucose levels shown in (d). (f) Quantitative analysis of blood glucose levels on day 28 according to the IPGTT of mice transplanted with WT or KO cells (n=6 each). Sham-transplanted mice served as negative control (n=5 each). (g) AUC of IPGTT results shown in (f). (h) Quantitative analysis of GCG secretion of mice transplanted with WT or KO cells (n=8 each). Sham-transplanted mice served as negative control (n=8 each). (i) Quantitative analysis of insulin secretion of mice transplanted with WT or KO cells (n=3 each). Sham-transplanted mice served as negative control (n=3 each). (j) Schematic illustration of the experimental setting. Mice were treated for 3 days with CX-4945 or DMSO (control) and blood, kidney and liver samples were collected to study GCG and insulin secretion and FBP1 expression. (k) Quantitative analysis of GCG secretion of mice treated with CX-4945 or DMSO (control) (n=3 each). (l) Quantitative analysis of insulin secretion of mice treated with CX-4945 or DMSO (control) (n=3 each). (m) Representative western blots of FBP1 and α-tubulin expression from liver and kidney tissue extracts. (n, o) Quantitative analysis of FBP1 from data shown in (m) (n=2 or 3 each). Data are shown as mean ± SEM. *p<0.05, **p<0.01, ***p<0.001. (a, j) Generated using Servier Medical Art, provided by Servier, licensed under a Creative Commons Attribution 3.0 unported license. Ctrl, control (DMSO); CX, CX-4945; INS, insulin
Fig. 7
Fig. 7
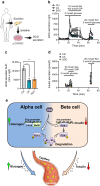
Effect of CK2 downregulation on GCG secretion from isolated human islets. (a) Schematic illustration of the human islet isolation procedure, exposure to the inhibitors and the analysis of the endocrine function. (b) Human isolated islets (n=3 donors) were exposed to CX-4945, SGC-CK2-1 or DMSO (control) for 24 h and GCG secretion was analysed at the indicated time points; changes in glucose, secretagogues and KCl were as indicated. (c) AUC of the blood glucose levels shown in (b). (d) Human isolated islets (n=3 donors) were exposed to CX-4945, SGC-CK2-1 or DMSO (control) for 24 h and insulin secretion was analysed at the indicated time points; changes in glucose, secretagogues and KCl were as indicated. Data are shown as mean ± SEM. **p<0.01 (e) The yin/yang hypothesis of the effects of CK2 on PDX1 and hormone secretion in alpha and beta cells. CK2 phosphorylates PDX1, which promotes its degradation and reduces its transcriptional activity. This results in a decreased binding of PDX1 to the insulin promoter and, thus, a decrease in insulin secretion in beta cells. In alpha cells, the CK2-dependent PDX1 phosphorylation contributes to the very low expression level of this transcription factor. This, in turn, promotes the binding of MafB and PAX6 to the Gcg promoter. Taken together, by this mechanism, CK2 is involved in the regulation of glucose homeostasis. (a, e) Generated using Servier Medical Art, provided by Servier, licensed under a Creative Commons Attribution 3.0 unported license. Ctrl, control (DMSO); CX, CX-4945; SGC, SGC-CK2-1

Similar articles

References

    1. Tokarz VL, MacDonald PE, Klip A. The cell biology of systemic insulin function. J Cell Biol. 2018;217(7):2273–2289. doi: 10.1083/jcb.201802095. - DOI - PMC - PubMed
    1. MacDonald PE, Rorsman P. Metabolic messengers: glucagon. Nat Metab. 2023;5(2):186–192. doi: 10.1038/s42255-022-00725-3. - DOI - PubMed
    1. Ebrahim N, Shakirova K, Dashinimaev E. PDX1 is the cornerstone of pancreatic beta-cell functions and identity. Front Mol Biosci. 2022;9:1091757. doi: 10.3389/fmolb.2022.1091757. - DOI - PMC - PubMed
    1. Iwaoka R, Kataoka K. Glucose regulates MafA transcription factor abundance and insulin gene expression by inhibiting AMP-activated protein kinase in pancreatic beta-cells. J Biol Chem. 2018;293(10):3524–3534. doi: 10.1074/jbc.M117.817932. - DOI - PMC - PubMed
    1. Wang W, Shi Q, Guo T, et al. PDX1 and ISL1 differentially coordinate with epigenetic modifications to regulate insulin gene expression in varied glucose concentrations. Mol Cell Endocrinol. 2016;428:38–48. doi: 10.1016/j.mce.2016.03.019. - DOI - PubMed