. 2024 Mar 18;14(1):6423.
doi: 10.1038/s41598-024-57139-2.

Analysis and experimental validation of IL-17 pathway and key genes as central roles associated with inflammation in hepatic ischemia-reperfusion injury

Affiliations

Analysis and experimental validation of IL-17 pathway and key genes as central roles associated with inflammation in hepatic ischemia-reperfusion injury

Siyou Tan et al. Sci Rep. .

Abstract

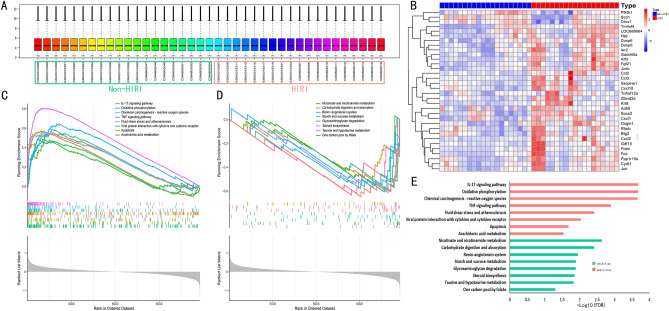
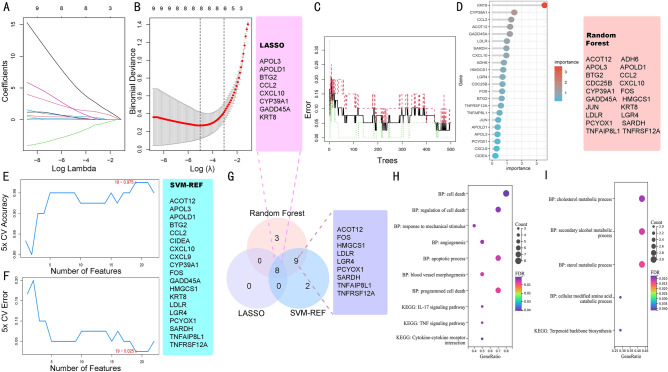
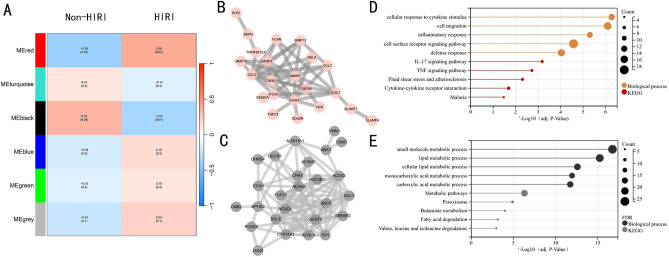
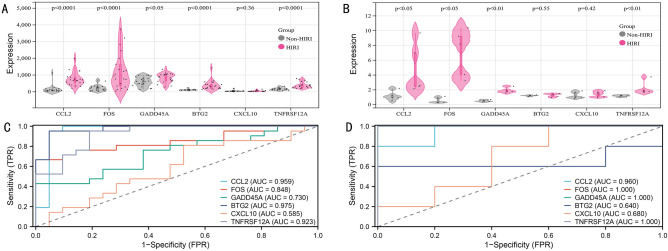
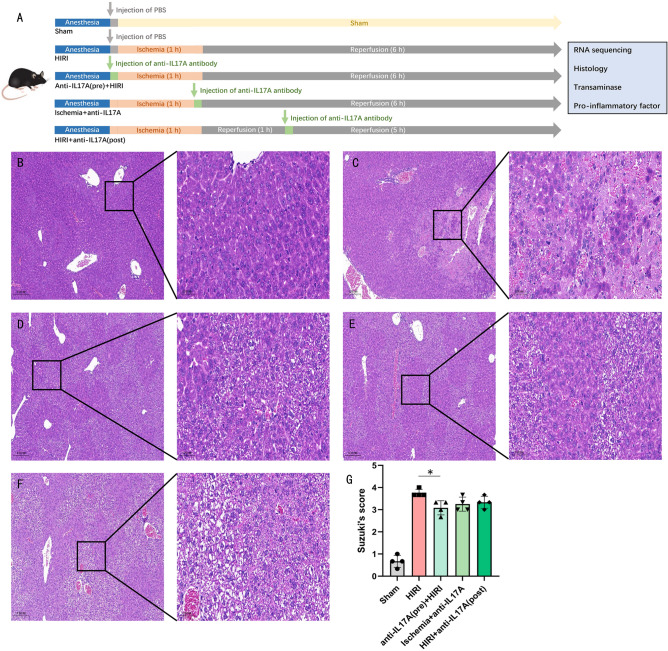
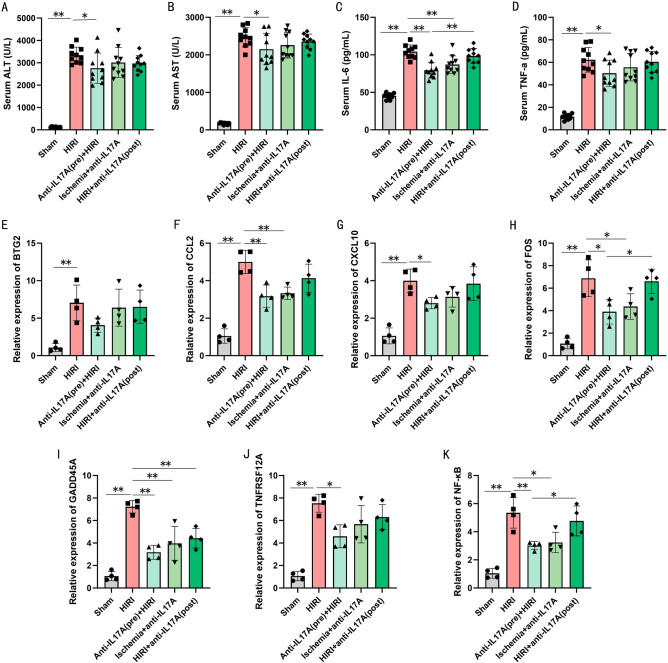
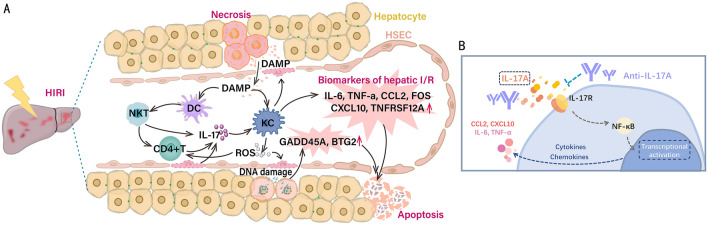
Hepatic ischemia-reperfusion injury (HIRI) elicits an immune-inflammatory response that may result in hepatocyte necrosis and apoptosis, ultimately culminating in postoperative hepatic dysfunction and hepatic failure. The precise mechanisms governing the pathophysiology of HIRI remain incompletely understood, necessitating further investigation into key molecules and pathways implicated in disease progression to guide drug discovery and potential therapeutic interventions. Gene microarray data was downloaded from the GEO expression profile database. Integrated bioinformatic analyses were performed to identify HIRI signature genes, which were subsequently validated for expression levels and diagnostic efficacy. Finally, the gene expression was verified in an experimental HIRI model and the effect of anti-IL17A antibody intervention in three time points (including pre-ischemic, post-ischemic, and at 1 h of reperfusion) on HIRI and the expression of these genes was investigated. Bioinformatic analyses of the screened characterized genes revealed that inflammation, immune response, and cell death modulation were significantly associated with HIRI pathophysiology. CCL2, BTG2, GADD45A, FOS, CXCL10, TNFRSF12A, and IL-17 pathway were identified as key components involved in the HIRI. Serum and liver IL-17A expression were significantly upregulated during the initial phase of HIRI. Pretreatment with anti-IL-17A antibody effectively alleviated the damage of liver tissue, suppressed inflammatory factors, and serum transaminase levels, and downregulated the mRNA expression of CCL2, GADD45A, FOS, CXCL10, and TNFRSF12A. Injection of anti-IL17A antibody after ischemia and at 1 h of reperfusion failed to demonstrate anti-inflammatory and attenuating HIRI benefits relative to earlier intervention. Our study reveals that the IL-17 pathway and related genes may be involved in the proinflammatory mechanism of HIRI, which may provide a new perspective and theoretical basis for the prevention and treatment of HIRI.

Keywords: Bioinformatics; Chemokines; Cytokines; Hepatic ischemia–reperfusion injury; IL-17; Inflammation.


Conflict of interest statement

The authors declare no competing interests.

Figures

Figure 1
Figure 1
Gene set enrichment analysis. (A) Gene expression level statistics of the integrated dataset after removing batch effect. (B) The heatmap of HIRI-related gene expression levels. (C) The main biological pathways that are significantly enriched in the HIRI group. (D) The main biological pathways are significantly enriched in the non-HIRI group. (E) The main biological pathways are significantly enriched in the non-HIRI group and HIRI group.
Figure 2
Figure 2
LASSO, RF, and SVM-RFE algorithms were integrated to identify the feature genes. (A) LASSO coefficient profiles of the candidate feature genes and the optimal lambda were determined when the partial likelihood deviance reached the minimum value. Each coefficient curve in the left picture represents a single gene. (B) The solid vertical lines represent the partial likelihood of deviance, and the number of genes (n = 8) corresponding to the lowest point of the cure is the most suitable for LASSO. (C) RF for the relationships between the number of trees and error rate. The x-axis represents the number of decision trees, and the y-axis is the error rate. (D) The relative importance of candidate genes is calculated in random forest. (E,F) The SVM-RFE algorithm was used to further candidate feature genes with the highest accuracy and lowest error obtained in the curves. The x-axis shows the number of feature selections, and the y-axis shows the prediction accuracy or prediction error. (G) Venn diagram showing the 17 overlapping feature genes shared by any two algorithms. (H) Functional enrichment analysis of the upregulated overlapping genes. (I) Functional enrichment analysis of the downregulated overlapping genes.
Figure 3
Figure 3
Weighted gene co-expression network analysis. (A) Heat map of module–trait correlations. Red represents positive correlations, and blue represents negative correlations. (B) The PPI network of the red module. (C) The PPI network of the black module. (D) Functional annotation of the red module. (E) Functional annotation of the black module.
Figure 4
Figure 4
Identification of the potential genes in HIRI. (A) The volcano plot of HIRI-related DEG expression (Filter threshold: P < 0.05 AND |logFC|> 0.5). (B,C) Biological process and KEGG analysis of DEGs. (D) Venn diagram summarizing machine learning algorithms, WGCNA, and DEGs. (E) Functional enrichment analysis of 21 overlapping genes. (F) The PPI network of the potential genes, based on the CytoHubba algorithm, visualizes the importance of genes according to the node's size. (G) GeneMANIA analyzed the potential genes and their co-expression genes. (H) Verification of expression level of the potential genes in HIRI. (I) Estimating the diagnostic performance of the potential genes.
Figure 5
Figure 5
External validation of potential gene expression and diagnostic efficacy. (A) Expression levels of potential genes were verified using the GSE12720 dataset. (B) Validation of expression levels of potential genes using the GSE14951 dataset. (C) Validation of diagnostic efficacy of potential genes using the GSE12720 dataset. (D) Validation of diagnostic efficacy of potential genes using the GSE14951 dataset.
Figure 6
Figure 6
Serum levels and tissue expression of IL-17A in different stages of HIRI. (A) Pattern diagram of the experiment. (B) Serum levels of IL-17A at the ischemic stage of HIRI and 1 h, 2 h, 4 h, and 6 h of liver reperfusion (n = 4, each group). (C) Expression of IL-17A mRNA in liver tissues during the ischemic phase of HIRI and at 1 h, 2 h, 4 h, and 6 h of liver reperfusion (n = 4, each group). *P < 0.05 and **P < 0.01. All data are representative of 3 replicate experiments.
Figure 7
Figure 7
Inhibition of IL-17A ameliorates liver tissue damage after HIRI. (A) Pattern diagram of the experiment. (BF) Representative image of H&E staining of liver tissues in the sham group (B), HIRI group (C), anti-IL-17A (pre) + HIRI group (D), ischemia + anti-IL17A group (E), and HIRI + anti-IL17A (post) group (F). (G) Suzuki’s quantitative score of the groups. Data results are expressed as mean ± SD (n = 4, each group). *P < 0.05 and **P < 0.01. All data are representative of 3 replicate experiments.
Figure 8
Figure 8
Inhibition of IL-17A reduces the expression of the potential gene and inflammatory response. (AD) Serum level of ALT (A), AST (B), IL-6 (C), and TNF-α (D), (n = 10, each group). (EK) Relative mRNA expression of BTG2 (E), CCL2 (F), CXCL10 (G), FOS (H), GADD45A (I), TNFRSF12A (J), and NF-κB (K), (n = 4, each group). Data results are expressed as mean ± SD. *P < 0.05 and **P < 0.01. All data are representative of 3 replicate experiments.
Figure 9
Figure 9
The mechanisms underlying microenvironment remodeling and the IL-17 pathway that are implicated in the pathophysiology of the HIRI. (A) The degeneration and necrosis of liver tissue cells during HIRI release a series of endogenous components such as DAMPs, including a variety of nuclear proteins, cytoplasmic proteins, and cytosolic components, which bind to pattern recognition receptors on the membrane surface of immune cells to promote inflammatory immune activation and the downstream pathway to produce a series of pro-inflammatory cytokines and chemokines. Meanwhile, the captured or recognized DAMPs mediate the activation of various immune cells, such as NKT cells and T cells, through the antigen presentation of dendritic cells, and the activated immune cells contribute to the inflammatory signaling cascade through the production and secretion of IL-17 to form an inflammatory storm, leading to the acceleration of the programmed cell death process. In addition, activated macrophages produce ROS, which can further induce the death of liver sinusoidal endothelial cells and other tissue cells, causing upregulation of the expression of DNA damage markers GADD45A and BTG2, creating a vicious cycle. (B) Anti-IL-17A antibody inhibits IL-17A binding to the receptor through neutralization. The receptor acts by activation of downstream NF-κB pathway, which ultimately downregulates the expression of disease-related genes, cytokines, and chemokines. DAMP damage-associated molecular pattern, DC dendritic cell, NKT natural killer T cell, ROS reactive oxygen species, KC Kupffer cells, HSEC hepatic sinusoidal endothelial cells, NF-κB nuclear factor-kappa B.

Similar articles

References

    1. Song D, Li C, Zhu M, Chi S, Liu Z. Tracking hepatic ischemia-reperfusion injury in real time with a reversible NIR-IIb fluorescent redox probe. Angew. Chem. Int. Ed. Engl. 2022;61:e202212721. doi: 10.1002/anie.202212721. - DOI - PubMed
    1. Huang M, et al. Natural killer cells in hepatic ischemia-reperfusion injury. Front. Immunol. 2022;13:870038. doi: 10.3389/fimmu.2022.870038. - DOI - PMC - PubMed
    1. Peng Y, et al. Role of hepatic stellate cells in liver ischemia-reperfusion injury. Front. Immunol. 2022;13:891868. doi: 10.3389/fimmu.2022.891868. - DOI - PMC - PubMed
    1. Langfelder P, Horvath S. WGCNA: An R package for weighted correlation network analysis. BMC Bioinform. 2008;9:559. doi: 10.1186/1471-2105-9-559. - DOI - PMC - PubMed
    1. Sepulveda JL. Using R and bioconductor in clinical genomics and transcriptomics. J. Mol. Diagn. 2020;22:3–20. doi: 10.1016/j.jmoldx.2019.08.006. - DOI - PubMed

MeSH terms