. 2024 Mar 16;15(1):2381.
doi: 10.1038/s41467-024-46786-8.

Rapid evolution of an adaptive multicellular morphology of Candida auris during systemic infection

Affiliations

Rapid evolution of an adaptive multicellular morphology of Candida auris during systemic infection

Jian Bing et al. Nat Commun. .

Abstract

Candida auris has become a serious threat to public health. The mechanisms of how this fungal pathogen adapts to the mammalian host are poorly understood. Here we report the rapid evolution of an adaptive C. auris multicellular aggregative morphology in the murine host during systemic infection. C. auris aggregative cells accumulate in the brain and exhibit obvious advantages over the single-celled yeast-form cells during systemic infection. Genetic mutations, specifically de novo point mutations in genes associated with cell division or budding processes, underlie the rapid evolution of this aggregative phenotype. Most mutated C. auris genes are associated with the regulation of cell wall integrity, cytokinesis, cytoskeletal properties, and cellular polarization. Moreover, the multicellular aggregates are notably more recalcitrant to the host antimicrobial peptides LL-37 and PACAP relative to the single-celled yeast-form cells. Overall, to survive in the host, C. auris can rapidly evolve a multicellular aggregative morphology via genetic mutations.


Conflict of interest statement

Clarissa J. Nobile is a cofounder of BioSynesis, Inc., a company developing diagnostics and therapeutics for biofilm infections. All other authors declare no conflicts of interest.

Figures
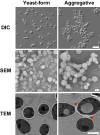
Fig. 1
Fig. 1. Yeast-form and aggregative morphologies of a clinical isolate of C. auris.
Strain used: AR0386 and AR0386A. C. auris cells were plated onto YPD plates at 30 °C for 4 days. DIC differential interference contrast, SEM scanning electron microscopy, TEM transmission electron microscopy. Red arrows indicate intercellular septa. Scale bar for DIC, 10 μm; for SEM and TEM, 2 μm.
Fig. 2
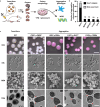
Fig. 2. Experimental evolution of a typical yeast-form strain of C. auris into a multicellular aggregative morphology.
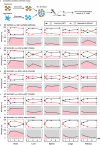
a Schematic of aggregative colony acquisition from a mouse systemic infection system. Six-week-old mice were injected with the yeast-form cells of C. auris via the tail vein. Fungal cells were recovered from the brain, liver, spleen, lung, and kidney tissues after 3 days post infection (dpi) and plated onto YPD medium plates containing the red dye phloxine B. Pink, rough or wrinkled colonies containing aggregative cells were subject to microscopy assays and whole genome sequencing (WGS). b Number of evolved aggregative C. auris strains isolated from different mouse organs. In total, 113 aggregative mutant strains were obtained. Of them, 96 strains (black rectangles) were isolated from the brain, liver, spleen, lung, and kidney tissues of 28 mice and 17 strains (gray rectangle) were isolated from the brain tissue of 12 mice. Detailed strain information is presented in Tables S1, S2, and Dataset S1. c Colony and cellular morphologies of the WT (BJCA001) and four representative aggregative strains evolved during mouse systemic infections. CHS1 p.Q826* (FDAG4), BNI1 p.206 fs (FDAG30), LRG1 p.K427* (FDAG9), and CAS4 p.1288 fs (FDAG1) represent the four evolved strains with mutations in CHS1, BNI1, LRG1, or CAS4, respectively. C. auris cells were plated onto YPD plates supplemented with phloxine B at 30 °C for 4 days. *, nonsense mutations; fs, frameshift mutations. Red arrows indicate intercellular septa. Scale bar for colony, 5 mm; for DIC morphology, 10 μm; for SEM and TEM morphologies, 2 μm.
Fig. 3
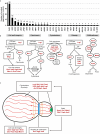
Fig. 3. Mutated genes of evolved aggregative strains are involved in the regulation of cell division, cytoskeletal properties and cellular polarity.
These genes were independently identified from different evolved aggregative mutant strains. a Number of isolates for each gene mutation. All aggregative mutant strains were recovered from mouse organs initially infected with yeast-form C. auris cells (as shown in Fig. 2). The mutated loci were identified by comparing the genomic sequences of the mutant strains with those of the yeast-form parent strain. b Major biological processes or signaling pathways of the mutated genes (highlighted in red) of the evolved aggregative strains. Cell wall integrity pathway: 14 mutations were identified, including mutations in genes encoding chitin synthase Chs1, GTPase regulator Lrg1, MAPK proteins Dig2, and several cell wall proteins. Cytokinesis: 7 mutations were identified, including mutations in LRG1 and genes encoding the formin protein Bni1, F-BAR protein Hof1, and IQGAP protein. Actin cable and cytoskeleton: 8 mutations were identified, including mutations in genes encoding components of the actin cytoskeleton-regulatory complex Pan1, clathrin and adaptor complex (Apl2, Apl4, Apm1), and the Arp2/3 complex (Arc19). Cellular polarity: 6 mutations were identified, including mutations in LRG1, BNI1, and genes encoding kinases Kin3 and Hsl1 associated with septin formation. RAM pathway: 13 mutations were identified, including mutations in ACE2, CBK1, MOB2, HYM1, KIC1, and CAS4. c Schematic model indicates the cellular functions of the identified mutated genes. Most mutated genes are involved in the regulation of cell budding and/or cell division. The blue strip indicates the septum; red lines indicate actin cables involved in exocytosis; red circles indicate actin patches involved in endocytosis; orange circles indicate septin double rings in endocytosis; the green solid circle indicates protein Bni1; and the peripheral shadow layer indicates the cell wall. Mutated genes identified in this study are highlighted in red. The mutated genes/pathways identified in this study are interconnected and several genes are involved in the regulation of multiple processes. Note that the biological processes or signaling pathways of the C. auris mutated genes shown were predicted based on homology to their S. cerevisiae or C. albicans counterparts (b) and (c).
Fig. 4
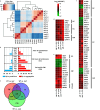
Fig. 4. Analysis of differentially expressed genes among the yeast-form strain and evolved aggregative isolates of C. auris.
Strains analyzed: BJCA001 (yeast-form), CHS1 p.Q826* (chs1, FDAG4), BNI1 p.206 fs (bni1, FDAG30), LRG1 p.K427* (lrg1, FDAG9), and CAS4 p.1288 fs (cas4, FDAG1). a Hierarchical clustering of differentially expressed genes (DEGs) between different strains using Euclidean distance. b Numbers of DEGs associated with CWI, cytoskeleton, and cell cycle/cytokinesis regulation between the yeast-form strain and CHS1 p.Q826*, BNI1 p.206 fs, LRG1 p.K427*, or CAS4 p.1288 fs mutants. c Venn plot of DEGs between the yeast-form strain and BNI1 p.206 fs, LRG1 p.K427*, or CAS4 p.1288 fs mutants. d Representative common DEGs among the CHS1 p.Q826*, BNI1 p.206 fs, LRG1 p.K427*, and CAS4 p.1288 fs mutants. e Representative common DEGs among the BNI1 p.206 fs, LRG1 p.K427*, and CAS4 p.1288 fs mutants. f Representative common DEGs between the LRG1 p.K427* and CAS4 p.1288 fs mutants. Log2 (fold change) values of DEGs between the yeast-form strain and corresponding mutant strains are shown in (d)–(f).
Fig. 5
Fig. 5. Comparative analyses of fitness and virulence of the yeast-form and aggregative cells using a competing mouse systemic infection model.
a Schematic of the systemic infection assay. To convert to separated single cells for systemic infections, C. auris aggregative cells were subjected to sonication. To control for any potential negative effects of sonication, yeast-form cells were also treated with the same sonication protocol. Fungal cells (1 × 10⁷) were injected into each mouse via the tail vein. At 1, 3, or 7 dpi, fungal cells were recovered from the brain, liver, spleen, lung, and kidney tissues, weighed, and pulverized using Zirconia beads (3.2 mm) with 60 Hz power for 120 s. The homogenized samples were then re-plated onto YPD medium plates containing the red dye phloxine B. CFU assays (per gram organ) were performed. bf Comparison of fungal burdens of the WT and evolved mutant strains in different mouse organs (4 mice per strain were used for each time point). b WT (yeast-form, AR0386) versus SSD1 p.R549K (AR0386A). Strains AR0386 and AR0386A were isolated from the same patient. cf WT (yeast-form, BJCA001) versus CHS1 p.Q826* (FDAG4), BNI1 p.206 fs (FDAG30), LRG1 p.K427* (FDAG9), and CAS4 p.1288 fs (FDAG1). The P value was determined by two-tailed paired Student’s t-tests. *P < 0.05; **P < 0.01; ***P < 0.001. Data shown represents mean ± SD.
Fig. 6
Fig. 6. Competitive fitness and virulence assays of the C. auris yeast-form and aggregative cells.
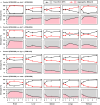
a Schematic of the competitive infection assays. Yeast-form and aggregative cells were first subject to sonication. Equal numbers of single cells of the two morphologies (5 × 10⁶ yeast-form cells + 5 × 10⁶ aggregative cells) were mixed and injected into the mice via the tail vein. At 1, 3, or 7 dpi, fungal cells were recovered from the brain, liver, spleen, lung, and kidney tissues, weighed, and pulverized using Zirconia beads (3.2 mm) with 60 Hz power for 120 s. The homogenized samples were then re-plated onto YPD medium plates containing the red dye phloxine B. CFU assays (per gram organ) were performed. Colonies formed by yeast-form and aggregative cells could be easily distinguished by their morphologies and coloration (Fig. S1). bf Percentages of the yeast-form (WT) and aggregative (evolved mutant) strain cells in different mouse organs based on CFU assays (4 mice per strain were used for each time point). b WT (yeast-form, AR0386) versus SSD1 p.R549K (AR0386A); cf WT (yeast-form, BJCA001) versus CHS1 p.Q826* (FDAG4), BNI1 p.206 fs (FDAG30), LRG1 p.K427* (FDAG9), and CAS4 p.1288 fs (FDAG1). Data shown represents mean ± SD.
Fig. 7
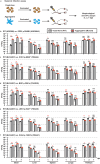
Fig. 7. Constructed mutant strains via deletion or amino acid substitution exhibited similar phenotypes and competitive fitness levels to those of the evolved strains.
ad Percentages of C. auris cells of the control (yeast-form) and deletion mutant (aggregative) strains in different mouse organs based on CFU assays (4 mice per strain were used for each time point). Strains used: control (FDBJ292), chs1- (FDBJ282, a), bni1- (FDBJ286, b), LRG1 p.K427* (FDBJ333, c), and cas4- (FDBJ288, d). Competitive fitness and virulence assays were performed as described in Fig. 6. Line plot (upper graph) and area plot (lower graph) for each group are shown to display the proportions of yeast-form and aggregative cells. Two-tailed paired Student’s t-tests were used to assess significance. Data shown represents mean ± SD.
Fig. 8
Fig. 8. Comparative analysis of in vitro susceptibility of C. auris yeast-form and aggregative cells to host antimicrobial peptides LL-37 and PACAP.
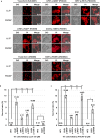
Strains used: BJCA001 (yeast-form), FDAG4 (CHS1 p.Q826*), FDAG30 (BNI1 p.206 fs), FDAG9 (LRG1 p.K427*), FDAG1 (CAS4 p.1288 fs), AR0386 (yeast-form), and AR0386A (SSD1 p.R549K). a PI staining for antimicrobial killing assays. Yeast-form (BJCA001 and AR0386) or evolved aggregative (SSD1 p.R549K, CHS1 p.Q826*, BNI1 p.206 fs, LRG1 p.K427*, CAS4 p.1288 fs) strains (1 ×10⁷ cells/mL) were resuspended in 1 mM potassium phosphate buffer (PPB). C. auris cells were incubated with 10 µM LL-37 or 5 µM PACAP for 1 h at 37 °C. Treated cells were collected, washed, and stained with PI. b, c Quantitative antimicrobial killing assays (n = 3). C. auris cells (1 ×10⁷ cells/mL) were resuspended in 1 mM PPB. Half of the cells were subjected to sonication and plated for CFUs. The other half of the cells were treated with 10 µM LL-37 (b) or 5 µM PACAP (c) for 1 h at 37 °C, respectively. Treated fungal cells were sonicated, diluted, and plated onto YPD medium for CFU analysis. The survival rate (%) of each strain was calculated. WT1: BJCA001, WT2: AR0386. The P value was determined by two-tailed paired Student’s t-tests. *P < 0.05; **P < 0.01; ***P < 0.001. Data shown represents mean ± SD.

Similar articles

Cited by

References

    1. Satoh K, Makimura K, Hasumi Y, Nishiyama Y, Uchida K, Yamaguchi H. Candida auris sp nov., a novel ascomycetous yeast isolated from the external ear canal of an inpatient in a Japanese hospital. Microbiol. Immunol. 2009;53:41–44. doi: 10.1111/j.1348-0421.2008.00083.x. - DOI - PubMed
    1. Du H, Bing J, Hu T, Ennis CL, Nobile CJ, Huang G. Candida auris: Epidemiology, biology, antifungal resistance, and virulence. PLoS Pathog. 2020;16:e1008921. doi: 10.1371/journal.ppat.1008921. - DOI - PMC - PubMed
    1. Chowdhary A, Jain K, Chauhan N. Candida auris genetics and emergence. Annu. Rev. Microbiol. 2023;77:583–602. doi: 10.1146/annurev-micro-032521-015858. - DOI - PubMed
    1. WHO. WHO Fungal Priority Pathogens List to Guide Research, Development and Public Health Action. WHO https://www.who.int/publications/i/item/9789240060241 (2022).
    1. Stewart MK, Cookson BT. Non-genetic diversity shapes infectious capacity and host resistance. Trends Microbiol. 2012;20:461–466. doi: 10.1016/j.tim.2012.07.003. - DOI - PMC - PubMed

Substances