Review
. 2024 Mar;102(3):e25318.
doi: 10.1002/jnr.25318.

Functional neuroanatomy of basal forebrain projections to the basolateral amygdala: Transmitters, receptors, and neuronal subpopulations

Affiliations
Review

Functional neuroanatomy of basal forebrain projections to the basolateral amygdala: Transmitters, receptors, and neuronal subpopulations

Alexander Joseph McDonald. J Neurosci Res. 2024 Mar.

Abstract

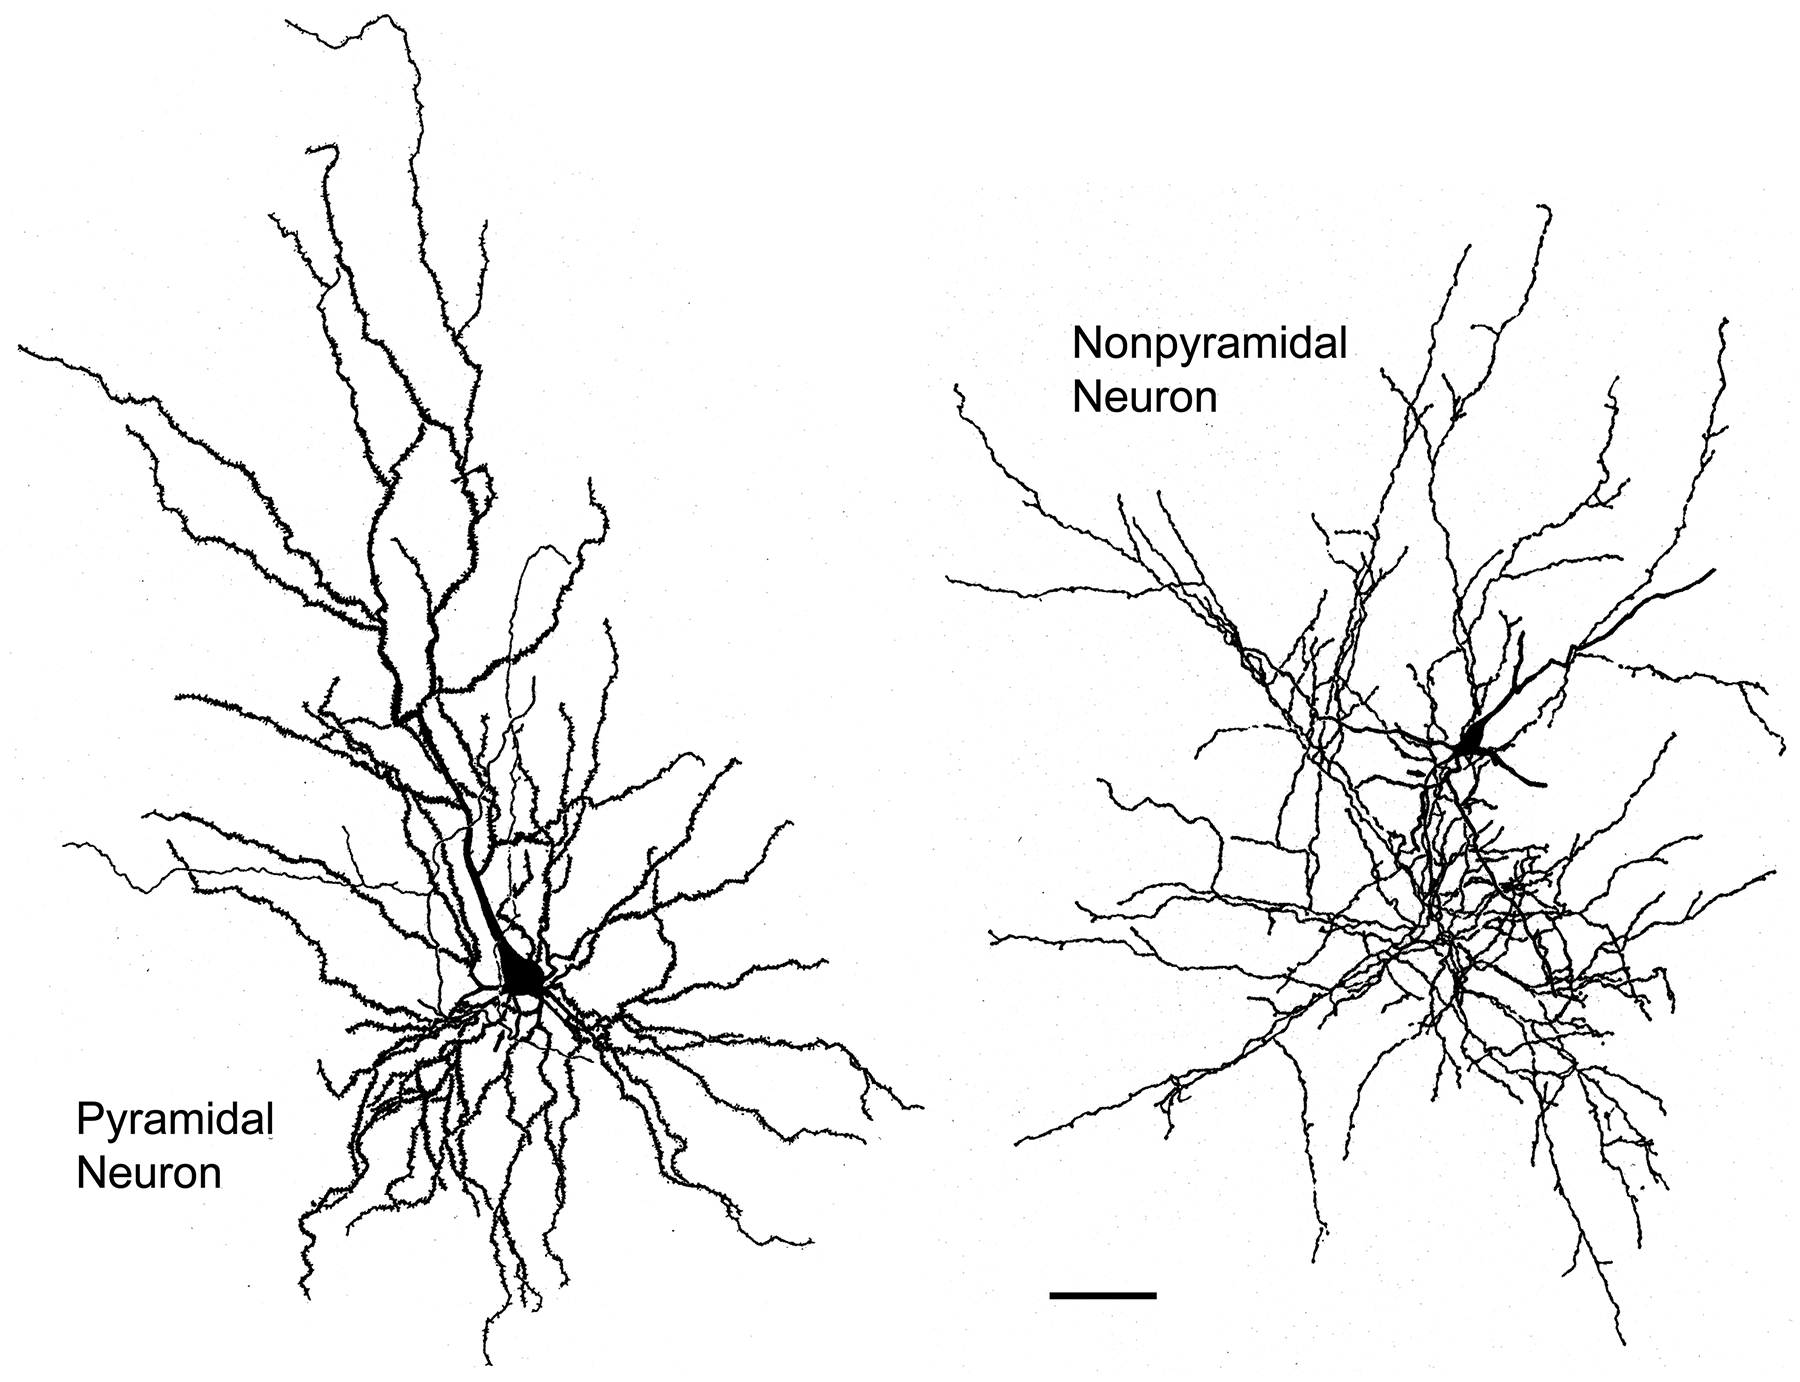
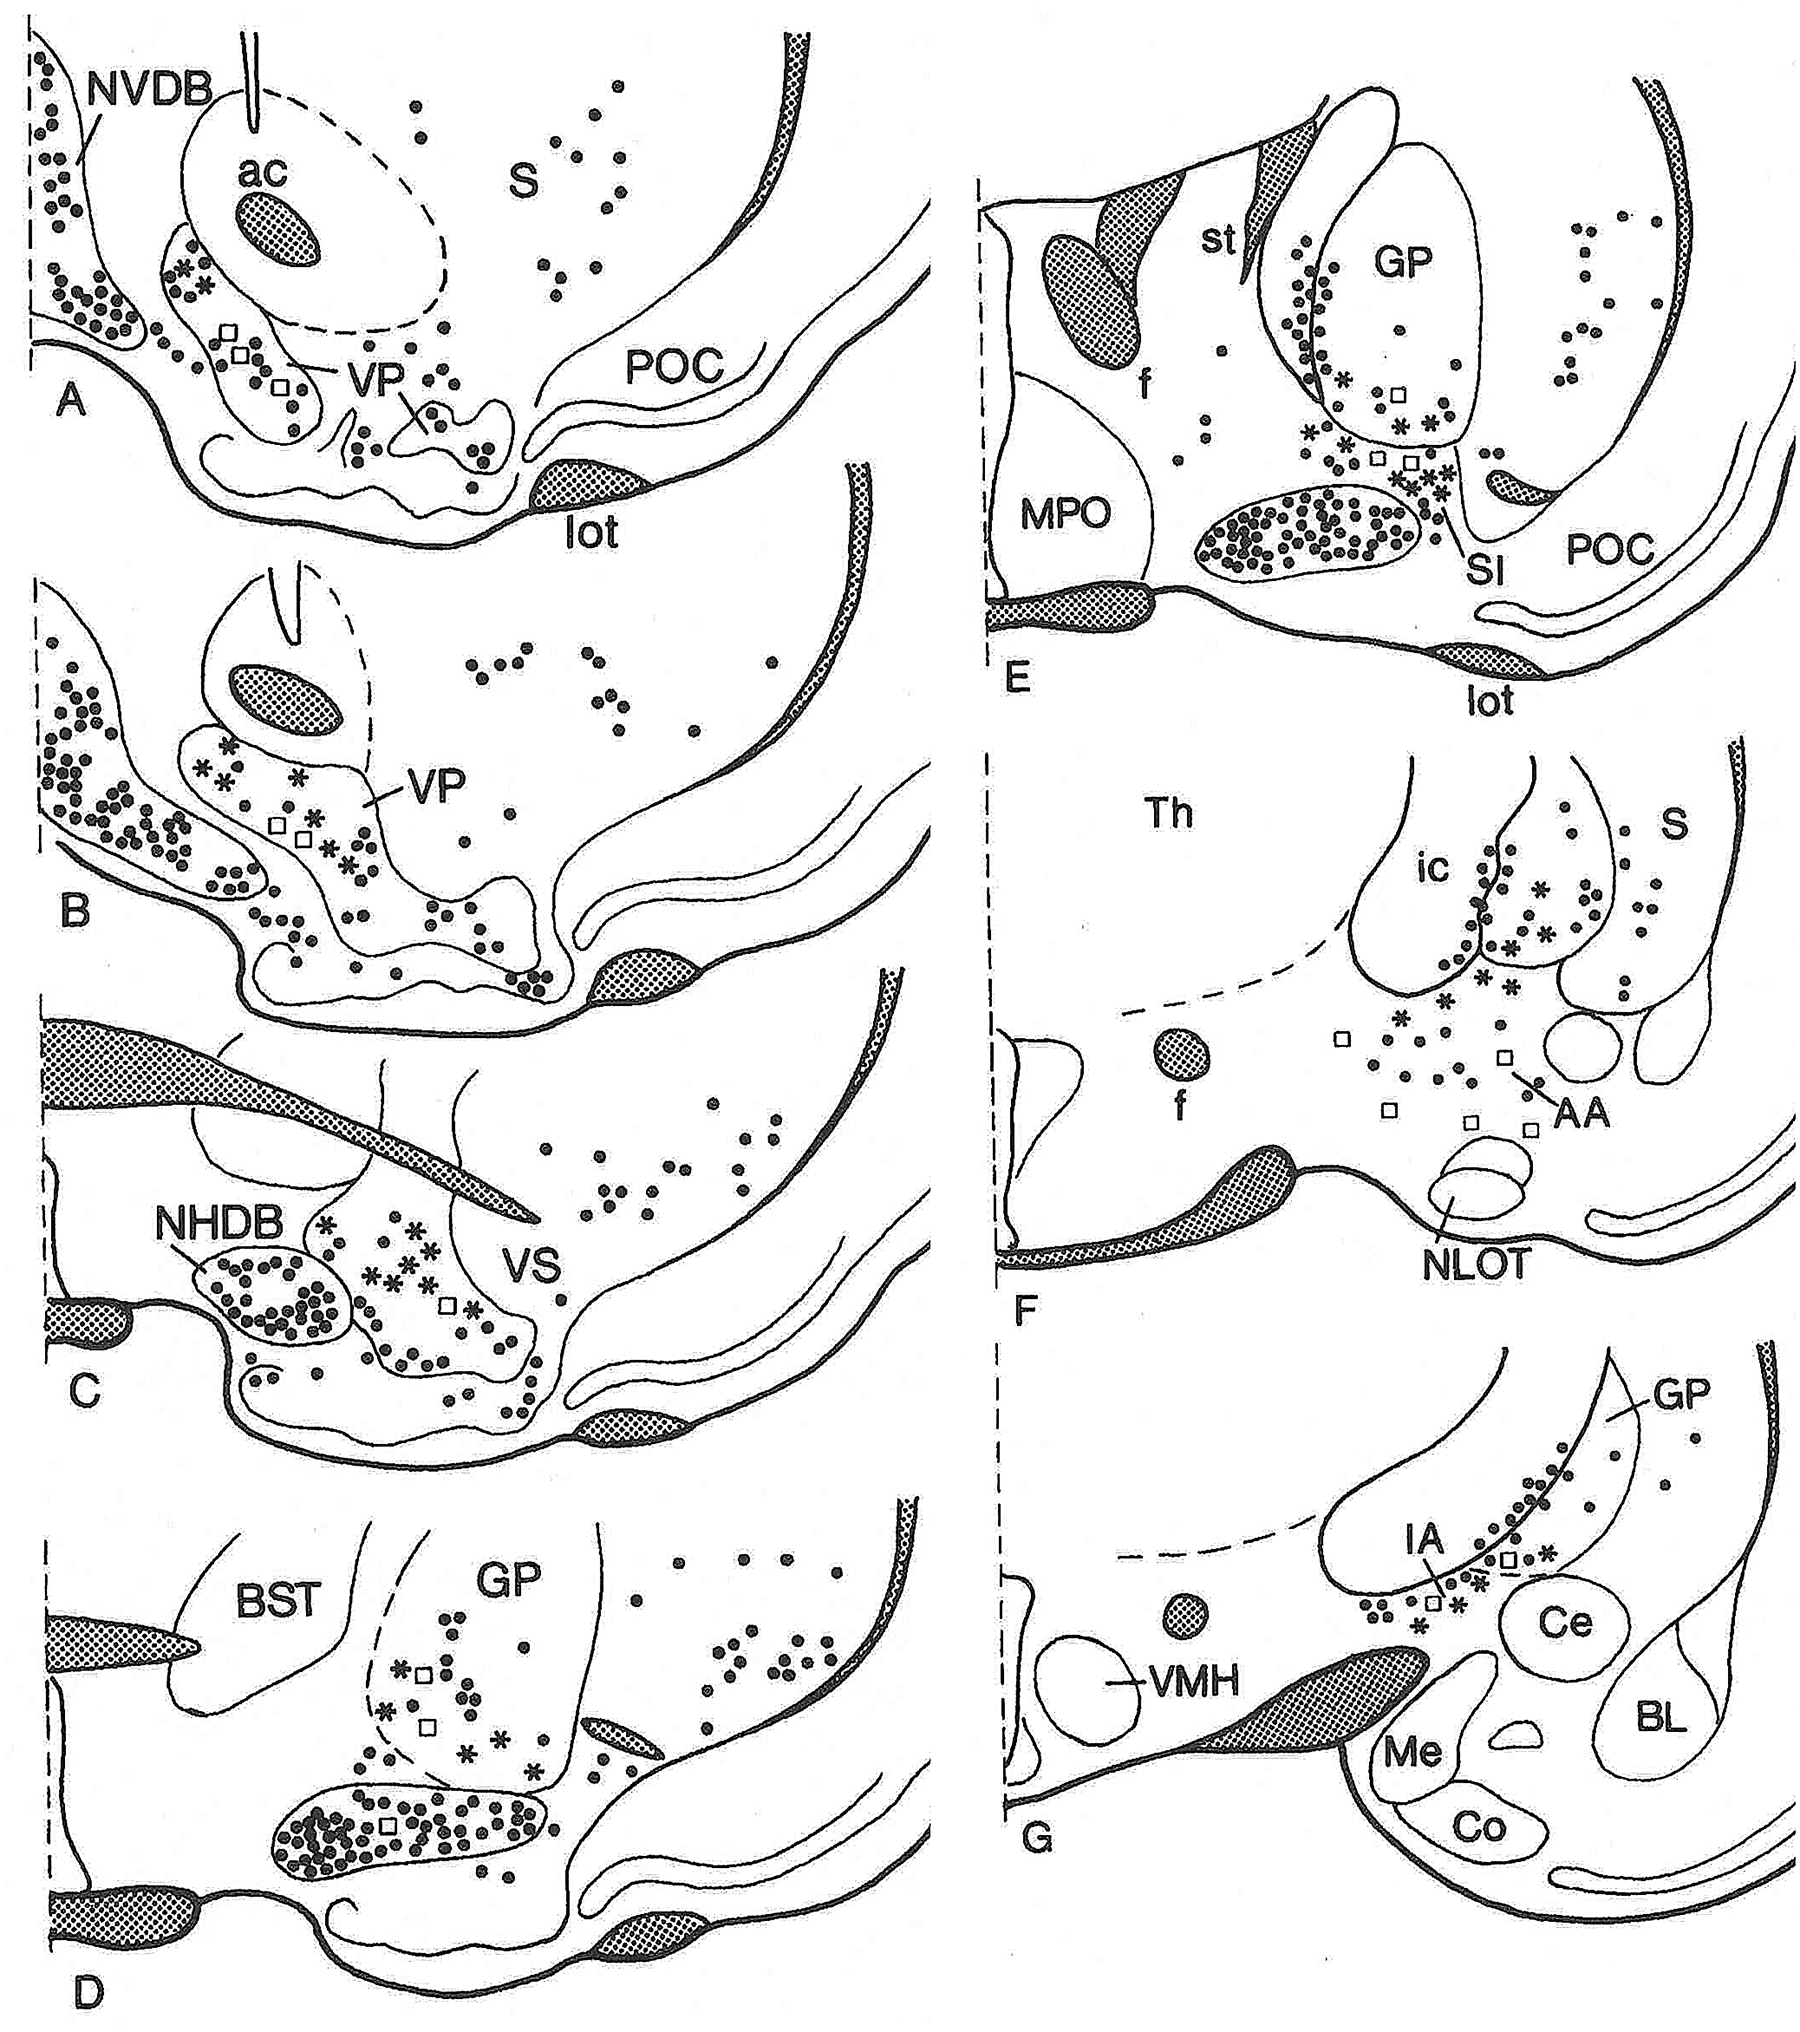
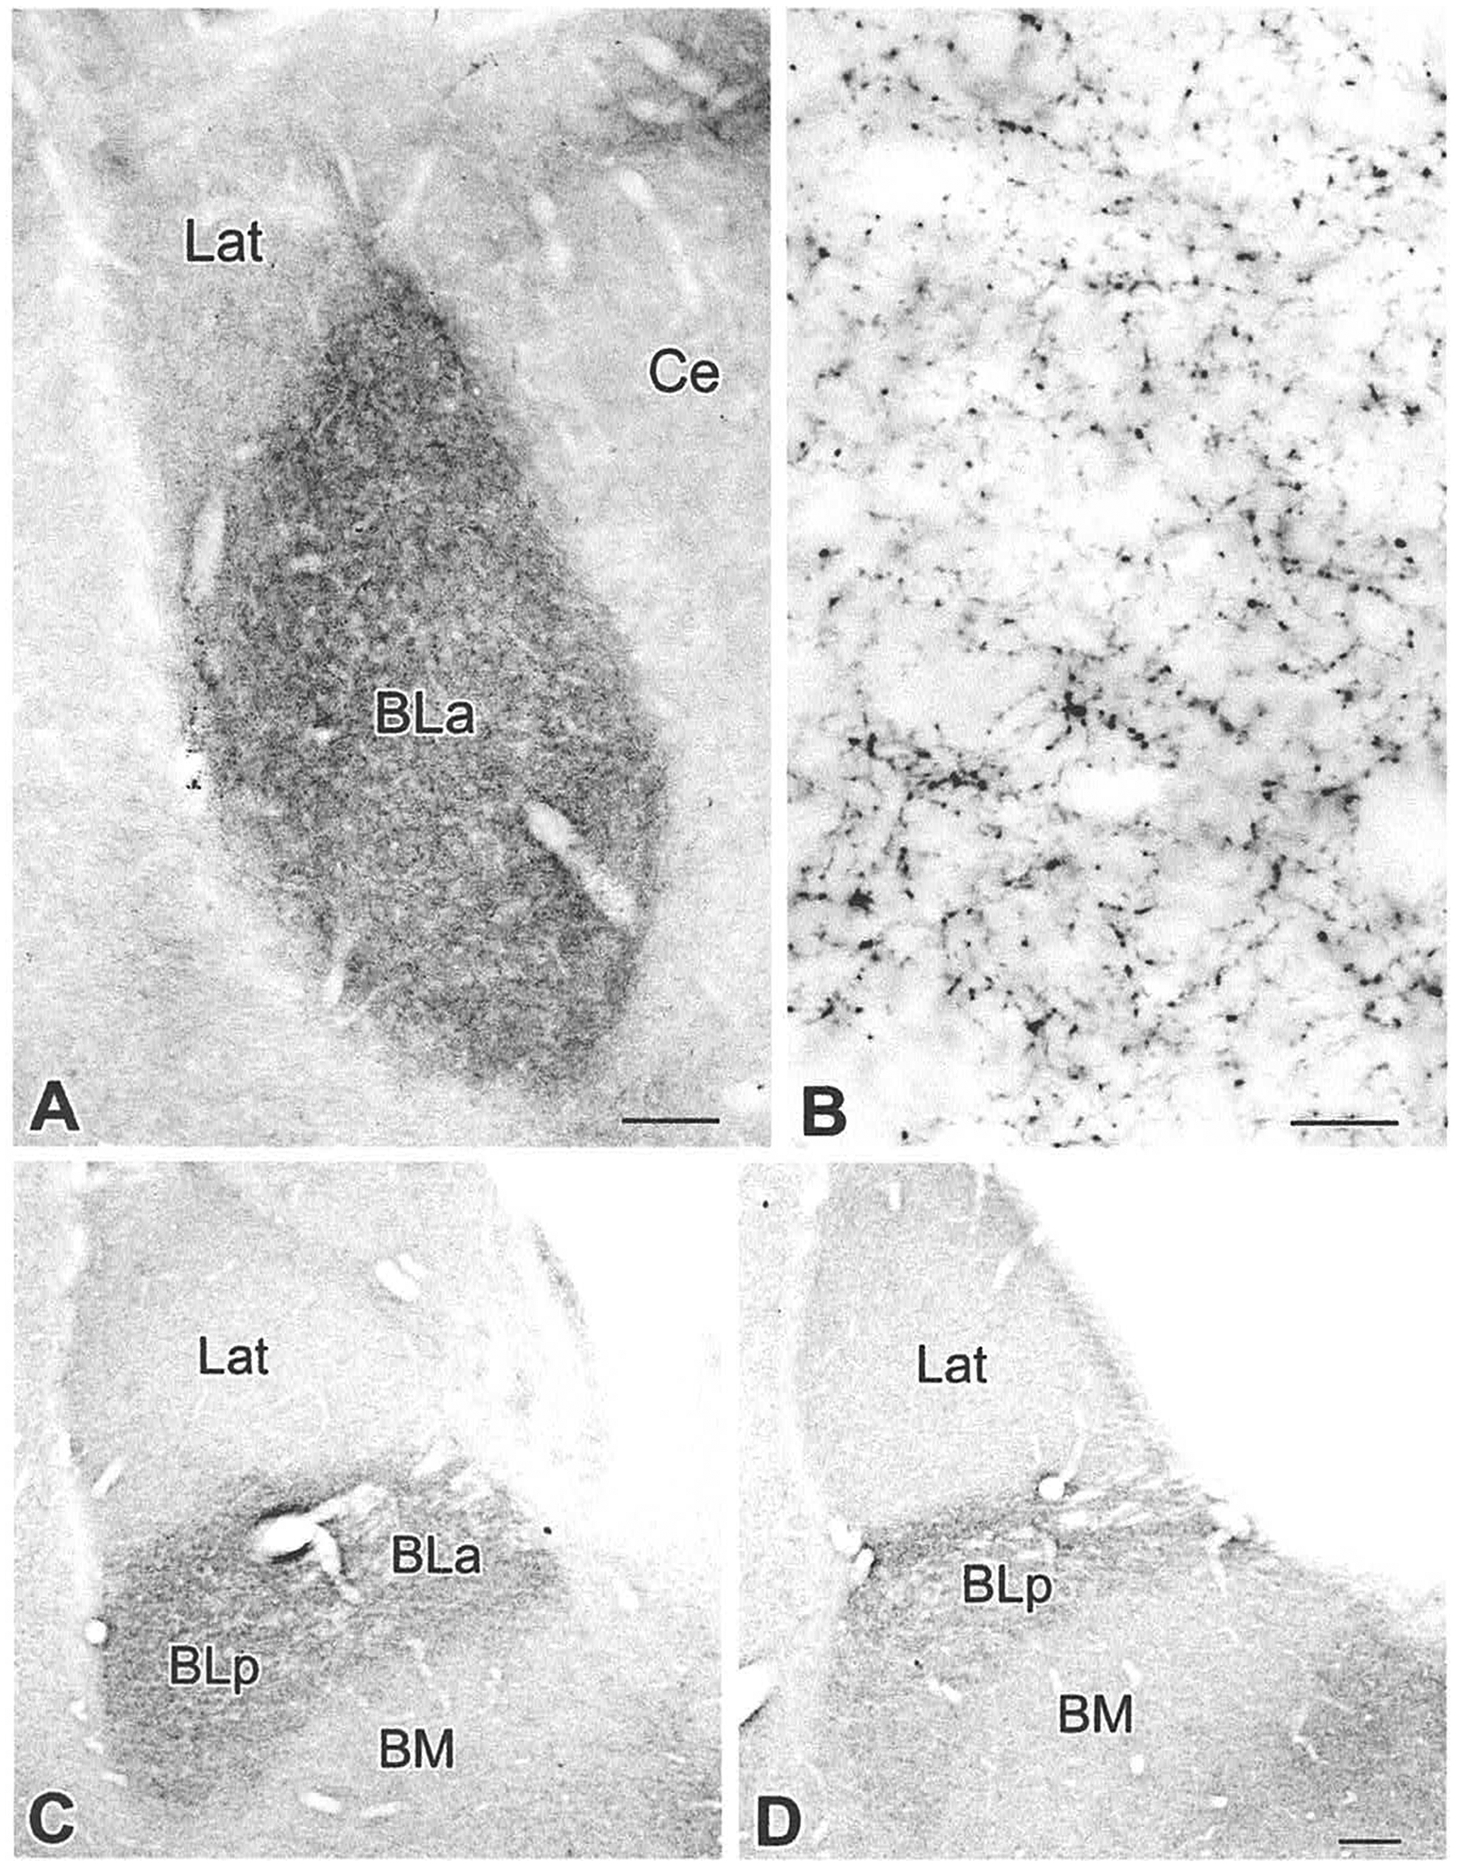
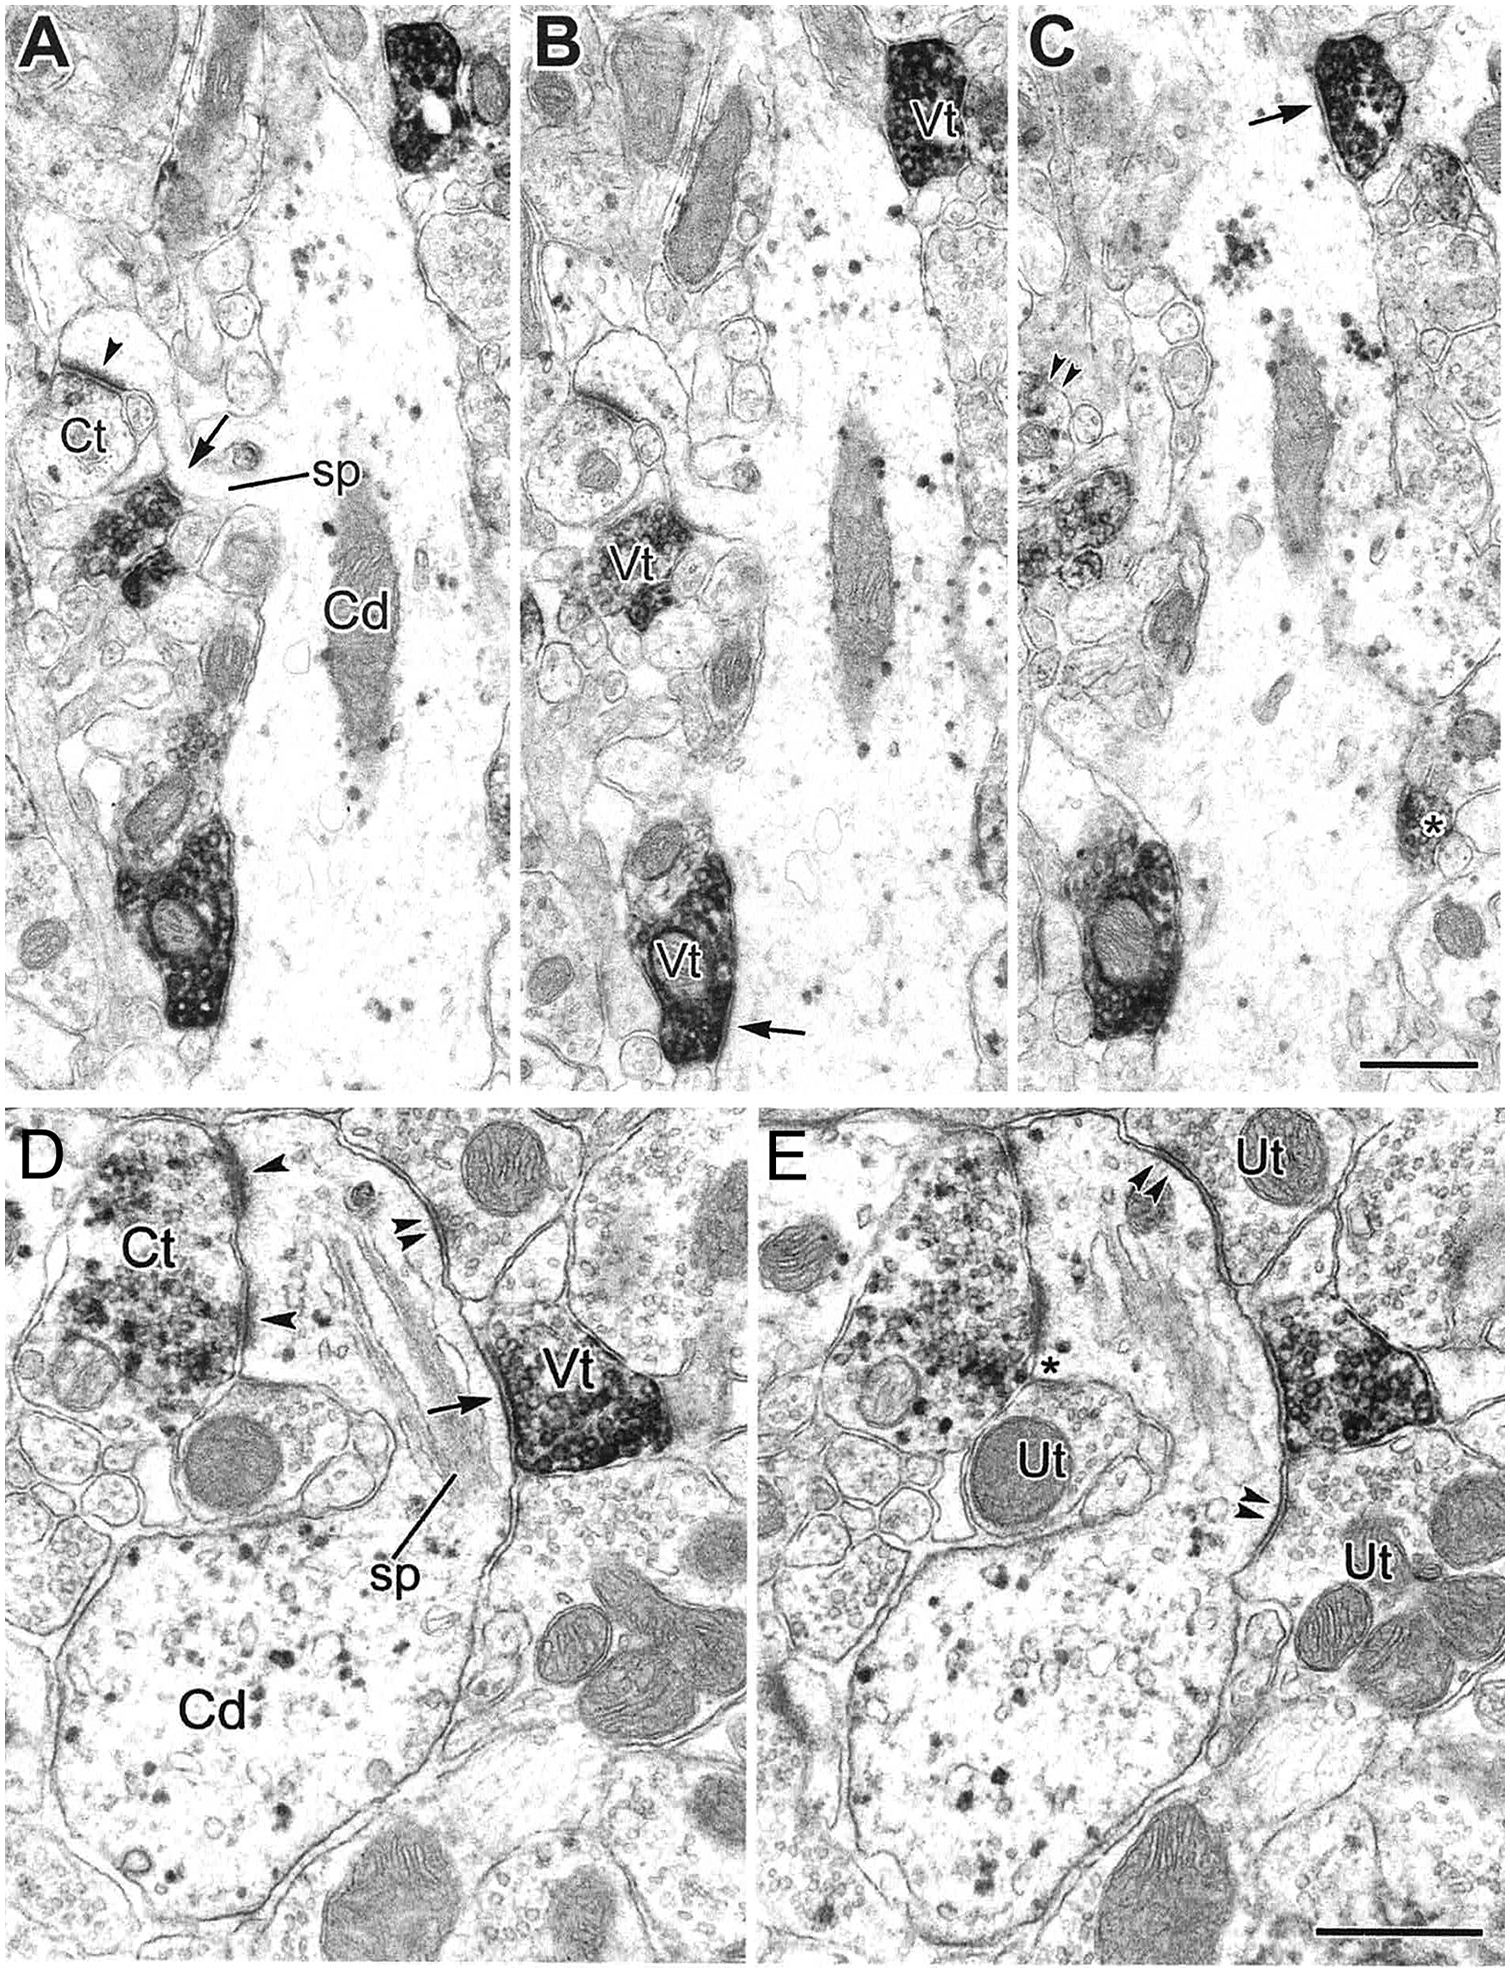
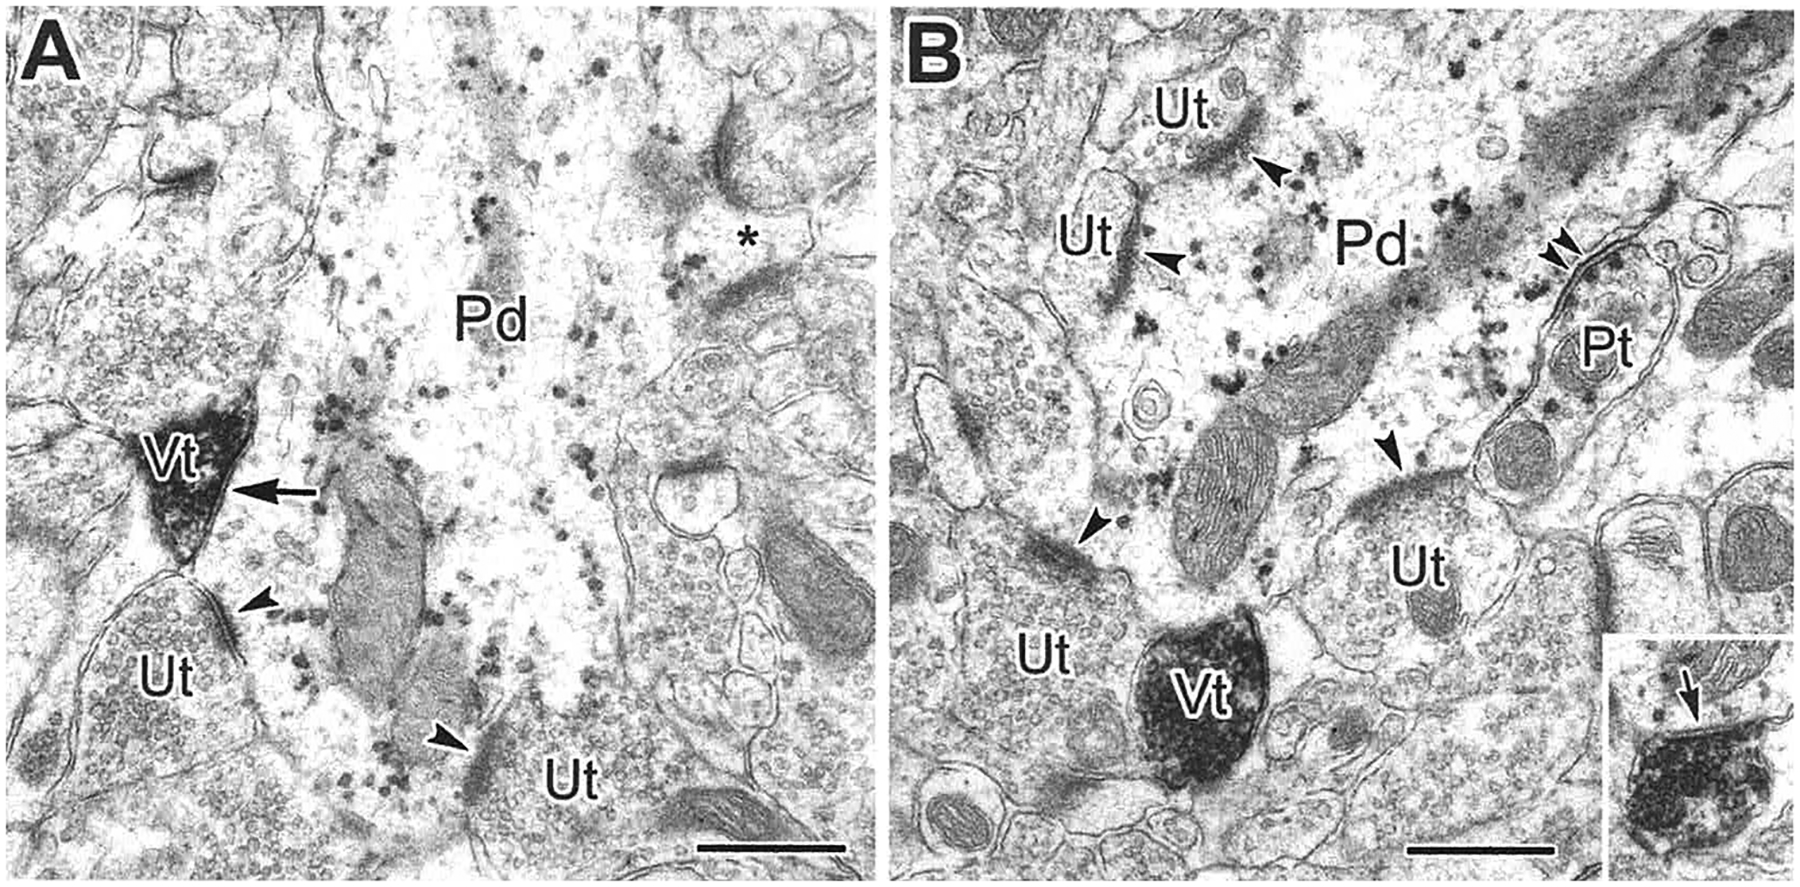
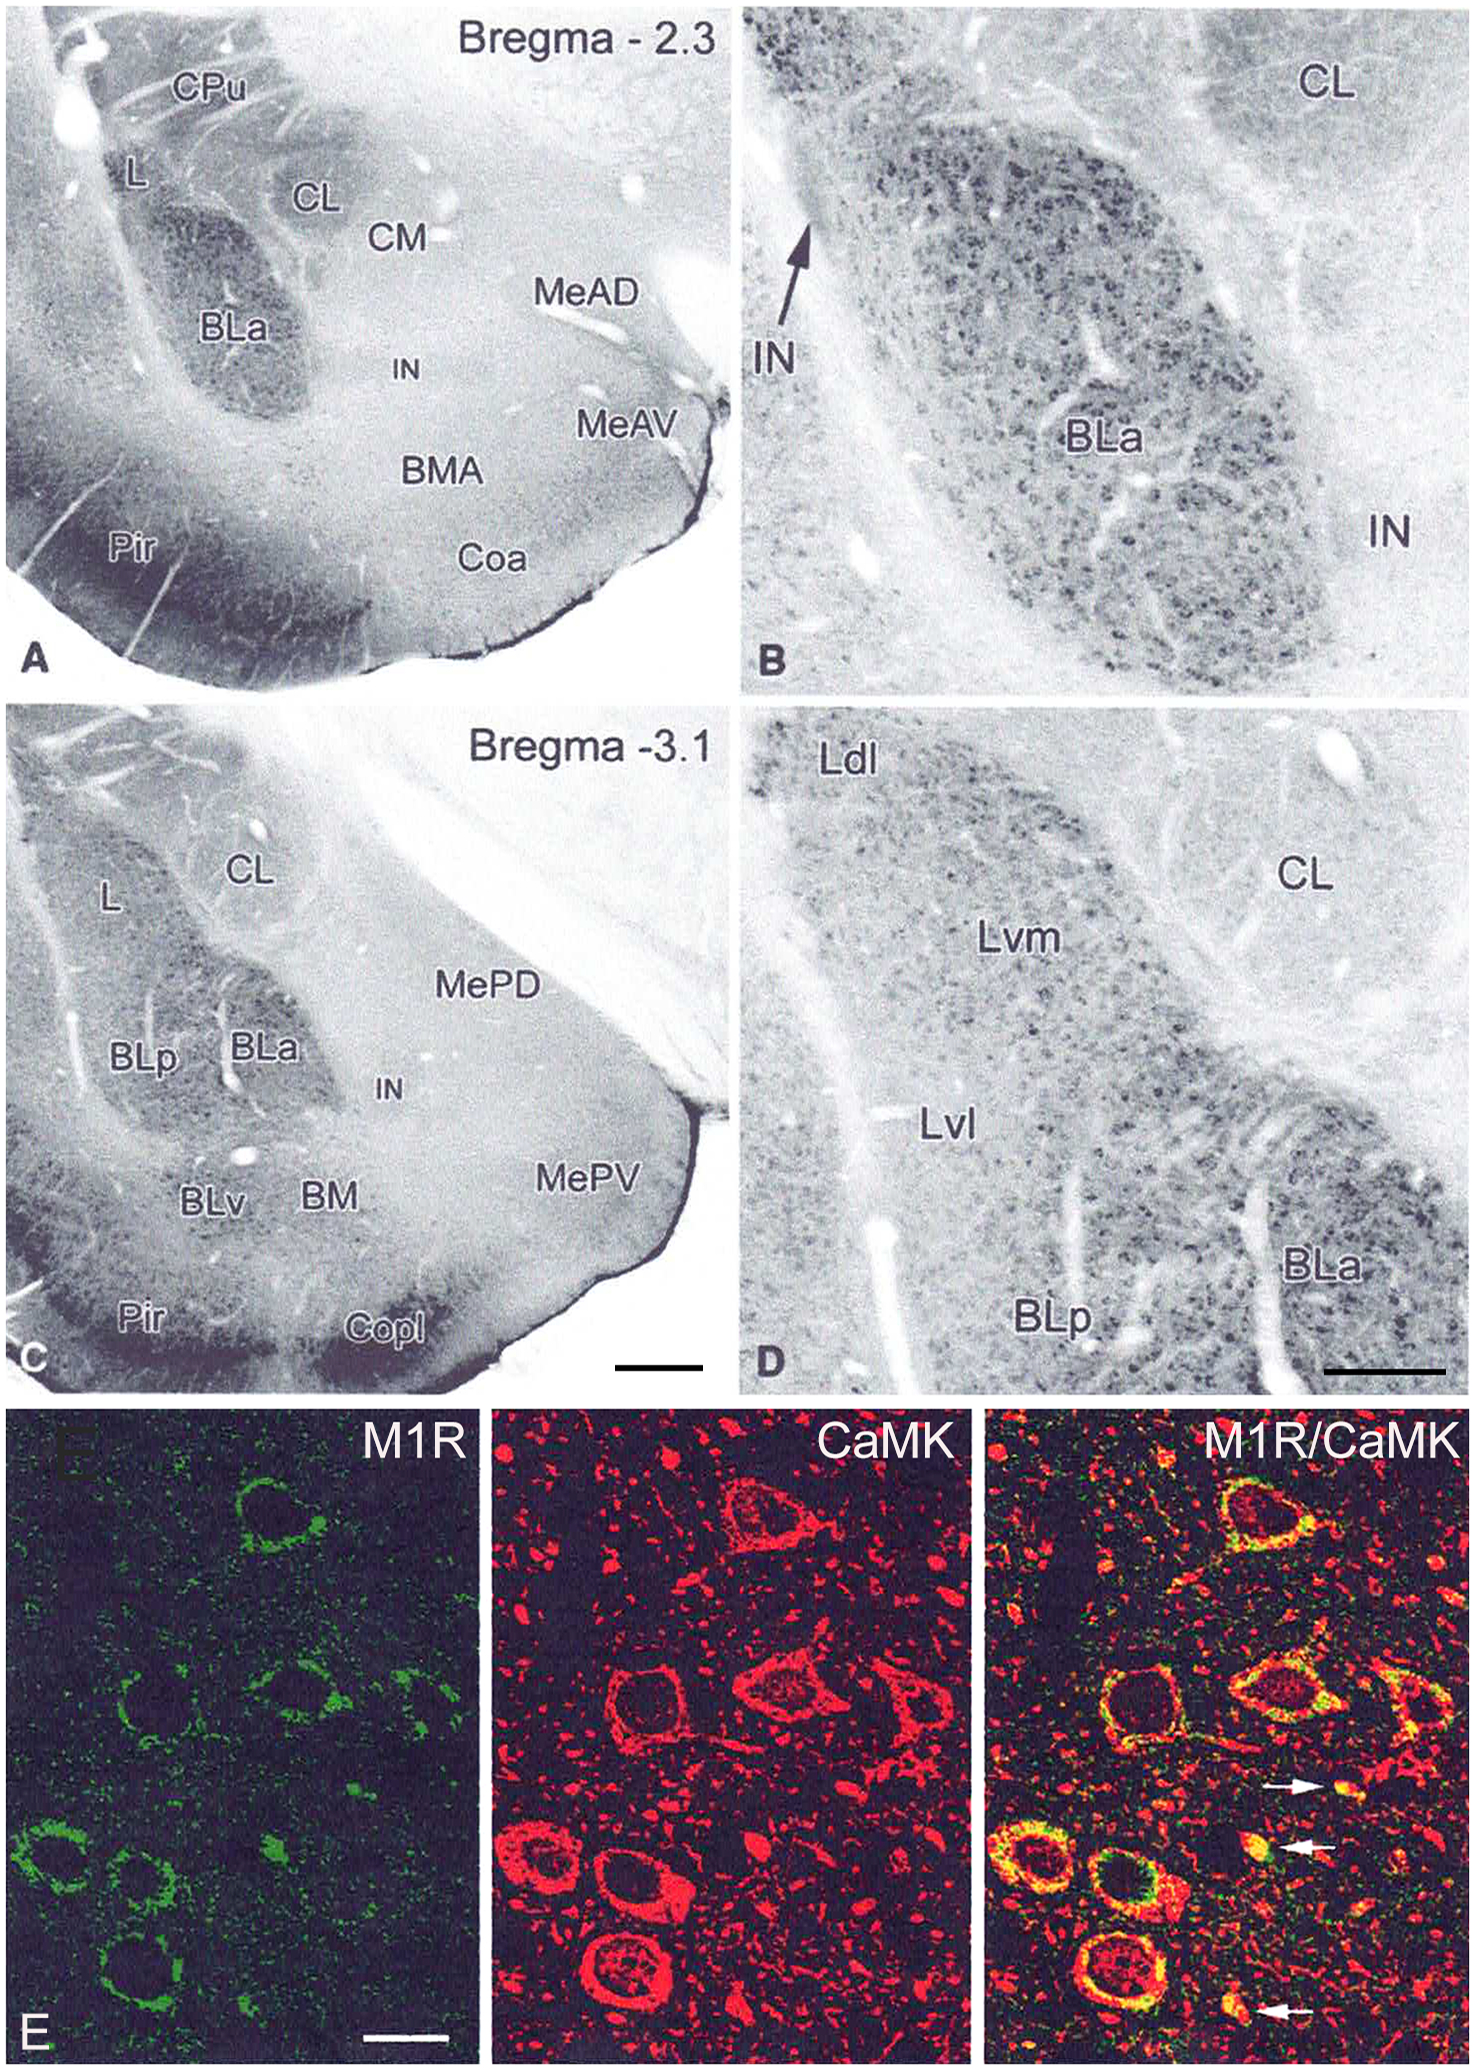
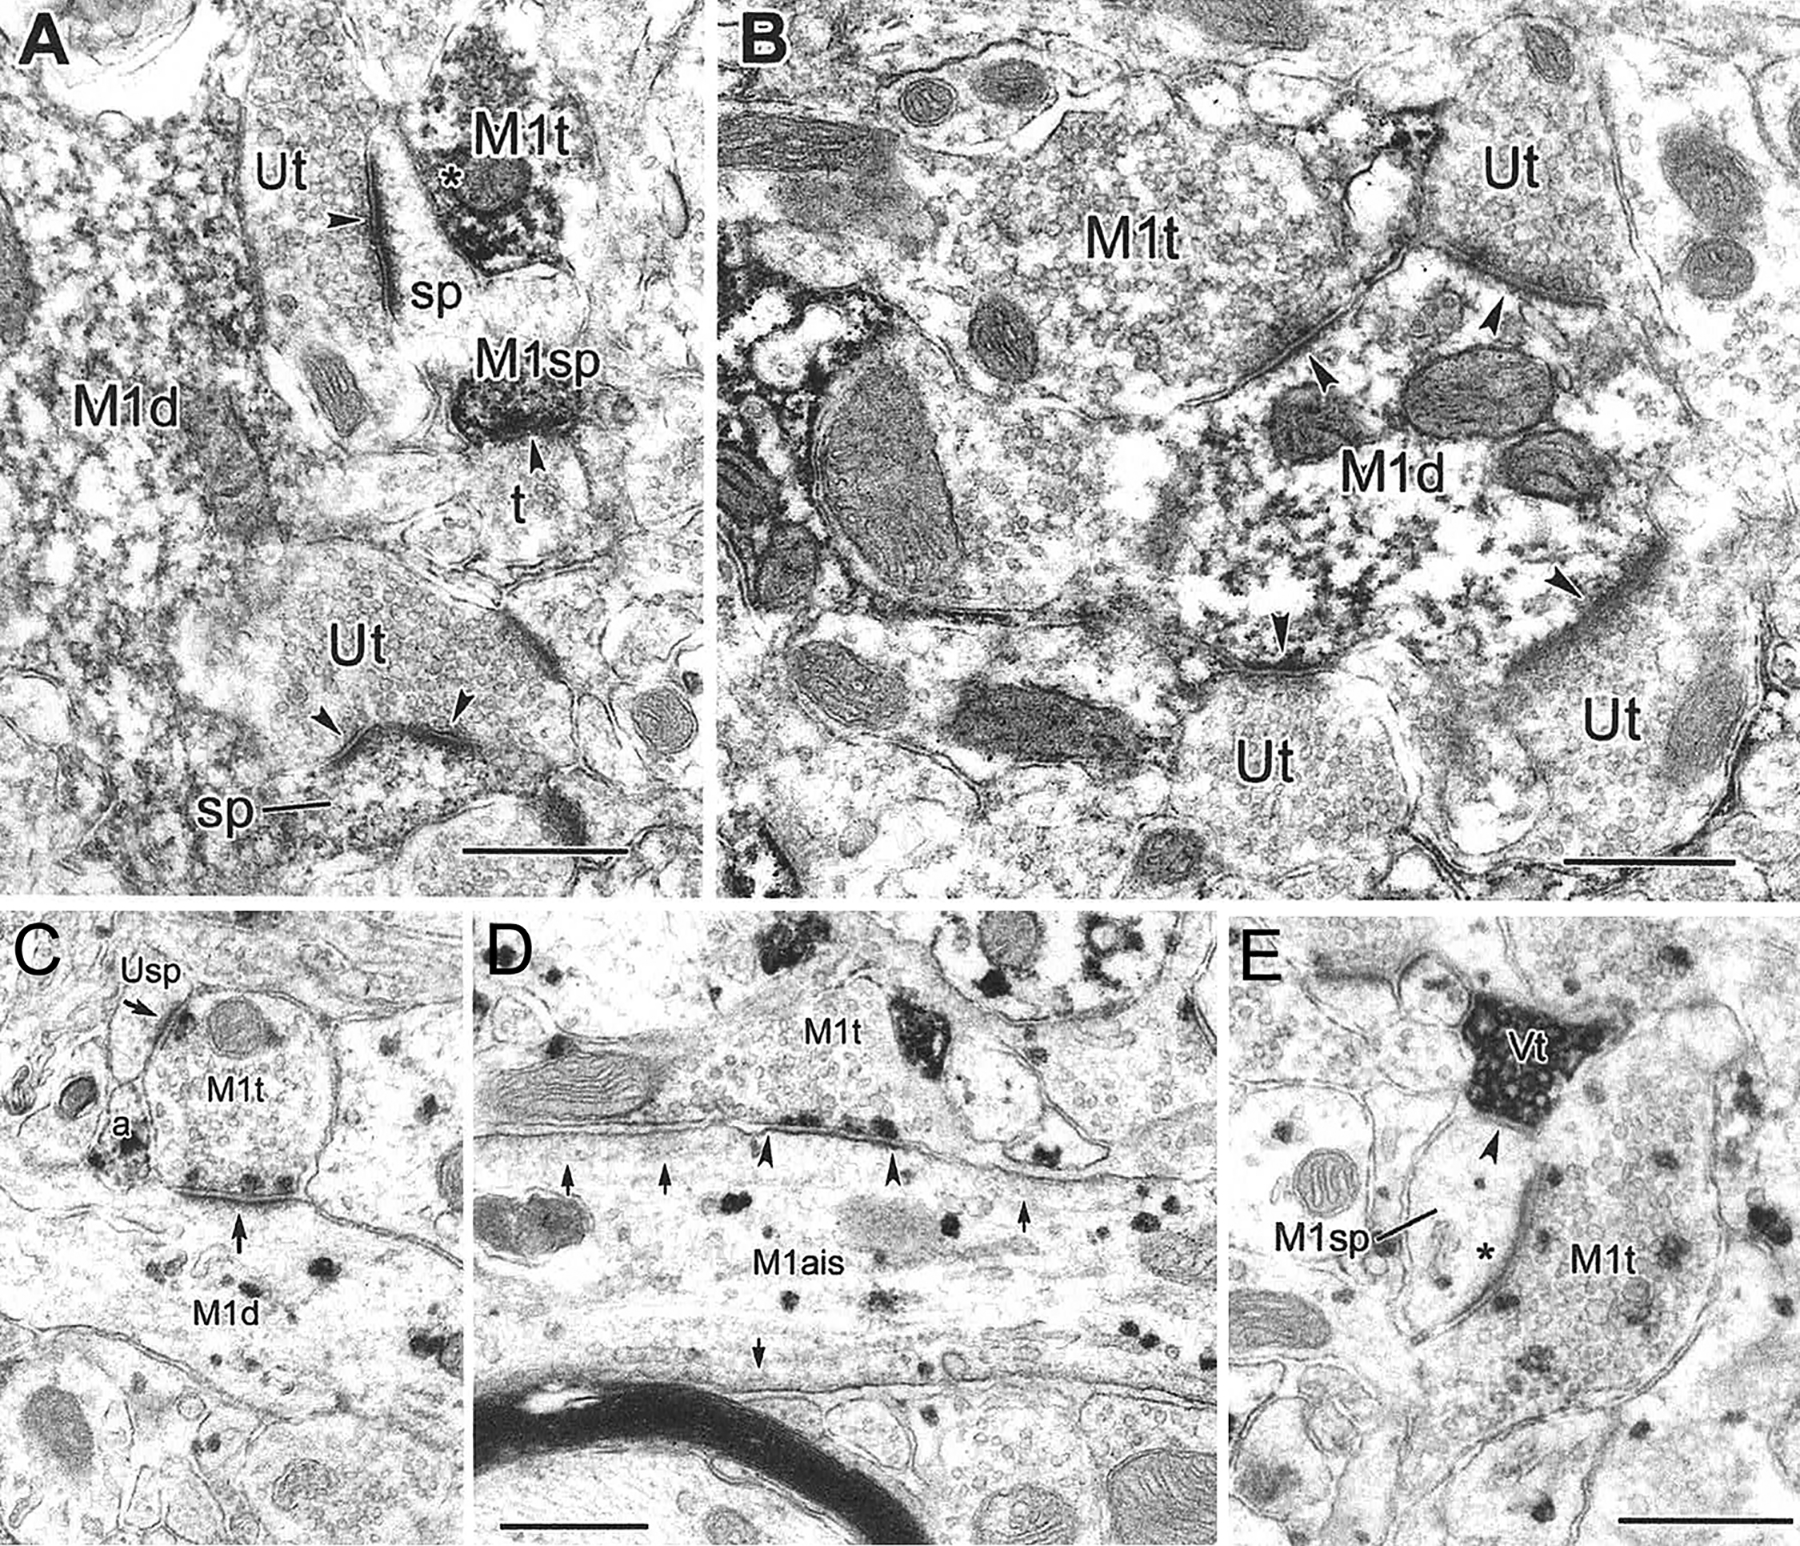
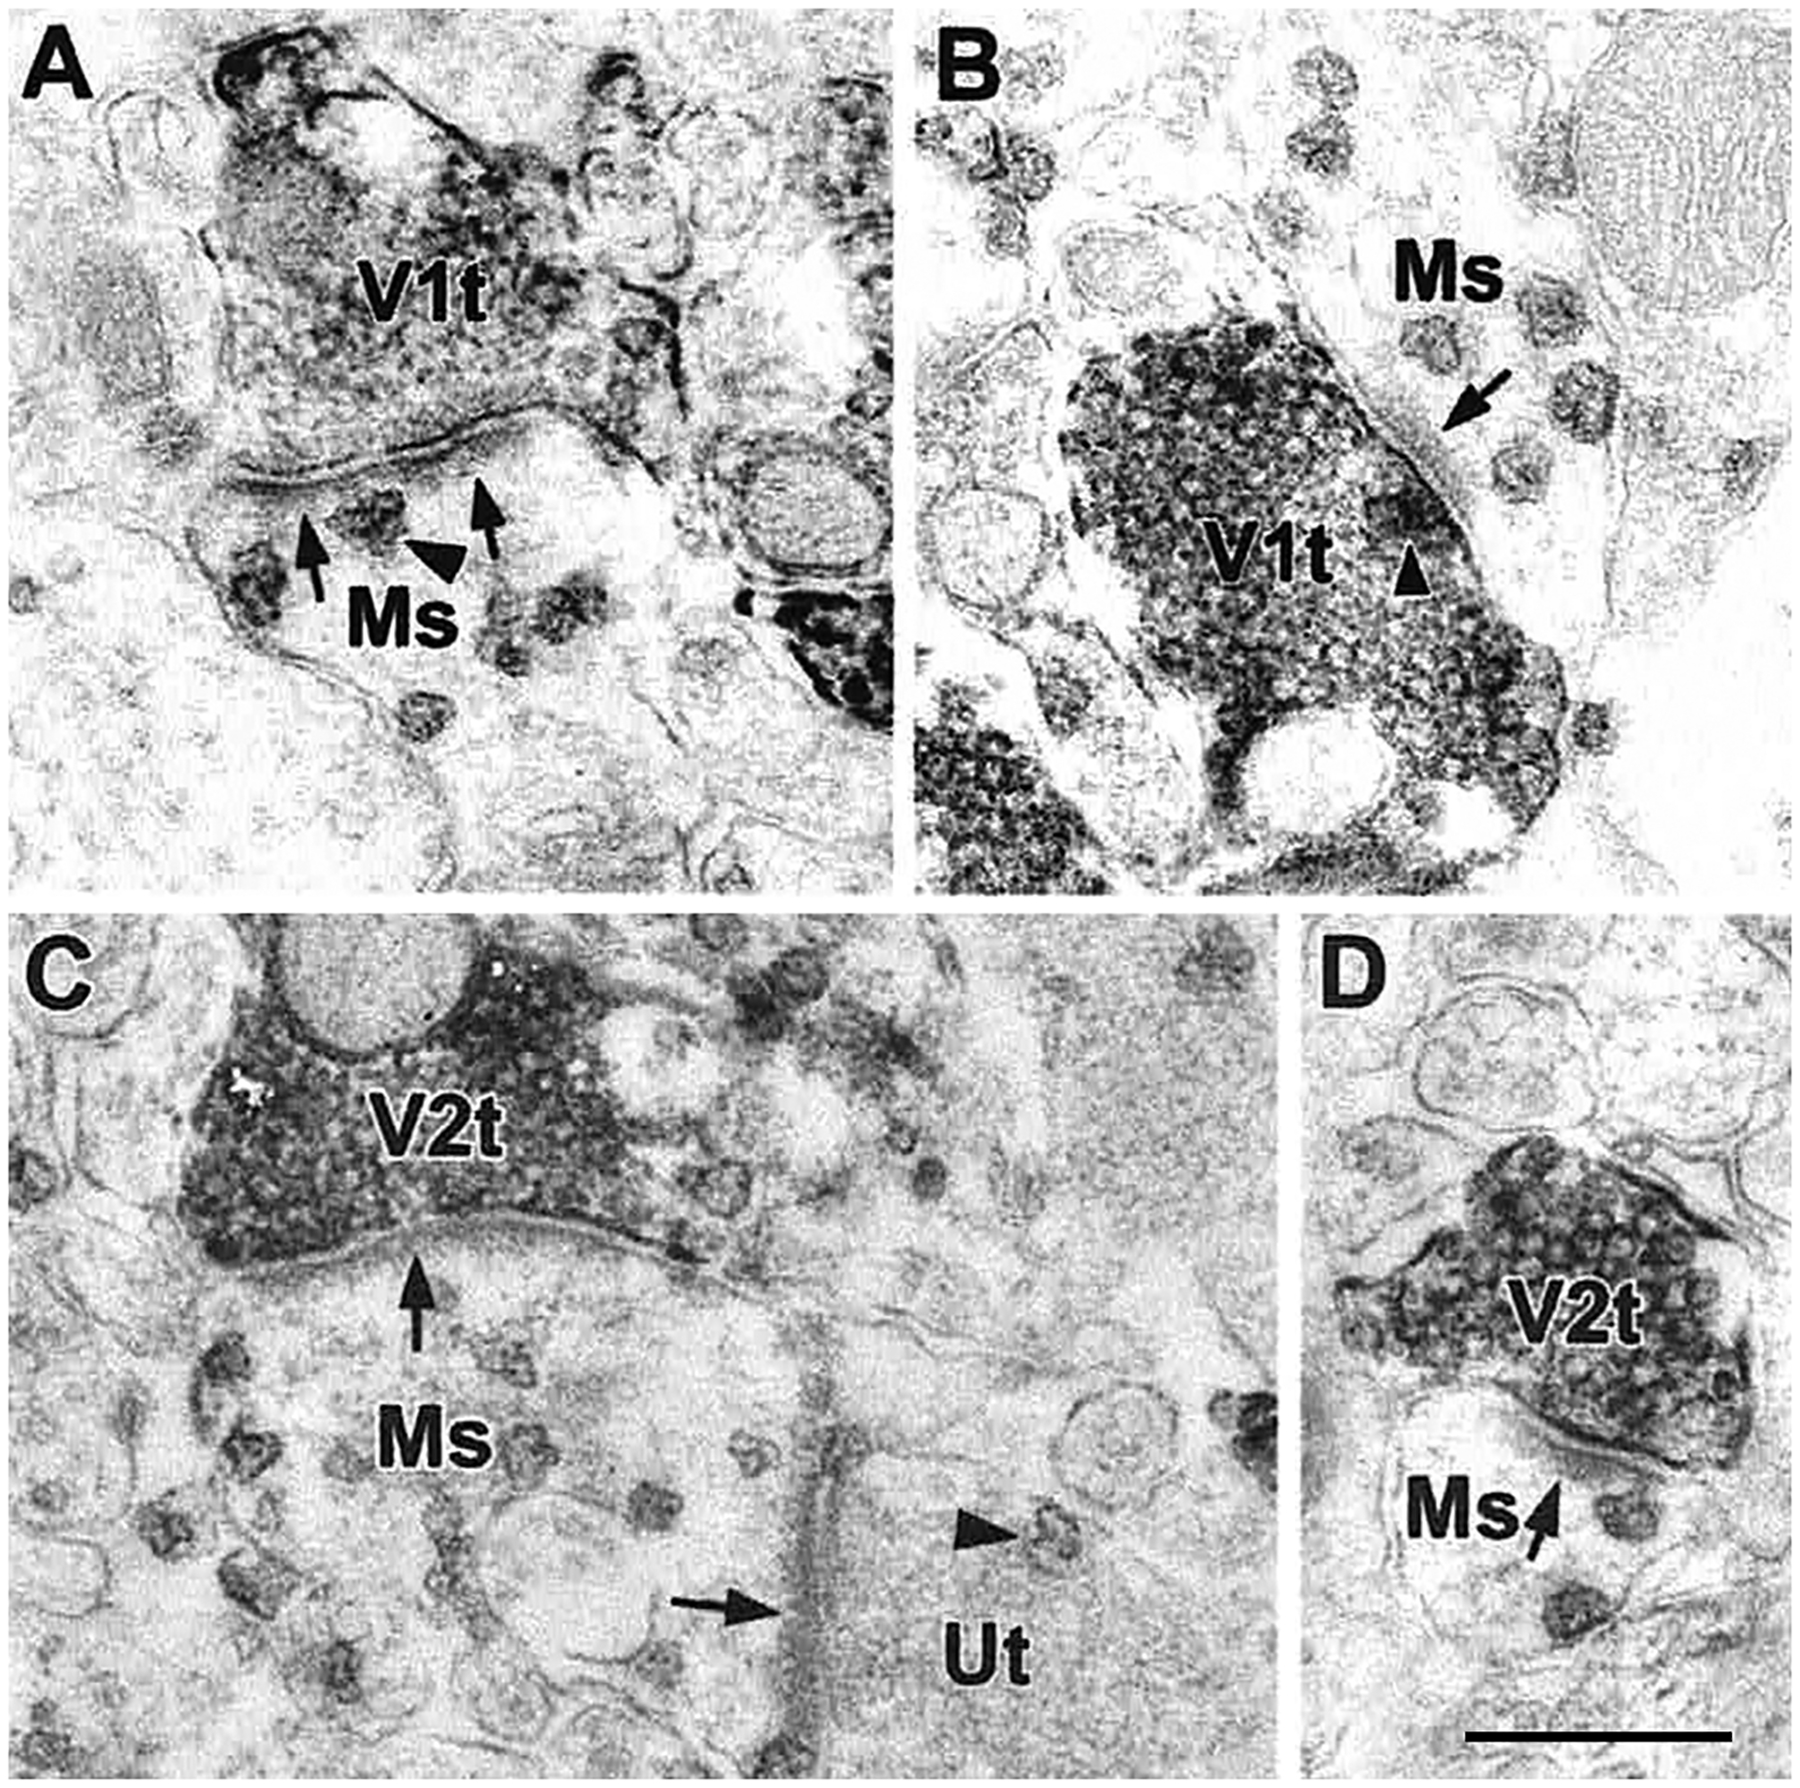
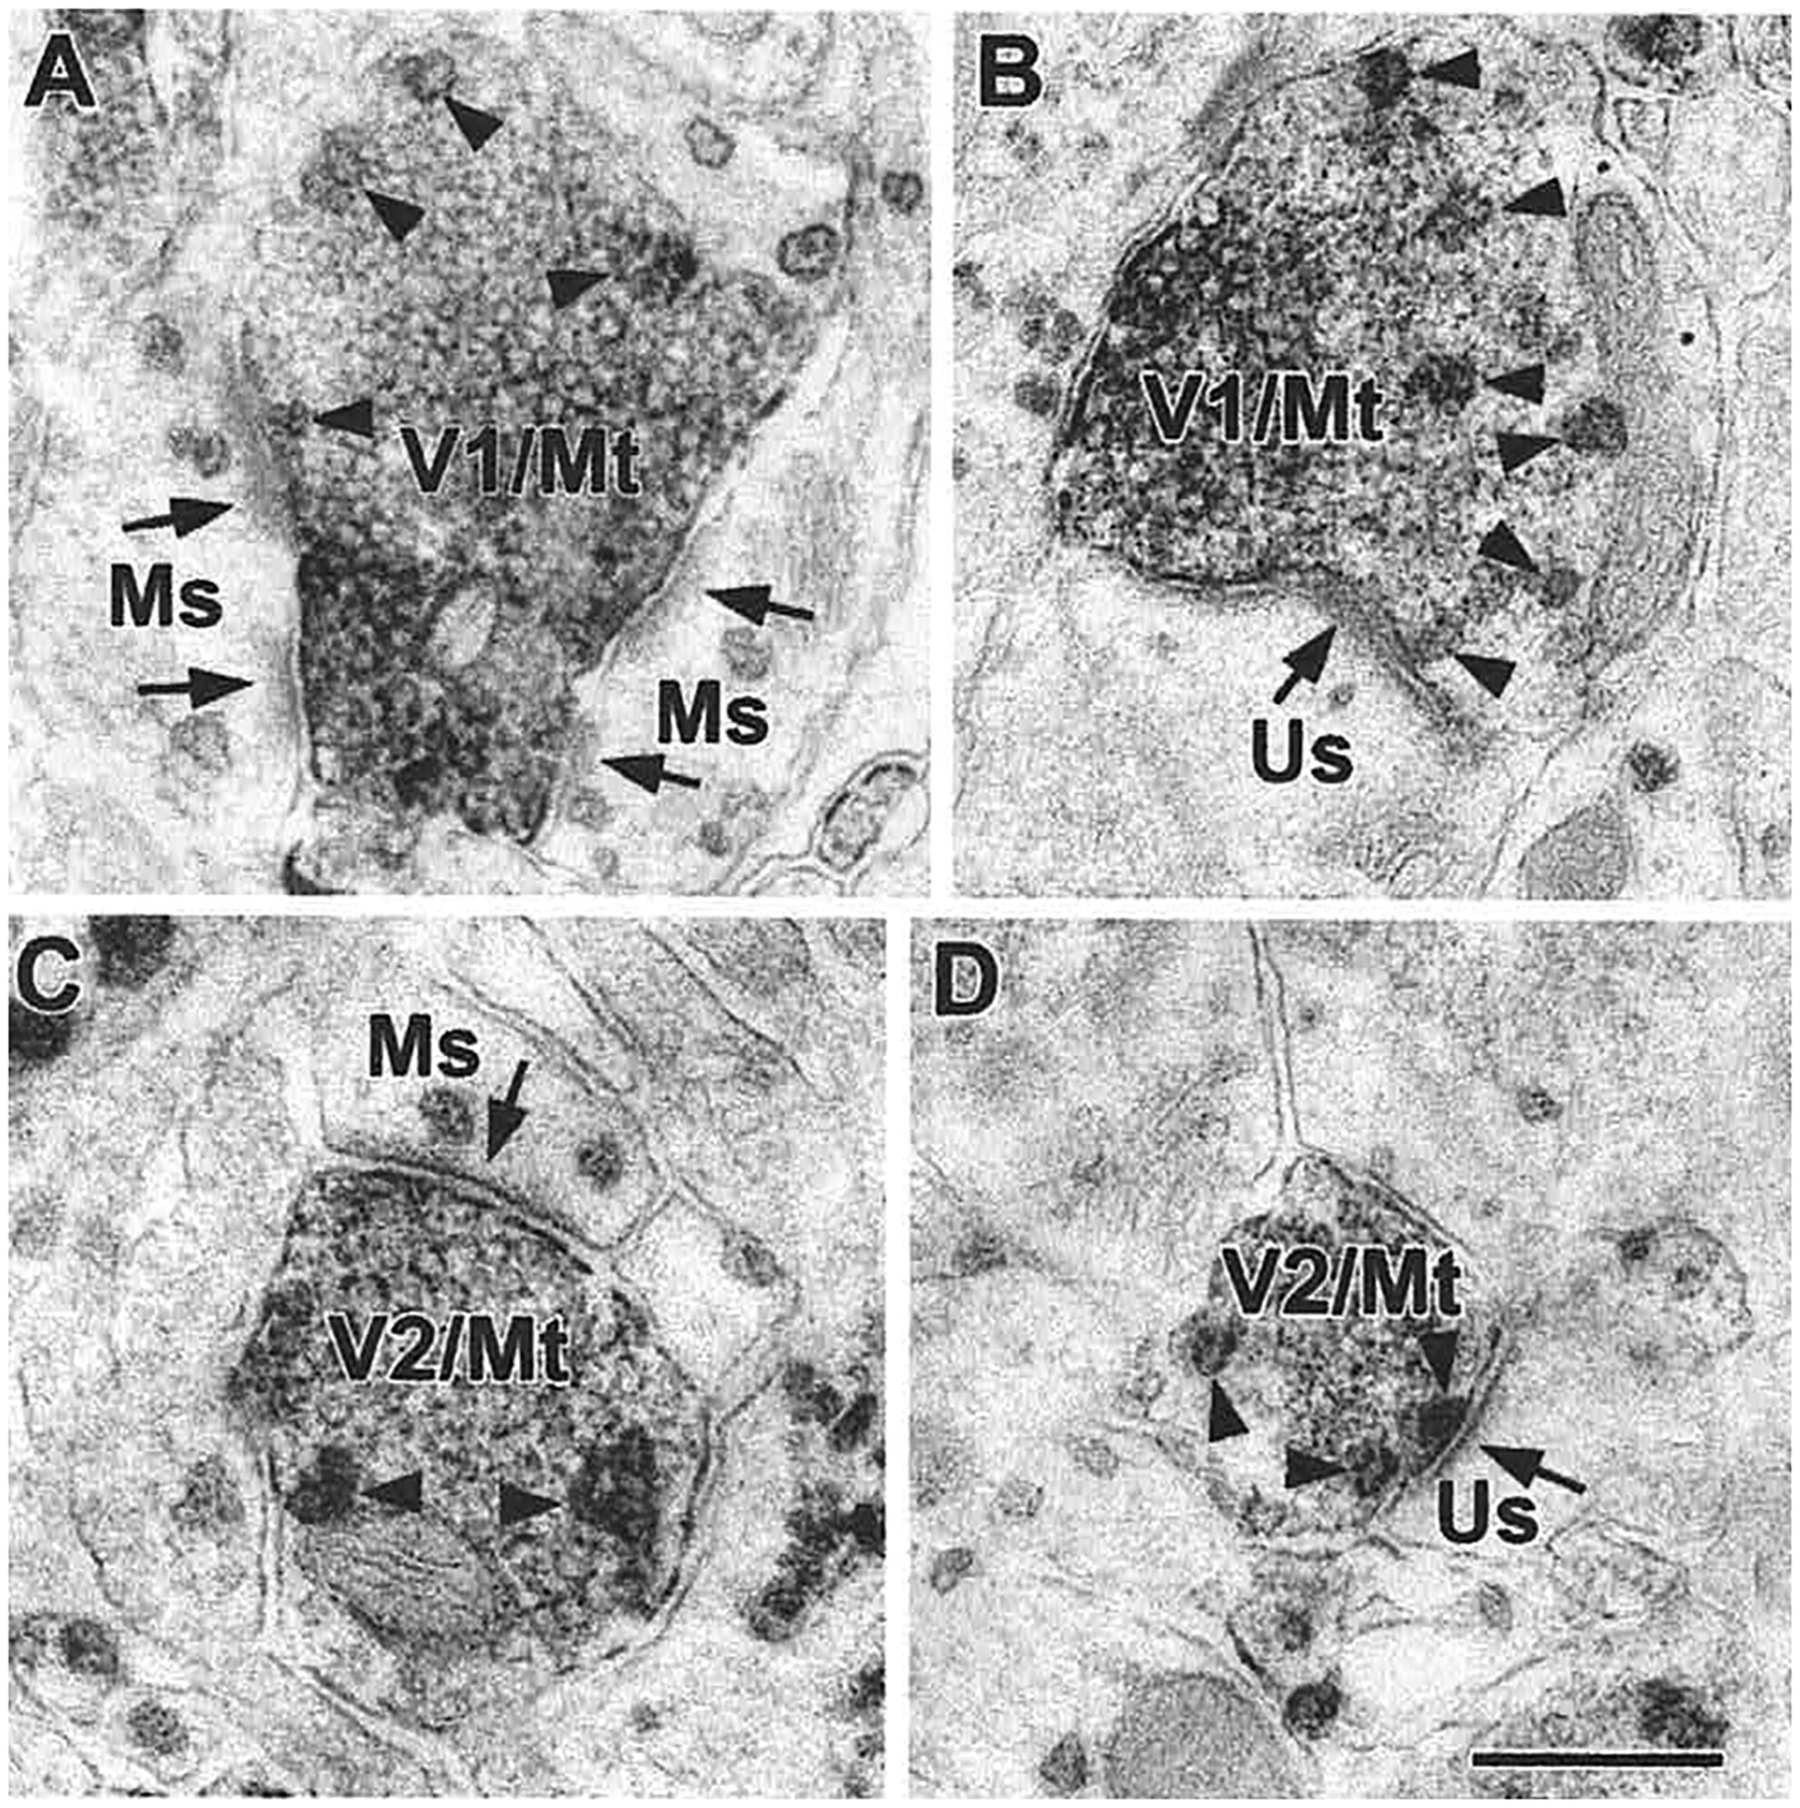
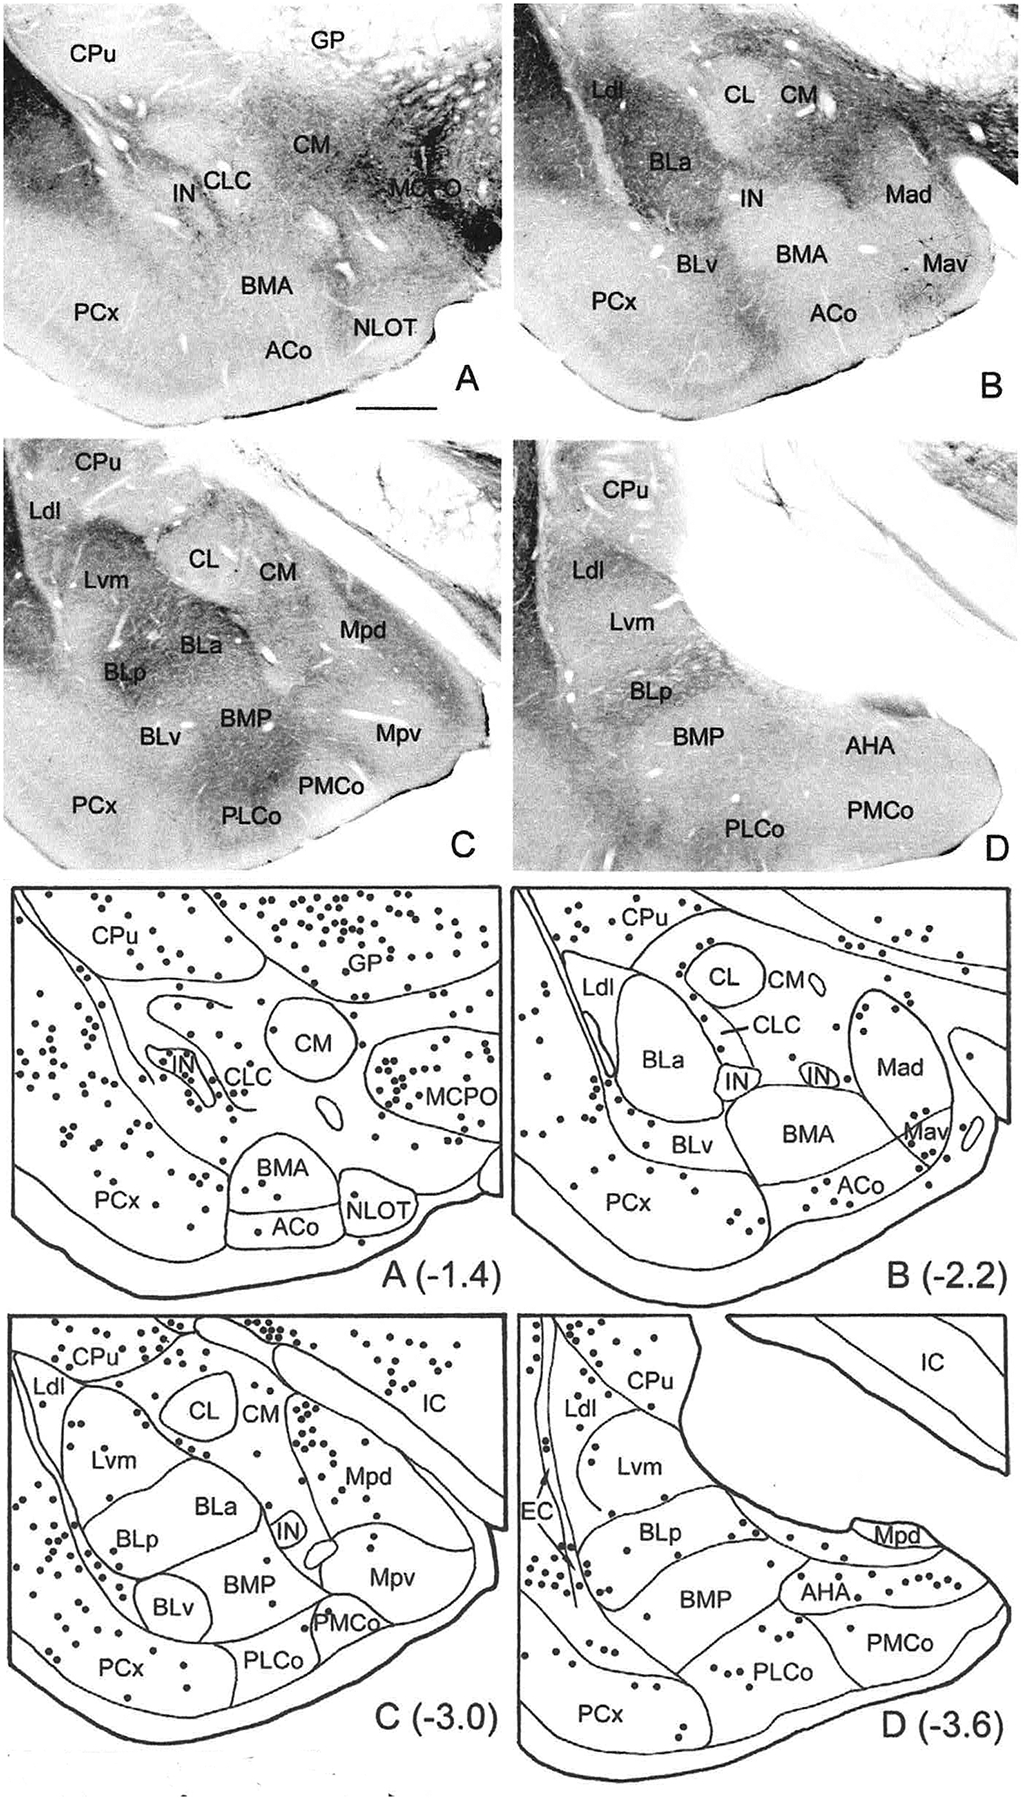
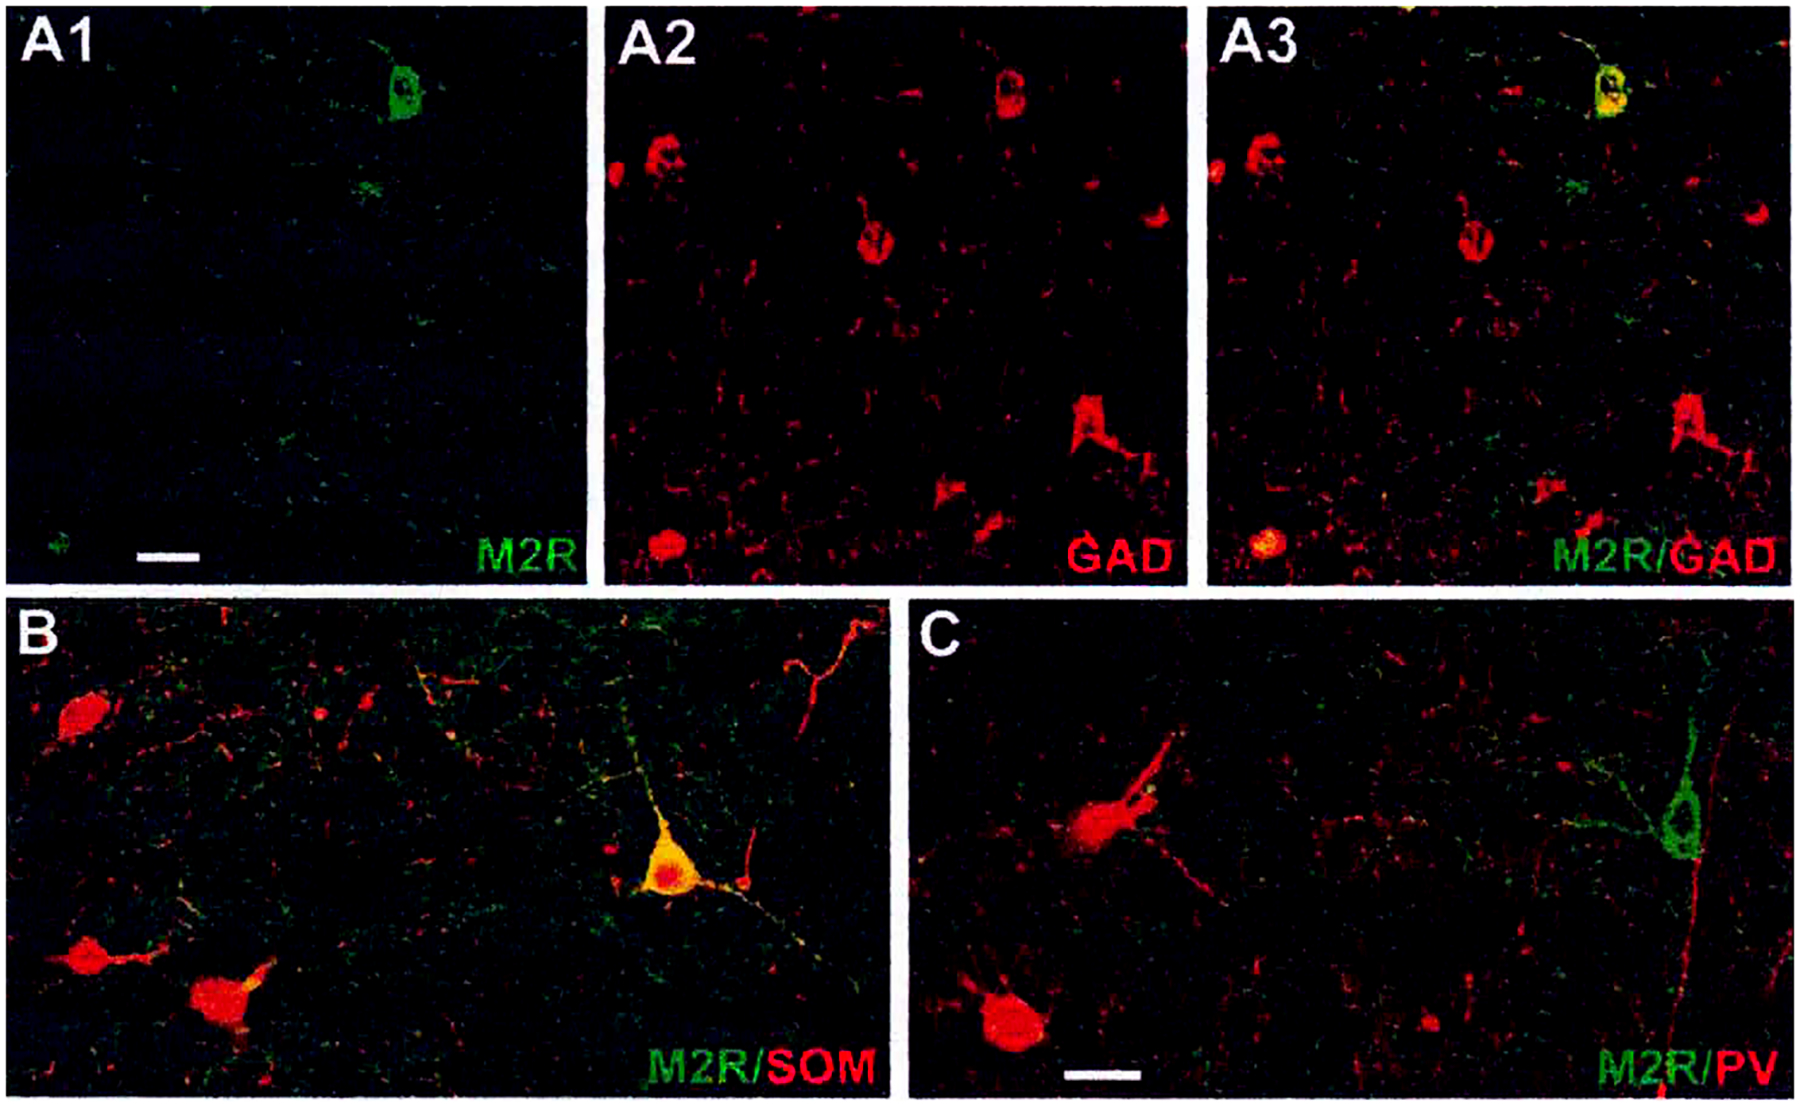
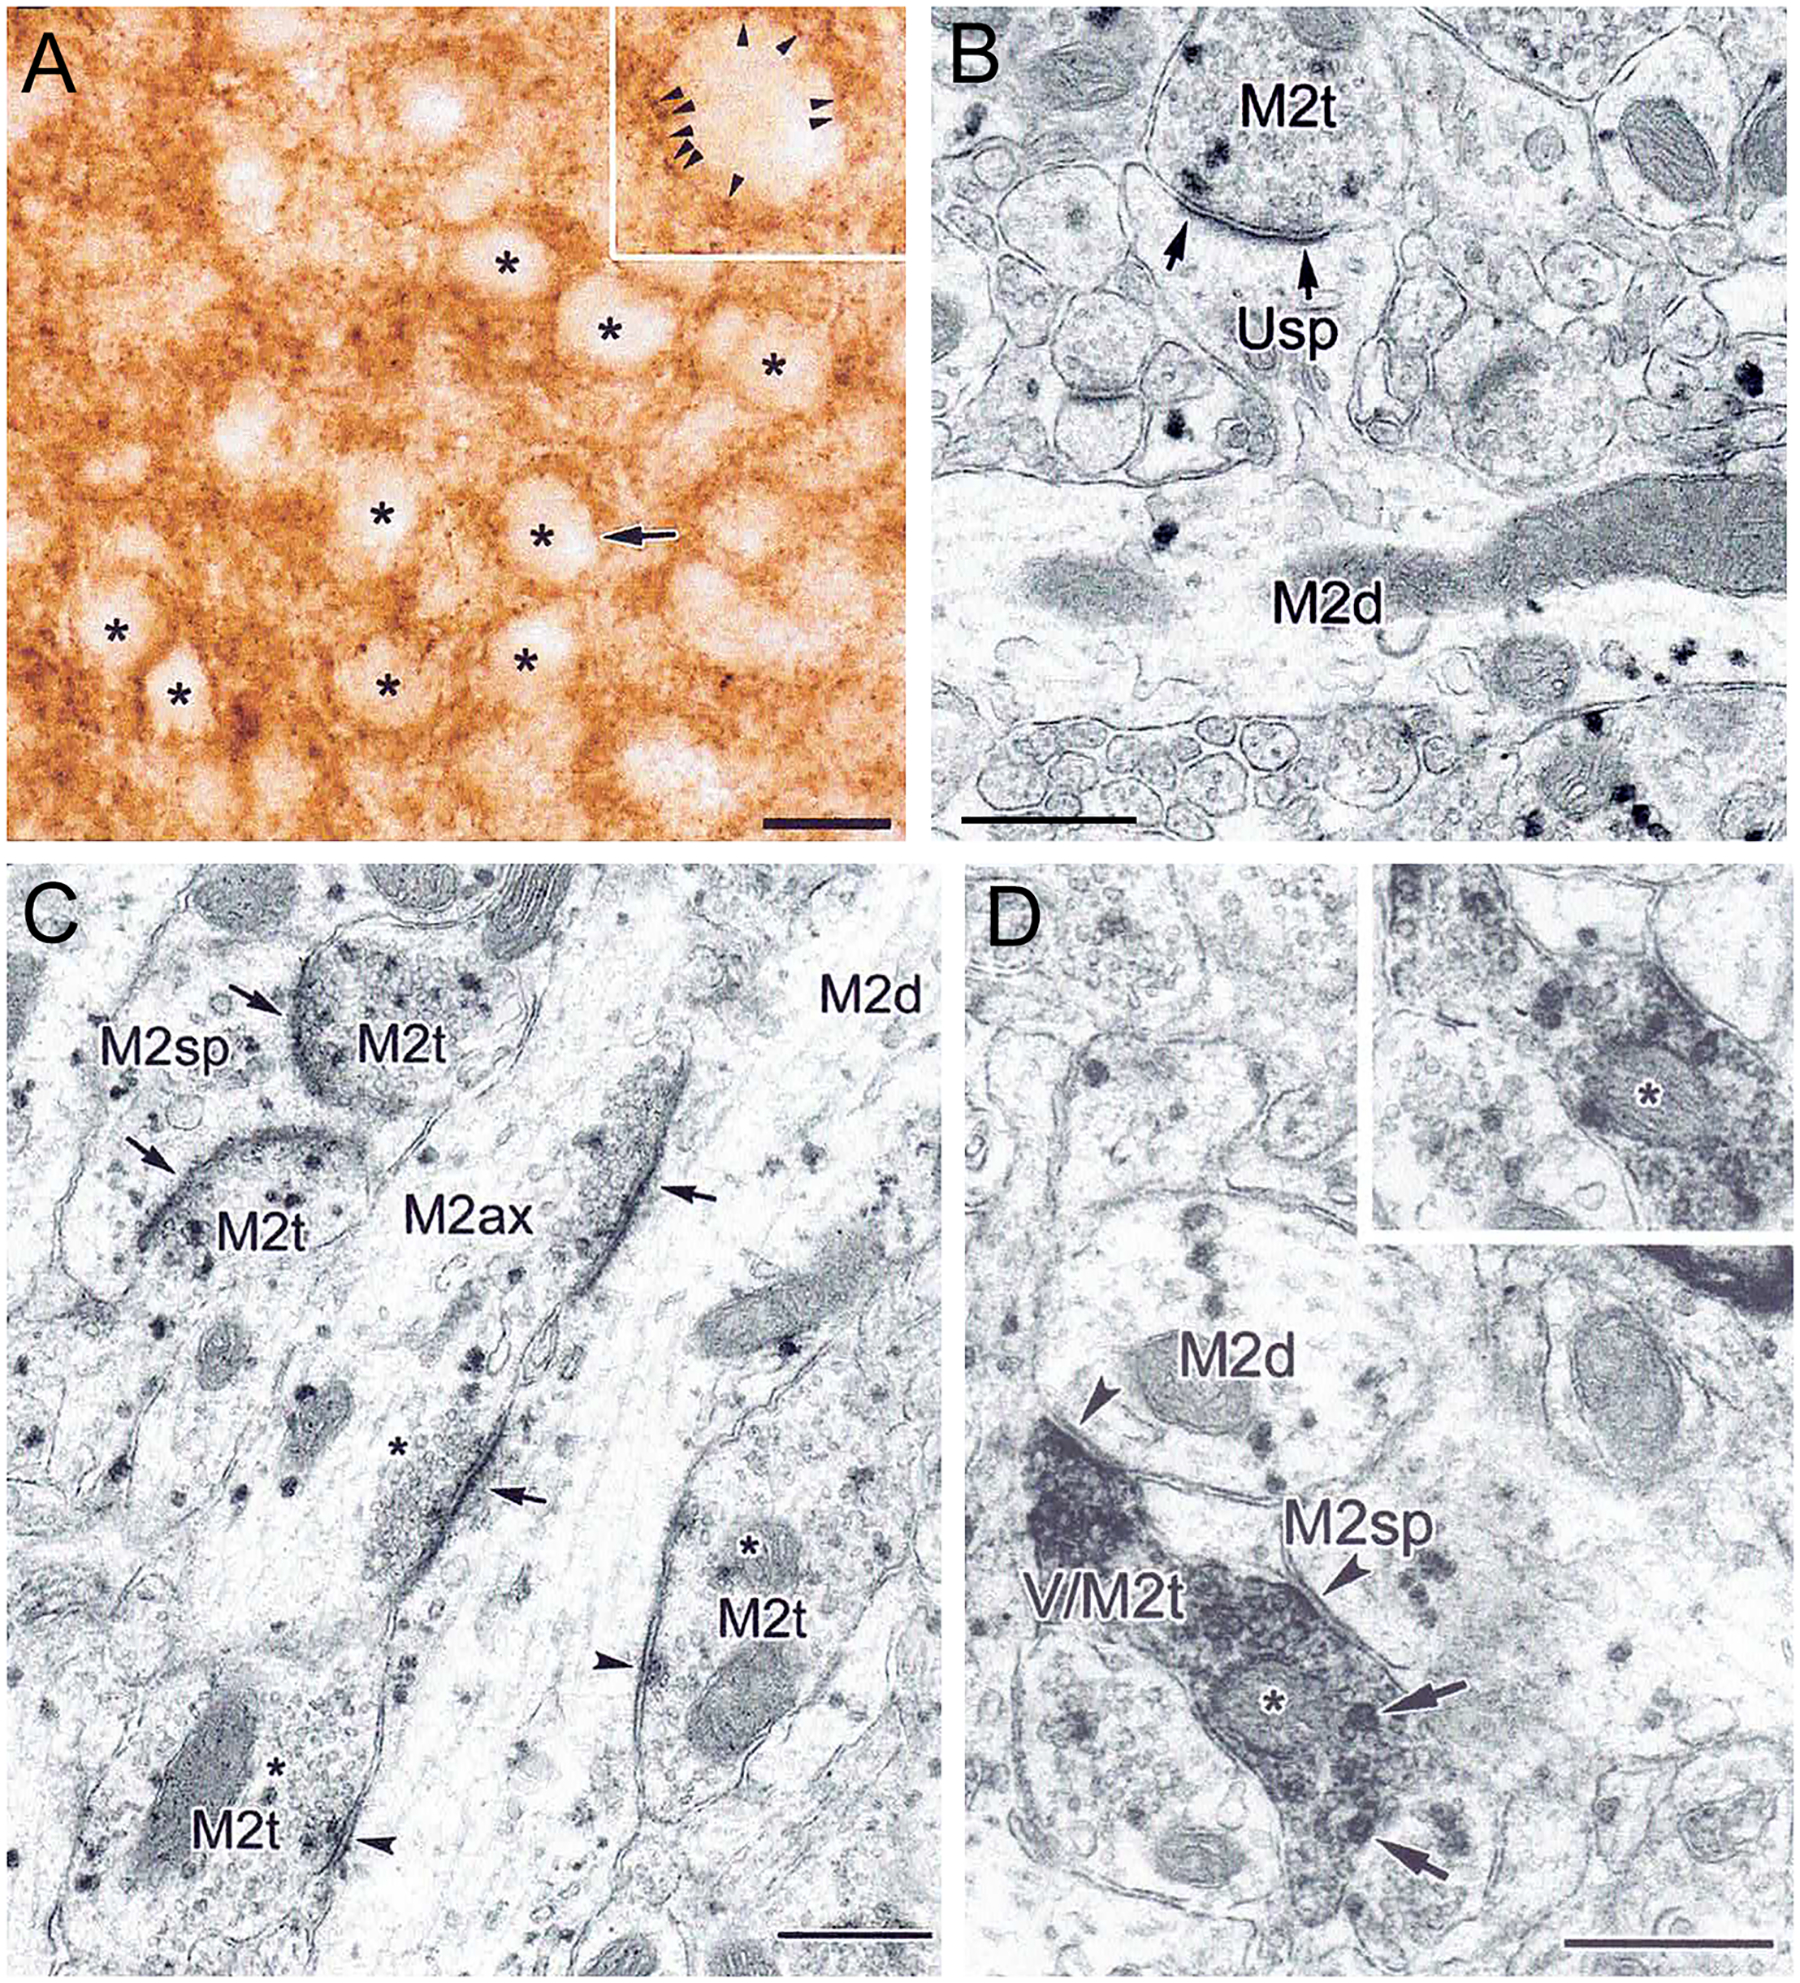
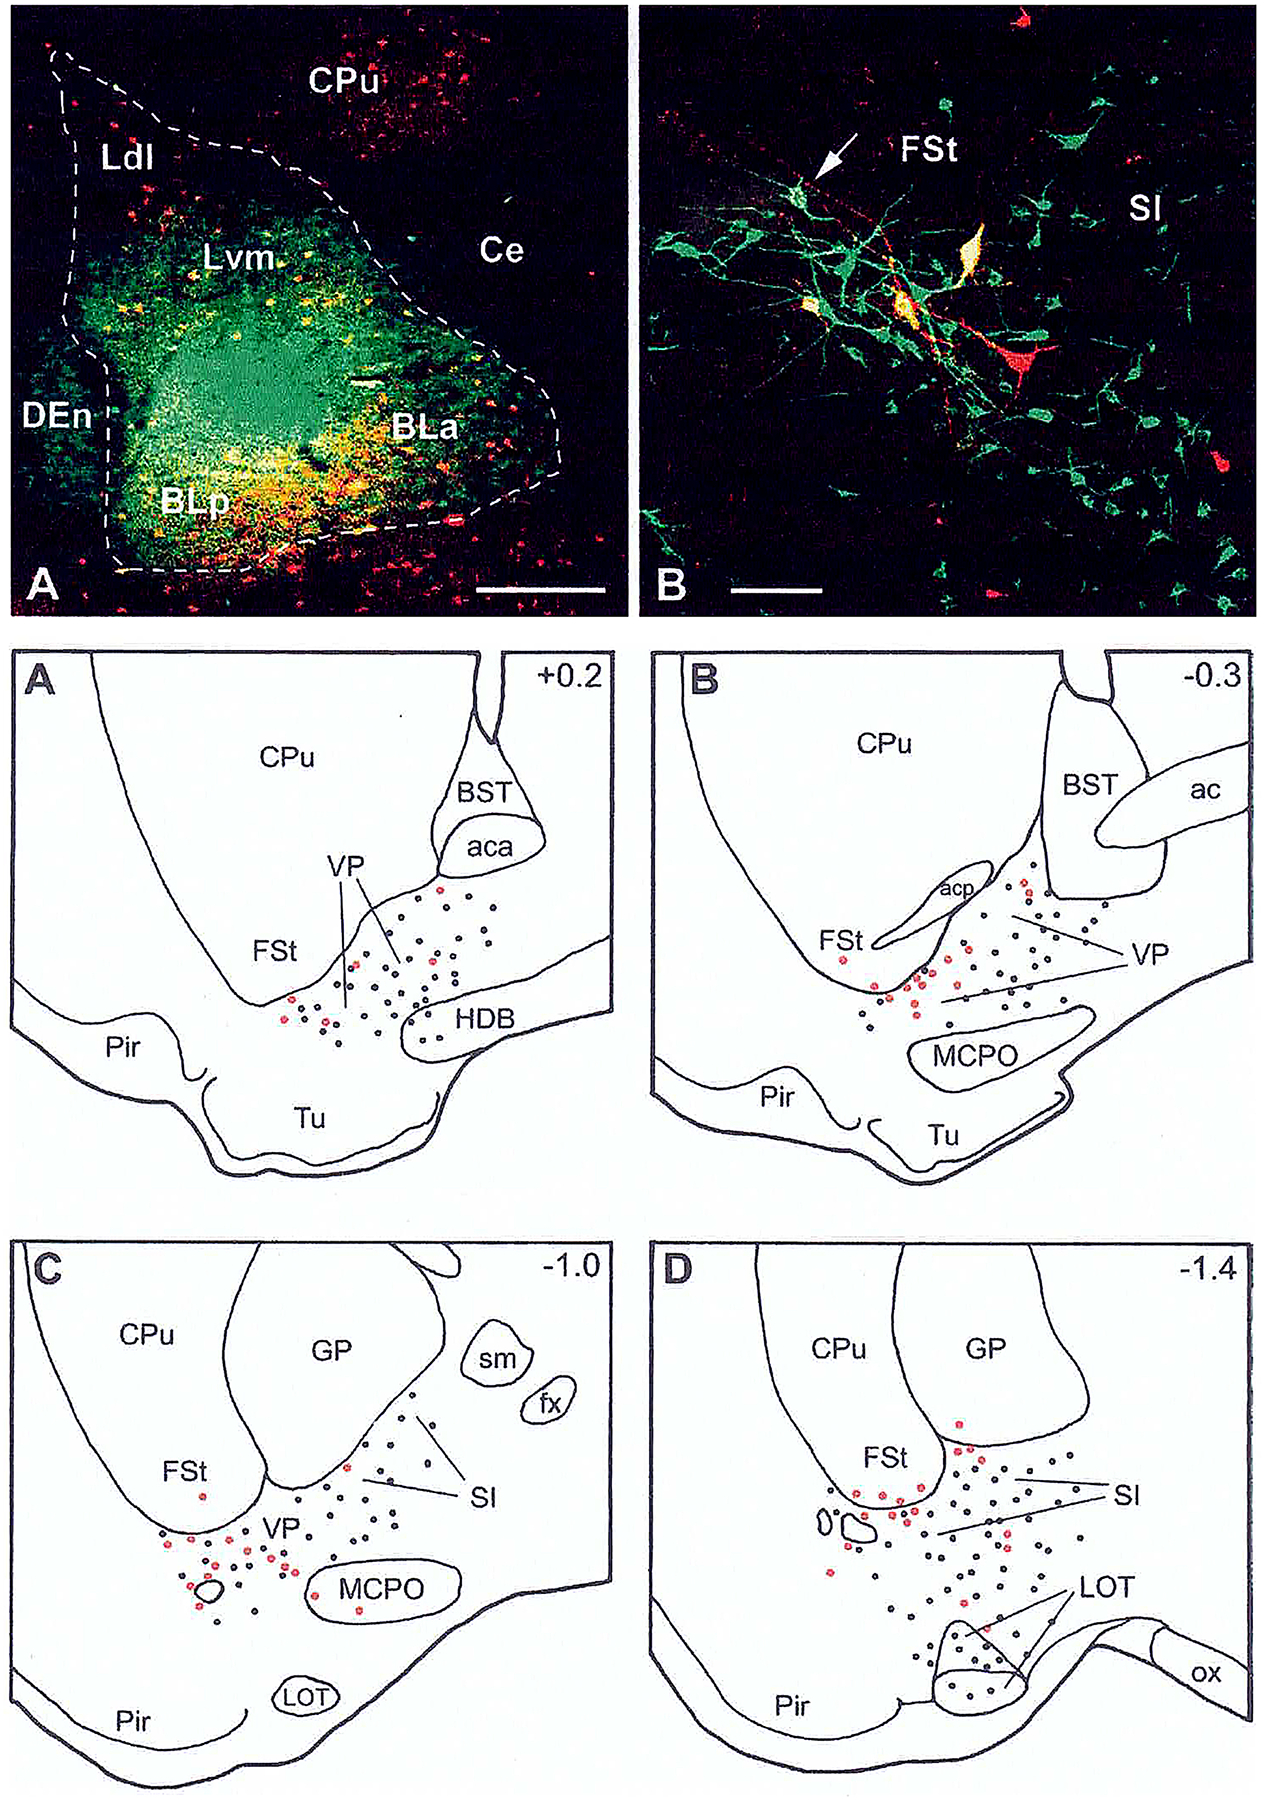
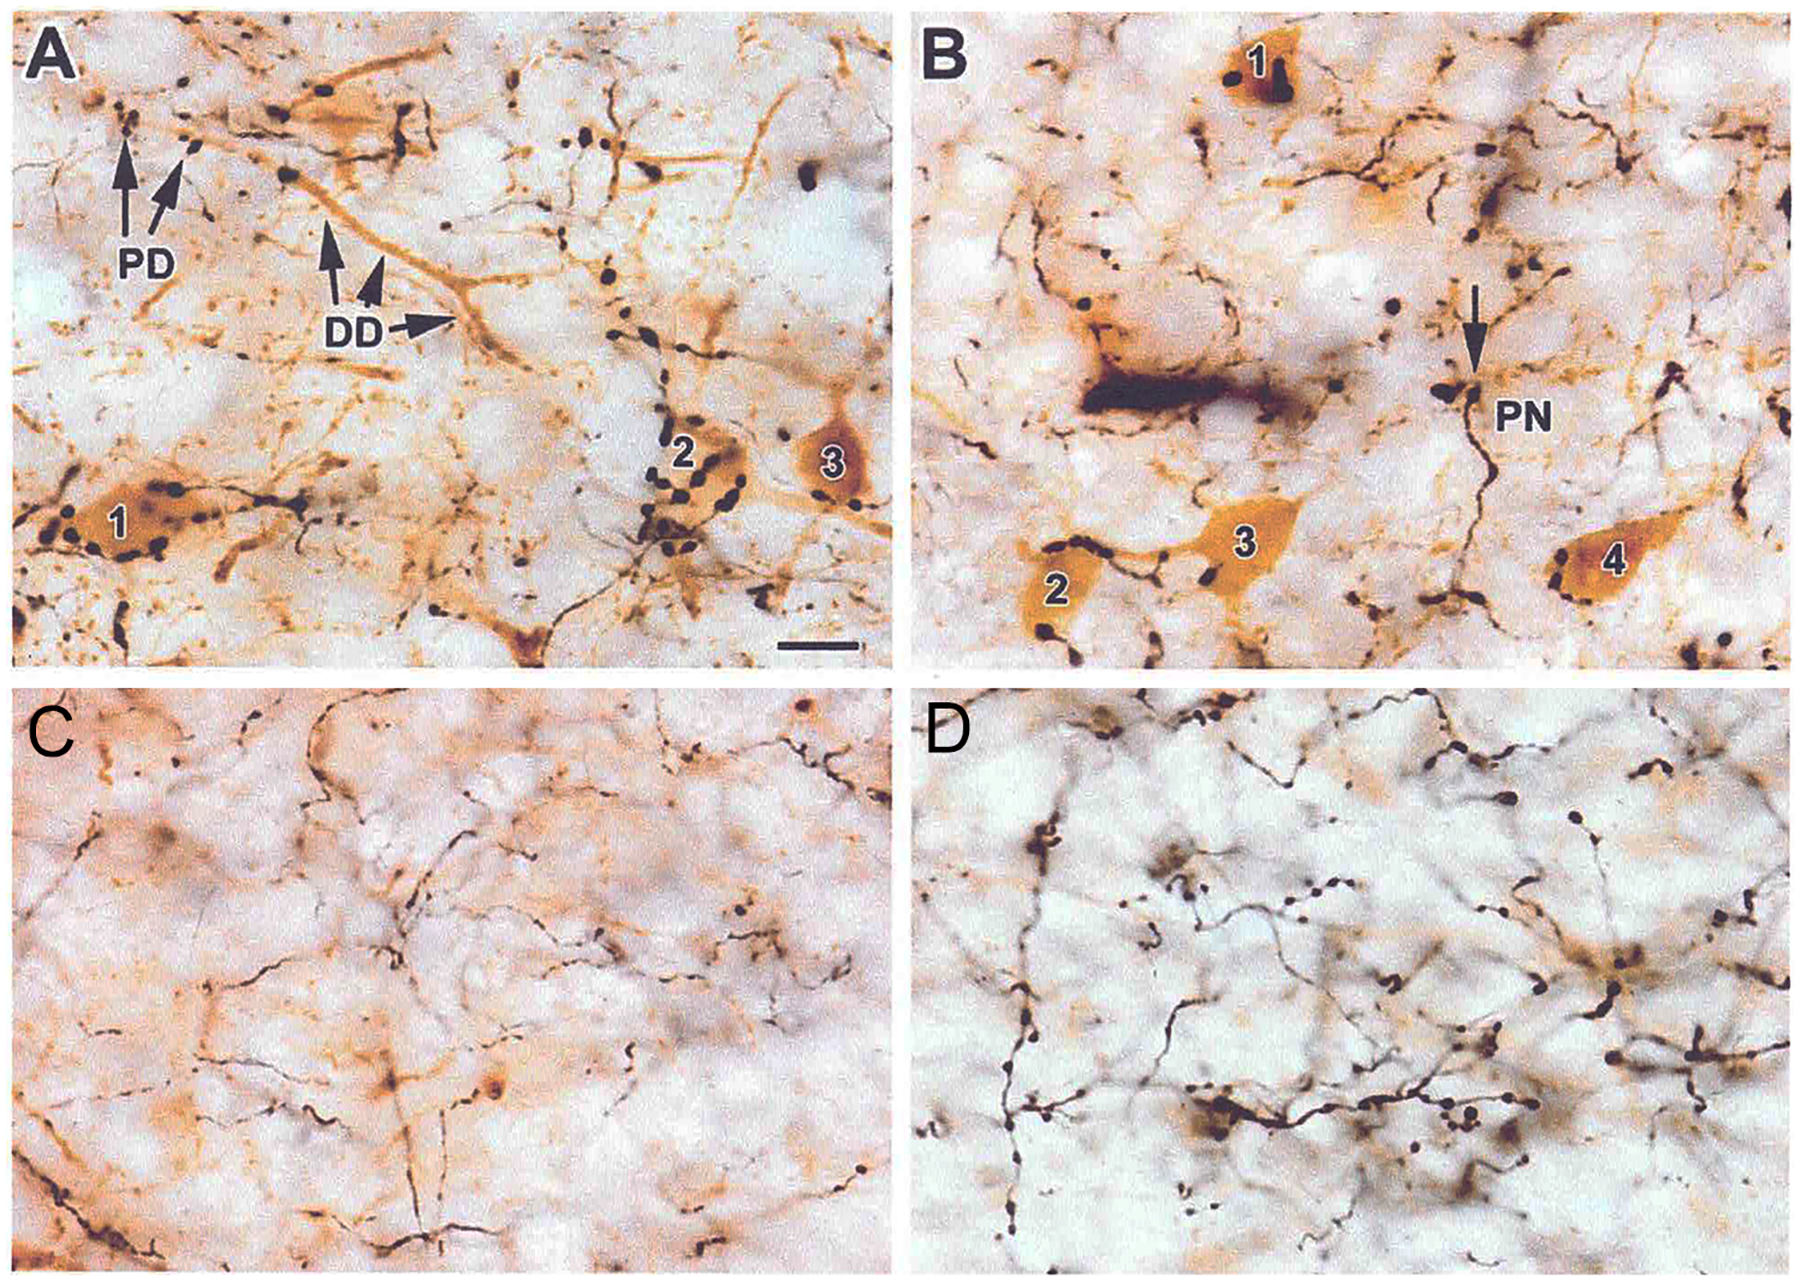
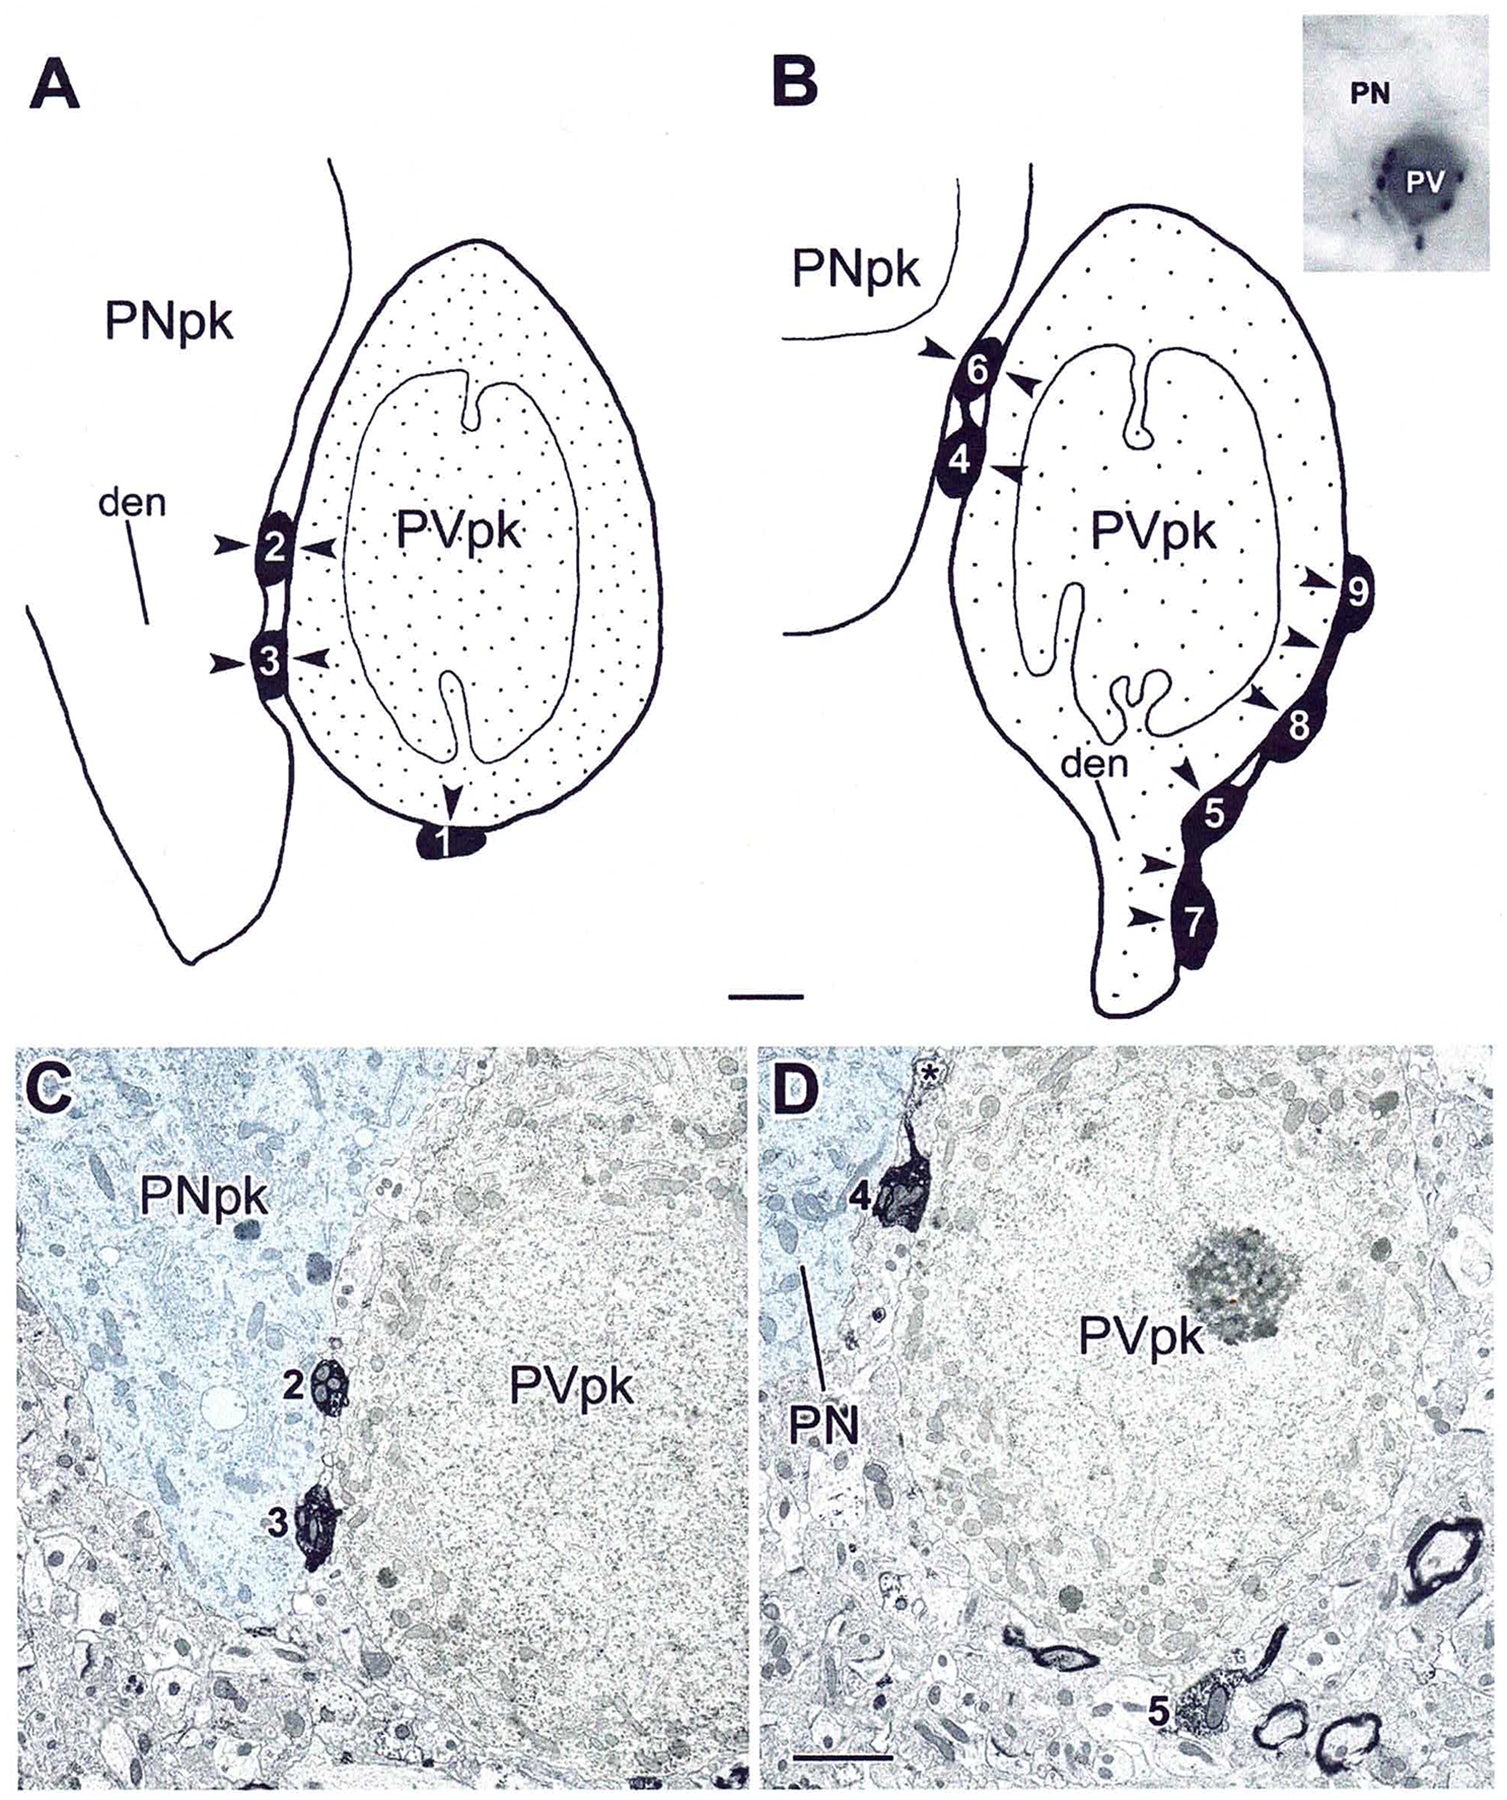
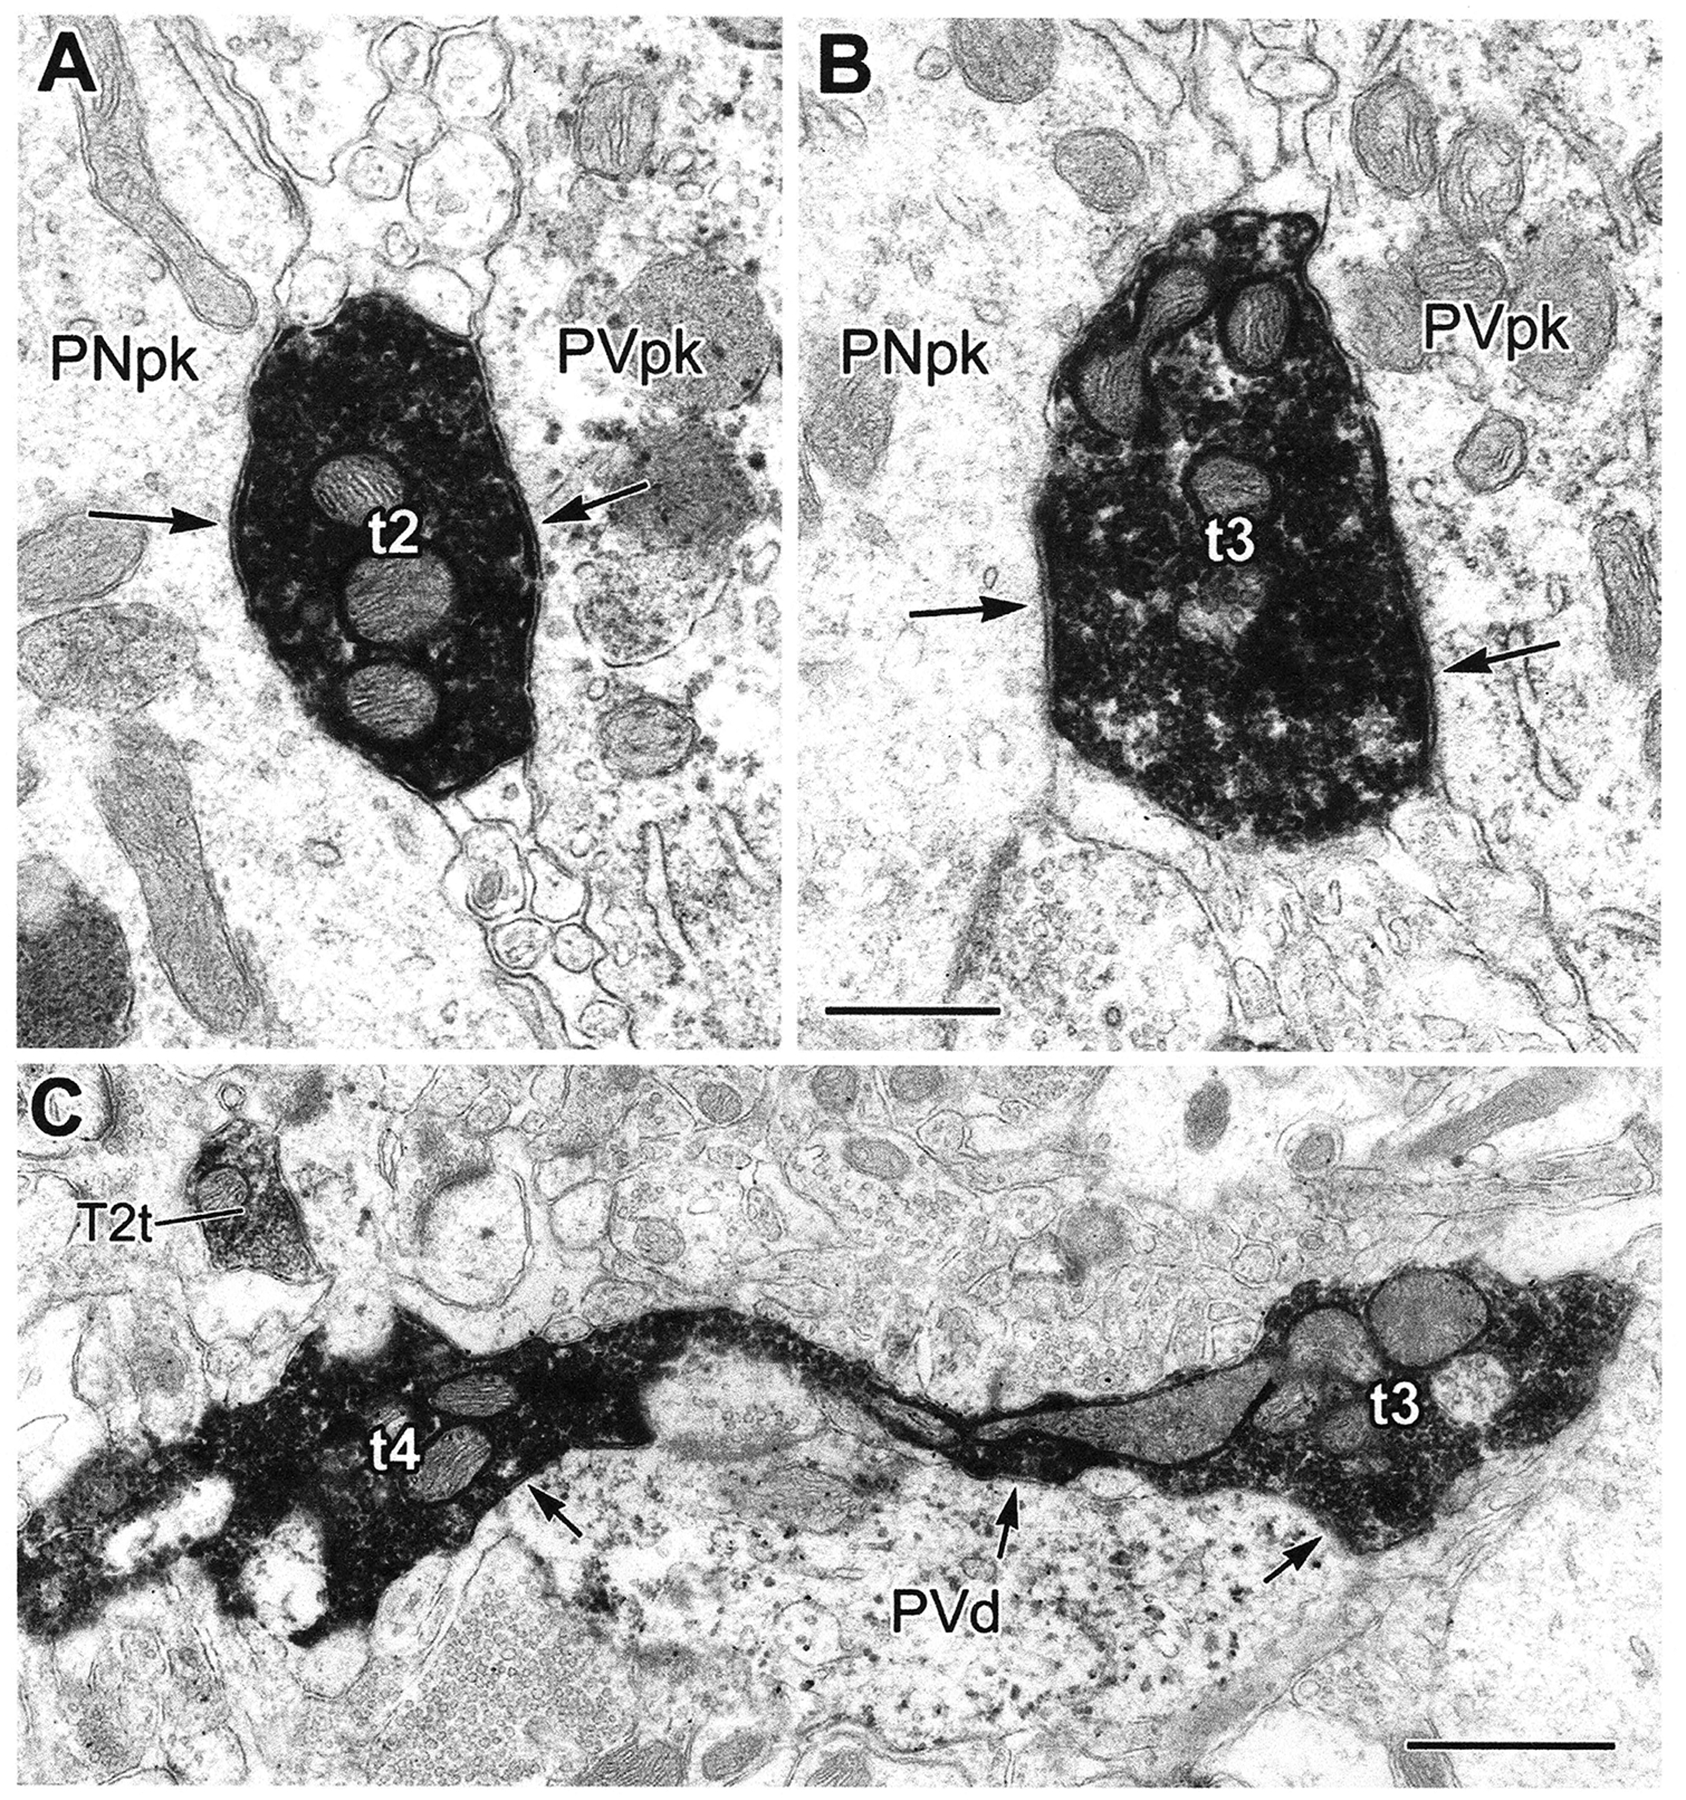
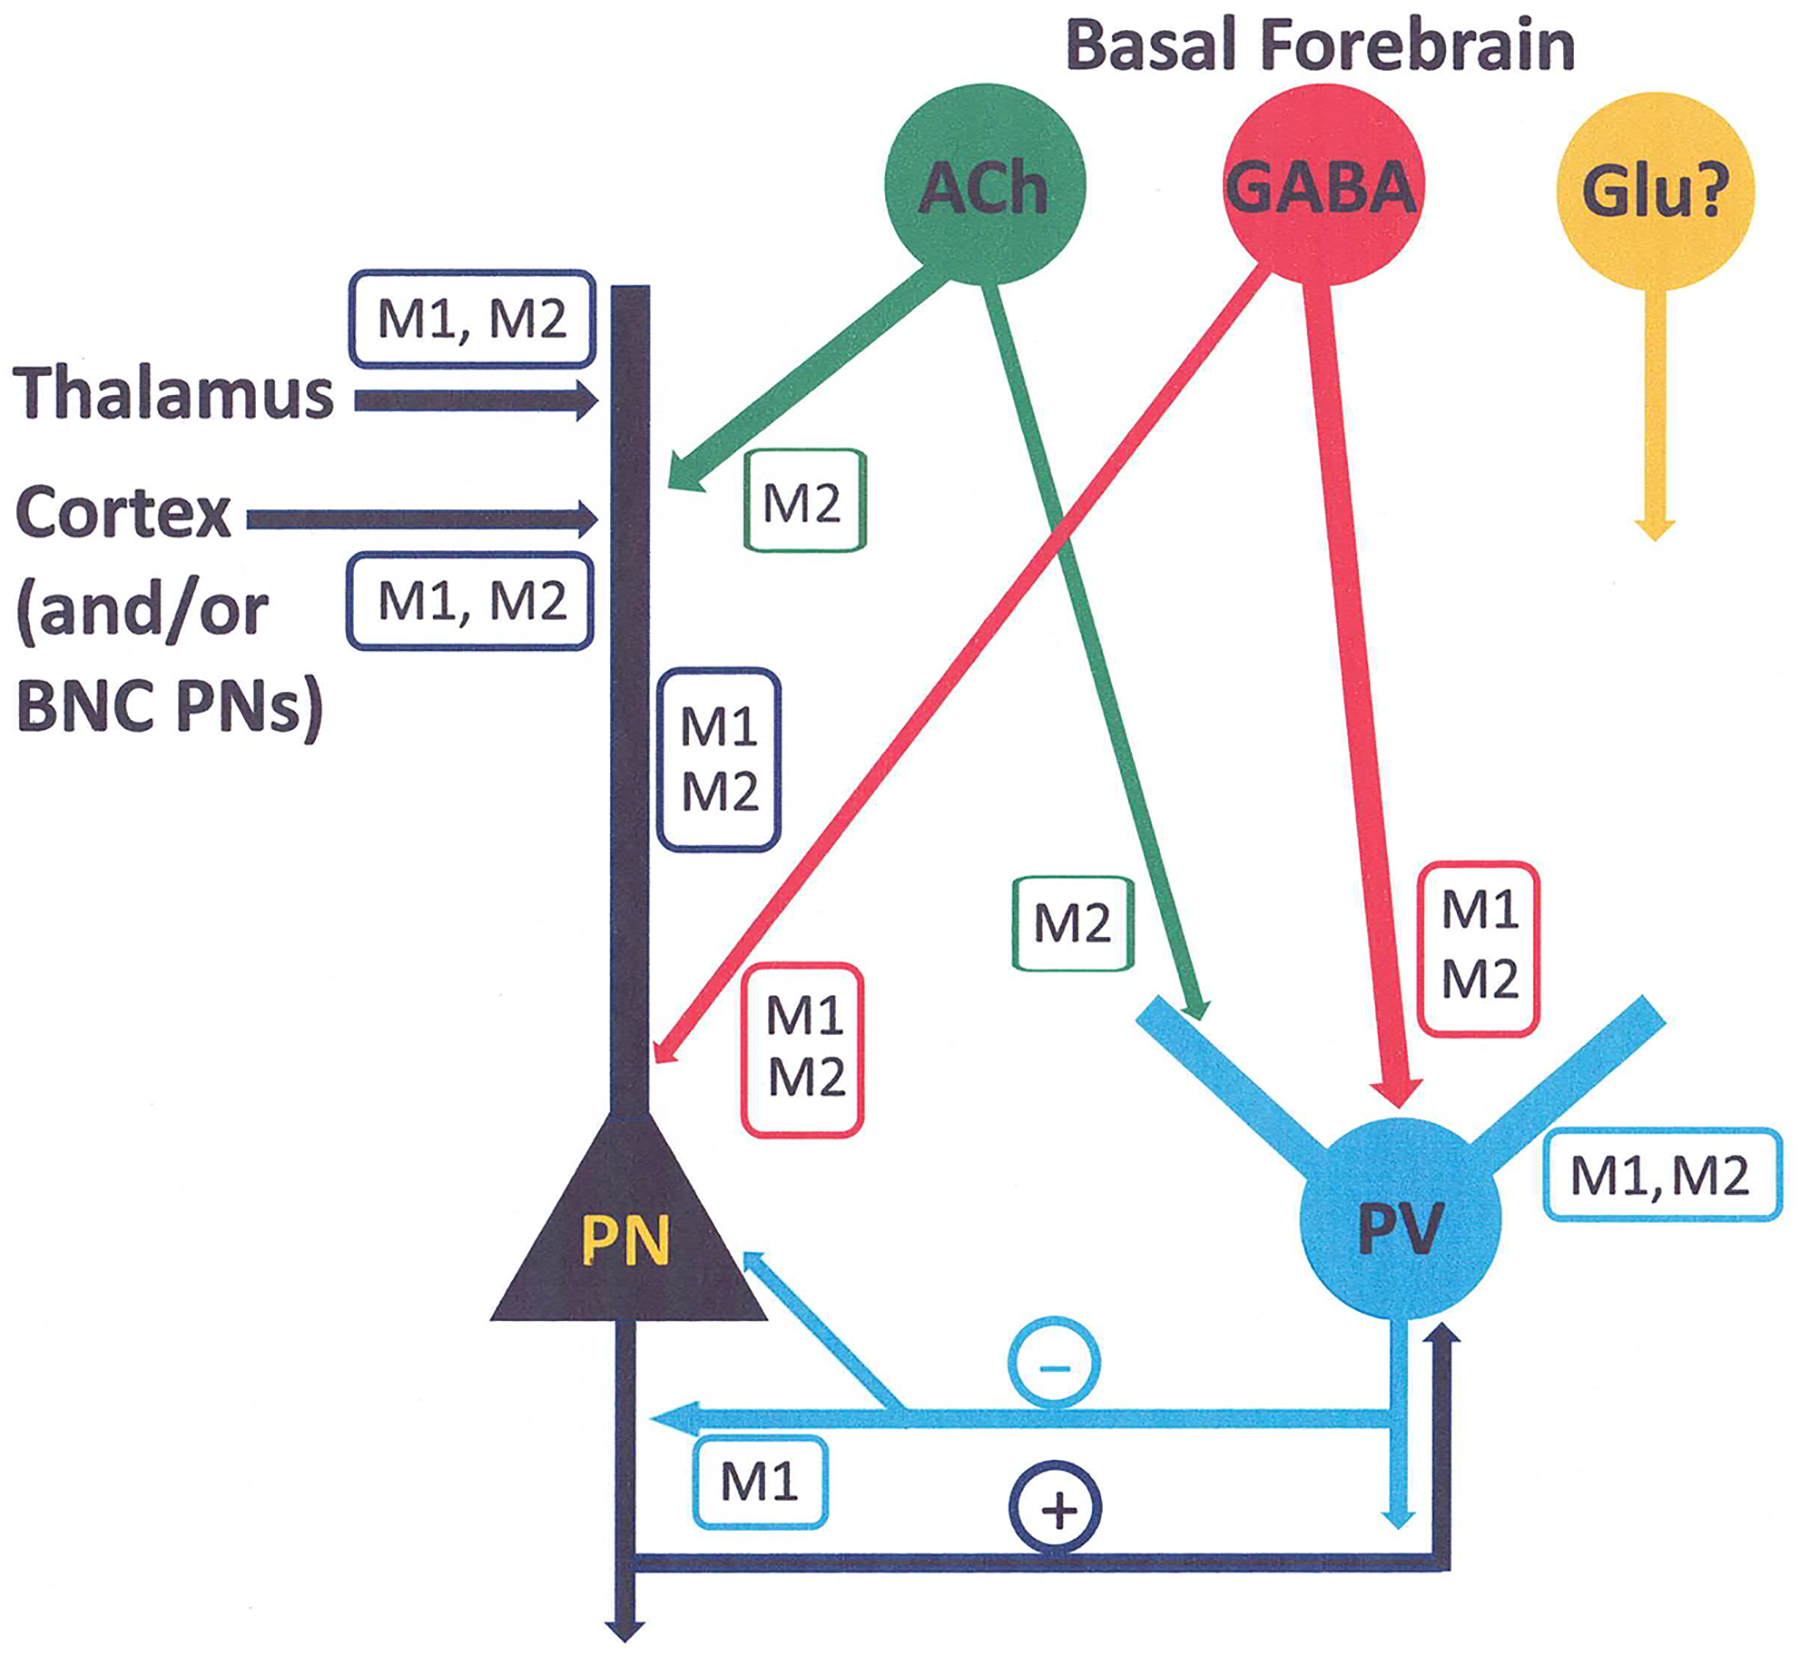
The projections of the basal forebrain (BF) to the hippocampus and neocortex have been extensively studied and shown to be important for higher cognitive functions, including attention, learning, and memory. Much less is known about the BF projections to the basolateral nuclear complex of the amygdala (BNC), although the cholinergic innervation of this region by the BF is actually far more robust than that of cortical areas. This review will focus on light and electron microscopic tract-tracing and immunohistochemical (IHC) studies, many of which were published in the last decade, that have analyzed the relationship of BF inputs and their receptors to specific neuronal subtypes in the BNC in order to better understand the anatomical substrates of BF-BNC circuitry. The results indicate that BF inputs to the BNC mainly target the basolateral nucleus of the BNC (BL) and arise from cholinergic, GABAergic, and perhaps glutamatergic BF neurons. Cholinergic inputs mainly target dendrites and spines of pyramidal neurons (PNs) that express muscarinic receptors (MRs). MRs are also expressed by cholinergic axons, as well as cortical and thalamic axons that synapse with PN dendrites and spines. BF GABAergic axons to the BL also express MRs and mainly target BL interneurons that contain parvalbumin. It is suggested that BF-BL circuitry could be very important for generating rhythmic oscillations known to be critical for emotional learning. BF cholinergic inputs to the BNC might also contribute to memory formation by activating M1 receptors located on PN dendritic shafts and spines that also express NMDA receptors.

Keywords: acetylcholine; electron microscopy; gamma aminobutyric acid; immunohistochemistry; interneurons; pyramidal neurons.


Conflict of interest statement

Conflict of Interest Statement

The author has no conflict of interest to declare.

Figures

Fig. 1.
Fig. 1.
Drawings of a Golgi-stained pyramidal neuron (left) and nonpyramidal neuron (right) in the rat BNC. Note the dense local axonal arborization (thin processes) of the nonpyramidal neuron. Scale bar = 50 μm. Modified from McDonald, 1982, with permission.
Fig. 2.
Fig. 2.
Drawings of coronal sections through the forebrain of the rat (from rostral [A] to caudal [G]) showing the distribution of retrogradely-labeled neurons seen with an injection of Fast Blue into the BL. ChAT+ cholinergic neurons and double-labeled neurons are indicated by filled circles and asterisks, respectively. Squares indicate non-cholinergic neurons of the BF that project to the BL. Reproduced from Carlsen et al., 1985, with permission.
Fig. 3.
Fig. 3.
Innervation of the amygdala by cholinergic VAChT+ axons. (A) Low-power light micrograph of VAChT immunoreactivity at the bregma −2.3 level. Note that the density of VAChT+ axons in the BLa is much greater than in the lateral nucleus (Lat) and that the lateral subdivision of the central nucleus (Ce) contains very few VAChT+ axons. (B) Higher power light micrograph of VAChT+ axons in the BLa at the level of A. (C, D) Low-power light micrographs of VAChT immunoreactivity at the bregma −3.3 level (C) and bregma −4.0 level (D). Scale bars = 150 μm in A; 10 μm in B; 150 μm in D (applies to C, D). Reproduced from Muller et al., 2011, with permission.
Fig. 4.
Fig. 4.
(A–C) Three serial sections showing a CaMK+ PN dendrite (Cd) and its spine (sp, in A) receiving multiple synaptic contacts from VAChT+ terminals (Vt, arrows). CaMK was visualized using the Vector-VIP (V-VIP) immunoperoxidase technique which produces a granular reaction product; VAChT was visualized using the DAB immunoperoxidase technique which produces a diffuse reaction product. The dendritic spine, in addition to receiving synaptic input from a VAChT+ terminal (arrow in A), receives an asymmetrical synaptic contact (arrowhead) from a CaMK+ terminal. (D, E) Serial electron micrographs of a small-caliber CaMK+ dendrite (Cd) and its spine (sp). (D) The spine neck receives a symmetrical synaptic contact from a VAChT+ terminal (Vt, arrow), and the spine head receives a perforated asymmetrical synapse from a CaMK+ terminal (Ct, single arrowheads). The spine also receives symmetrical synaptic contacts from at least two unlabeled terminals (Ut, double arrowheads in A, B), whose small, pleomorphic synaptic vesicles are consistent with their being GABAergic. Scale bars = 0.5 μm for A-C (see C) and for D-E (see E). Modified from Muller et al., 2011, with permission.
Fig. 5.
Fig. 5.
(A) A PV+ dendrite (Pd) receives synaptic input from a VAChT+ terminal (Vt, arrow) as well as asymmetrical synapses from adjacent and nearby unlabeled terminals (Ut, arrowheads). (B) A PV+ dendrite receives synaptic contact from a VAChT+ terminal (Vt, arrow in inset, which is from two thin sections away in the series). This PV+ dendrite also receives asymmetrical synaptic contacts from four nearby unlabeled terminals (Ut, arrowheads), and a symmetrical synapse from a PV+ terminal (Pt, double arrowheads). PV+ dendrites frequently receive multiple asymmetrical (excitatory) synapses. Scale bars = 0.5 μm. Reproduced from Muller et al., 2011, with permission.
Fig. 6.
Fig. 6.
M1R-ir in the rat amygdala. (A and C) Low power photomicrographs of M1R-ir at rostral and middle levels of the amygdala, respectively. (B and D) Higher power photomicrographs of the BNC at the same levels as A and C, respectively. (E) Representative M1R+/CaMK+ double-labeled PNs in the BLa. Arrows indicate proximal dendrites. Scale bars = 400 μm in C (A is at the same magnification); 200 μm in D (B is at the same magnification); 20 μm in E. Reproduced from McDonald and Mascagni 2010, with permission.
Fig. 7.
Fig. 7.
M1R-ir in the BLa at the EM level. (A) Bottom: An M1R+ dendrite (M1d) gives rise to a M1R+ spine (sp) that receives asymmetrical synaptic contact from an adjacent unlabeled terminal (Ut, arrowhead; DAB immunoperoxidase technique). Middle: An unlabeled terminal (t) forms an asymmetrical synapse with an M1R+ spine (M1sp). Top: an unlabeled spine (sp) receives asymmetrical synaptic contact from an unlabeled terminal (Ut, arrowhead), and a symmetrical synaptic contact from an M1R+ terminal (M1t, asterisk). (B) An M1R+ dendrite (M1d) receives asymmetrical synaptic contacts (arrowheads) from a lightly immunoreactive terminal (M1t) and three unlabeled terminals (Ut). This synaptic configuration involving multiple excitatory inputs to dendritic shafts is typical of IN dendrites, especially those of PV INs (see Fig. 5B). (C) An M1R+ terminal (M1t) makes an asymmetrical synaptic contact with an M1R+ dendrite (M1d, arrow) and an unlabeled spine (Usp, arrow) (V-VIP immunoperoxidase technique). Note the characteristic presynaptic location of granular M1R reaction product in the terminal at both synapses. (D) An M1R+ presumptive PV terminal (M1t) forms a symmetrical synapse with an M1R+ axon initial segment (M1ais). (E) An M1R+ spine (M1sp) receives a symmetrical synaptic contact from a VAChT+ terminal (Vt, arrowhead), and an asymmetrical synapse from an M1R+ terminal (M1t, asterisk) (DAB immunoperoxidase technique for VAChT, V-VIP immunoperoxidase technique for M1R). Scale bars = 0.5 μm for all micrographs. Modified from Muller et al., 2013, with permission.
Fig. 8.
Fig. 8.
VGluT1+ (V1t) and VGluT2+ axon terminals (V2t) form asymmetrical synapses with M1R + spines (Ms) in the BLa. (A, B) VGluT1+ terminals form asymmetrical synapses (arrows) with M1R+ spines. (C, D) VGluT2+ axon terminals form asymmetrical synapses with M1R+ spines (Ms). Arrowheads in A and B indicate representative M1R+ particles near the pre- or postsynaptic densities. Similar immunoparticles are seen in C and D. Scale bar = 0.5 μm for all photos. Modified from McDonald et al., 2019, with permission.
Fig. 9.
Fig. 9.
Terminals immunoreactive for both VGluT1 and M1R (V1/Mt) (A and B) and for both VGluT2 and M1R (V2/Mt) (C, D) form asymmetrical synapses (arrows) with M1R+ spines (Ms) and unlabeled M1R-negative spines (Us) in the BLa. Arrowheads indicate M1R+ immunoparticles in terminals. Scale bar = 0.5 μm for all photos. Reproduced from McDonald et al., 2019, with permission.
Fig. 10.
Fig. 10.
Top: (A–D) Low power photomicrographs of M2R immunoreactivity at four levels of the amygdala (from rostral [A] to caudal [D]. Scale bar = 0.5 mm. Bottom: (A-D) Drawings showing the locations of M2R+ neurons (dots) at the four levels of the amygdala shown in the top photomicrograph. Neurons were plotted from three adjacent sections at each level. Modified from McDonald and Mascagni, 2011, with permission.
Fig. 11.
Fig. 11.
Immunofluorescence photomicrographs of M2R+ nonpyramidal cells in the lateral amygdalar nucleus. (A1) An M2R+ neuron (green) is seen in the upper portion of this field, and the edge of another M2R+ neuron is seen in the lower left corner. (A2) GAD+ neurons in the same field as A1(red). (A3) Merged image of A1 and A2. Co-expression of M2R and GAD is indicated in yellow. Note yellow labeling of both M2R+ neurons seen in A1. (B) M2R+ structures (green) and SOM+ neurons (red) in a merged image. The single M2R+ neuron in this field co-expresses SOM (yellow). (C) M2R+ neuron (green) and PV+ neurons (red) in a merged image. The single M2R+ neuron in this field does not express PV. Scale bars: 25 μm in A, 20 μm in C (B is at the same magnification as C). Modified from McDonald and Mascagni, 2011, with permission.
Fig. 12.
Fig. 12.
(A) LM photomicrograph of M2R-ir in the BLa. There is dense neuropilar staining but little or no M2R-ir in neuronal cell bodies (asterisks). Also note that there are M2R+ puncta, most likely corresponding to PV+ axon terminals, in apparent contact with some of the cell bodies (inset shows 10 such puncta [arrowheads] contacting the cell body of the neuron indicated by an arrow). (B) EM of an M2R+ dendrite (M2d) giving rise to a large, unlabeled, mushroom-shaped spine (Usp) that receives asymmetrical synaptic input from an M2R+ terminal (M2t, arrows). (C) Variety of synaptic inputs onto an M2R+ dendrite (right) and nearby spine (left). The multiple asymmetrical synapses with this dendrite indicates that it belongs to an IN. (D) A VAChT+/M2R+ co-labeled axon with two terminal swellings (V/M2t) forms symmetrical synaptic contacts (arrowheads) with an M2R+ dendrite (M2d) and an adjacent M2R+ spine (M2sp). Inset: Serial section of the VAChT/M2R1 co-labeled axon (asterisk) in which the diffuse DAB label for VAChT is paler, revealing the granular V-VIP label for M2R-ir more clearly. Scale bars = 20 μm in A, 0.5 μm in B-D. Modified from McDonald and Mascagni, 2016, and Fajardo-Serrano et al., 2017, with permission.
Fig. 13.
Fig. 13.
Top: (A) Injection site of Fluorogold (FG) retrograde tracer into the BNC. Section is stained for FG (green) and PV (red). (B) FG+ neurons (green), PV+ neurons (red), and three double-labeled PV+/FG+ neurons (yellow) in the far lateral part of the substantia innominata seen with the injection shown in A. In addition, there is another double-labeled FG+ neuron with light PV labeling (arrow). Scale bars = 500 μm in A, 100 μm in B. Bottom: Plots of single-labeled FG+ neurons (black dots) and double-labeled PV+/FG+ neurons (red dots) at four levels of the BF arranged from rostral (A) to caudal (D). Single-labeled FG+ neurons are plotted from one section, whereas double-labeled PV+/FG+ neurons are plotted from three sections so that the spatial distribution of the latter cells can be better appreciated. Modified from McDonald et al., 2011, with permission.
Fig. 14.
Fig. 14.
PHA-L labeled axons in the basolateral nucleus after an injection of the anterograde tracer PHA-L into the BF. (A, B) PHA-L-labeled type 1 axons (black) innervating PV+ somata (brown; numbered), proximal dendrites (PD), and distal dendrites of PV+ neurons in the BLa. One type 1 axon contacts an unlabeled soma of a presumptive PN (arrow in B). (C) Type 2 axons (black) in the BLa. (D) Type 3 axons (black) in the BLa. Note that the varicosities are smaller than most type 1 varicosities and larger than type 2 axons. Scale bar in A = 10 μm (B-D are at the same magnification). Modified from McDonald et al., 2011, with permission.
Fig. 15.
Fig. 15.
Synaptic contacts from type 1 PHA-L+ terminals with the perikaryon of a PV+ IN (PVpk) and an unlabeled putative PN (PNpk) in the BLa (inset in B). (A, B) Schematic drawings, at two levels, of a single PV+ IN perikaryon (PVpk, stipple) in the BLa, receiving synaptic inputs (arrowheads) from nine large (>1.5 μm in diameter) PHA-L+ terminals (black, with white numbers) from type 1 axons projecting from the basal forebrain. Terminals 2, 3, and 6 also make synaptic contacts (arrowheads) onto an adjacent unlabeled putative PN perikaryon. (C, D) Representative EMs of the series that were traced to produce the drawings in A and B. Scale bars = 2 μm. Reproduced from McDonald et al., 2011, with permission.
Fig. 16.
Fig. 16.
(A, B) Higher power EMs of PHA-L+ type 1 terminals 2 and 3 (t2, t3) shown in Fig. 15 making synaptic contacts (arrows) onto the PV+ perikaryon (PVpk) and a putative PN perikaryon (PNpk). C) Two type 1 terminals from a different type 1 axon (t4 and t3) synapse with a PV+ dendrite (PVd) in the BLa. A small type 2 terminal (T2t) is seen nearby for comparison. Scale bars = 0.5 μm for both micrographs. Reproduced from McDonald et al., 2011, with permission.
Fig. 17.
Fig. 17.
Summary diagram illustrating the innervation of BNC PNs and PV+ INs by cholinergic and GABAergic neurons of the BF, including what is currently known about the muscarinic receptors expressed by these BNC structures. The relative strength of the BF projections to BNC neurons is indicated by the thickness of the lines. There are also M1Rs and M2Rs in the axon terminals of basket cells, it is not clear if they belong to PV INs, CCK INs, or both. Whereas cell counts in retrograde tract tracing studies suggest that some of the BF neurons innervating the BNC are not cholinergic or GABAergic, there have been no studies that have attempted to determine if they are glutamatergic (Glu?), like those innervating the cortex. Not included in the diagram are cholinergic inputs to VIP+, SOM+, and CCK+ INs that have been revealed using rabies-based cell type-specific monosynaptic retrograde tracing.

Similar articles

Cited by

References

    1. Agnati LF, Guidolin D, Guescini M, Genedani S, Fuxe K (2010) Understanding wiring and volume transmission. Brain Res Rev 64:137–159. - PubMed
    1. Aitta-Aho T, Hay YA, Phillips BU, Saksida LM, Bussey TJ, Paulsen O, Apergis-Schoute J (2018) Basal forebrain and brainstem cholinergic neurons differentially impact amygdala circuits and learning-related behavior. Curr Biol. 28:2557–2569. - PubMed
    1. Alger BE, Nagode DA, Tang AH (2014) Muscarinic cholinergic receptors modulate inhibitory synaptic rhythms in hippocampus and neocortex. Front Synaptic Neurosci. 6:18. - PMC - PubMed
    1. Amaral DG, Bassett JL (1989) Cholinergic innervation of the monkey amygdala: an immunohistochemical analysis with antisera to choline acetyltransferase. J Comp Neurol 281: 337–361. - PubMed
    1. Amaral DG, Price JL, Pitkanen A, and Carmichael ST (1992) Anatomical organization of the primate amygdala. In: The Amygdala. Neurobiological aspects of emotion, memory, and mental dysfunction. (Aggleton JP, ed), pp. 1–66. New York: Wiley-Liss.

Publication types

Substances

LinkOut - more resources