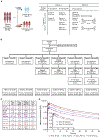
Clinical Trial
. 2024 Mar 28;187(7):1666-1684.e26.
doi: 10.1016/j.cell.2024.02.023. Epub 2024 Mar 14.

First-in-class MKK4 inhibitors enhance liver regeneration and prevent liver failure

Affiliations
Clinical Trial

First-in-class MKK4 inhibitors enhance liver regeneration and prevent liver failure

Stefan Zwirner et al. Cell. .

Abstract

Diminished hepatocyte regeneration is a key feature of acute and chronic liver diseases and after extended liver resections, resulting in the inability to maintain or restore a sufficient functional liver mass. Therapies to restore hepatocyte regeneration are lacking, making liver transplantation the only curative option for end-stage liver disease. Here, we report on the structure-based development and characterization (nuclear magnetic resonance [NMR] spectroscopy) of first-in-class small molecule inhibitors of the dual-specificity kinase MKK4 (MKK4i). MKK4i increased liver regeneration upon hepatectomy in murine and porcine models, allowed for survival of pigs in a lethal 85% hepatectomy model, and showed antisteatotic and antifibrotic effects in liver disease mouse models. A first-in-human phase I trial (European Union Drug Regulating Authorities Clinical Trials [EudraCT] 2021-000193-28) with the clinical candidate HRX215 was conducted and revealed excellent safety and pharmacokinetics. Clinical trials to probe HRX215 for prevention/treatment of liver failure after extensive oncological liver resections or after transplantation of small grafts are warranted.

Keywords: MKK4; drug discovery and development; first-in-human phase I trial; liver; liver failure; liver regeneration; partial hepatectomy.


Conflict of interest statement

Declaration of interests L.Z. and T.W. are co-inventors of the patent WO 2012/136859. L.Z., S.L., and A.P. are founders, shareholders, and scientific advisors of HepaRegeniX (HRX) GmbH. B.J., D.S., and M.W. are advisors of HRX. W.A., R.S., and S.Z. are employees of HRX. E.A.B., M.O.Z., and S.T. are employees of ZoBio. M.S. received research support and funding from Green Cross WellBeing Co. Ltd., Gilead Sciences Inc., Robert Bosch GmbH, CORAT Therapeutics GmbH, Agena Bioscience, HepaRegeniX GmbH, and CED Services GmbH.

Figures
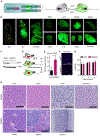
Figure 1.
Figure 1.. Genetic knockdown of MKK4 enhances liver regeneration and reveals long-term safety in mice
(A) Generation of shRNA-transgenic mice. TRE-GFP-shMKK4 or TRE-GFP-shNC mice were crossed with pCaggs-rtTA3 mice to enable dox-inducible ubiquitous MKK4 knockdown. (B) Measurement of GFP expression as a surrogate marker for shRNA expression in the indicated organs after 3 days of dox administration. Shown are GFP fluorescence images of a representative mouse, three mice per group were analyzed. (C) Immunoblot analysis reveals shRNA-mediated MKK4 knockdown in mouse livers after 5 days of dox administration (pooled lysates from two mouse livers). (D) Partial hepatectomy (PH) experiments in shRNA transgenic mice. Dox was administered 72 h before PH. Mouse livers were harvested and analyzed 48 h after partial hepatectomy. (E) Quantification of Ki67-positive cells on liver sections from shNC vs. shMKK4 mice. Statistical significance was calculated using unpaired t test (n = 3), p value: p = 0.0209. Mean + SD. (F) Representative immunofluorescence images of merged Ki67 (pink) and DAPI (blue) stainings in shNC vs. shMKK4 murine livers under conditions as described in (E). Scale bars represent 200 μm. (G) Body weight of shNC and shMKK4 mice during 12 months of continuous dox administration. Statistical significance was calculated using Sídák′s multiple comparison test (n = 3), p values: p = 0.9959 (0 months), p = 0.9898 (4 months), p = 0.8977 (12 months), mean + SD. (H) Representative H&E stainings of indicated organs after 12 months of genetic MKK4 suppression. Scale bars represent 200 μm. See also Figure S1.
Figure 2.
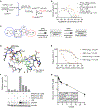
Figure 2.. Development and characterization of potent and selective small molecule-MKK4 inhibitors
(A) A 33P-y-ATP based cascade assay to quantify modulation of MKK4 activation upon compound binding measured by a 33P-JNK readout. (B) Dose-response relationships for the indicated 1st, 2nd, and 3rd generation MKK4 inhibitors as determined in a MKK4 radio-cascade assay. Concentrations were applied in singlicates. (C) Overview of MKK4-inhibitor drug development starting with the chemical structure of vemurafenib that underwent modifications and eventually resulted in LN3348 (HRX215). (D) Binding mode of LN3162 (pale green 3D-skeletal formula) at MKK4 (gray 3D-skeletal formula) as determined by NMR-spectroscopy. Involved amino acids are indicated. The cyan dashed line indicates the tentative Cys-SH hydrogen bond with the ligand fluorine at the 2-position. The other H-bonds are shown as red dashed lines. (E) HRX215 selectivity profile. Dose-response relationship for 10 concentrations (10−4 to 3 × 10⁻⁹ M) of HRX215 and kinase activity of MKK4, JNK1, BRAF, wild type (WT) and MKK7 in a radiometric protein kinase assay are shown. Concentrations were applied as singlicates. (F) Target engagement assay with indicated concentrations of HRX215 conducted with isolated PBMCs. Lysates were analyzed by immunoblotting using an antibody against p-MKK4 (S257), and intensities were quantified (p-MKK4/Vinculin). (G) Pharmacokinetics of HRX215 as determined in C57BL6/N WT mice. HRX215 was administered at 30 mg/kg per oral (p.o.) Blood concentrations of HRX215 were measured between 5 and 24 h (n = 3 each). Mean ± SD. See also Figure S2.
Figure 3.
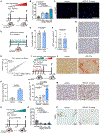
Figure 3.. HRX215 increases hepatocyte proliferation upon partial hepatectomy and attenuates apoptosis in a CCl4 liver damage model
(A) Partial hepatectomy (PH) experiments conducted in C57BL/6 WT mice treated with HRX215 (at 0.4, 2, 10 mg/kg) or vehicle (p.o.). Mice were euthanized after 48 h. (B) Quantification of Ki67/DAPI stainings conducted on liver sections from mice as described in (A). Statistical significance was calculated using the Dunnett’s multiple comparisons test (n ranged from 4 to 10 per group). p values: p = 0.0131 (0.4 mg/kg HRX215), p = 0.0554 (2 mg/kg HRX215), p < 0.0001 (10 mg/kg HRX215). Mean ± SEM. (C) Representative images of the Ki67 (red) and DAPI (blue) stainings on liver sections from mice as described in (A). Ki67/DAPI stainings for vehicle (left) and HRX215 (10 mg/kg, right) are shown. Scale bars indicate 100 μm. (D) C57BL/6 WT mice were treated with HRX215 (10 mg/kg) or vehicle via oral gavage daily. Mice were euthanized after 4 weeks. (E) Analysis of liver to body weight ratio of mice treated as described in (D). Statistical significance was calculated using unpaired t test (n = 4). p value: p = 0.9158. Mean ± SD. (F) Quantification of Ki67/hematoxylin immunohistochemistry stainings (positive cells in %) conducted on liver sections from mice as described in (D). Statistical significance was calculated using unpaired t test (n = 4). p value: p = 0.9743. Mean ± SD. (G) Representative images of Ki67 (brown) and hematoxylin (blue) stainings on liver sections from mice as described in (D). Ki67/hematoxylin stainings for vehicle (left) and HRX215 (10 mg/kg, right) are shown. Scale bars represent 100 μm. (H) Gene correlation analysis between shMKK4- and HRX215-treated mice (21,563 genes). 50 genes (differentially expressed genes (DEGs): blue dots) were significantly differentiated. Red dot: downregulated MKK4. RNA sequencing data were extracted from livers of shMKK4 mice or wild-type mice treated with HRX215 (10 mg/kg). Livers were harvested 48 h after PH and analyzed (n = 3). R: correlation coefficient; p value: p < 2.2e. (I) CCl4 liver-damage model combined with PH conducted in C57BL/6 WT mice treated with HRX215 (10 mg/kg) or vehicle via oral gavage. Mice were treated twice weekly over 3 weeks. HRX215 was administered 12 and 1 h prior to PH. Mice were euthanized 48 h after PH. (J) Representative images of Sirius red stainings on liver sections from mice as described in (I). Sirius red staining without CCl4 (left) and with CCl4 (right) are shown. Scale bars represent 100 μm. (K) Quantification of Sirus red staining (positive area in %) on liver sections from mice as described in (I). Statistical significance was calculated using unpaired t test (n = 3). p value: p = 0.0009. Mean ± SD. (L) Quantification of Ki67/hematoxylin stainings (positive cells in %) conducted on liver sections from mice as described in (I). Statistical significance was calculated using the Tukey’s multiple comparisons test (n = 3). p values: p = 0.9831, p = 0.2844, p < 0.0001 (0 vs. 48 h HRX215), p < 0.0001 (vehicle vs. HRX215 48 h). Mean ± SD. (M) Representative images of the Ki67 (brown) and hematoxylin (blue) stainings on liver sections from mice as described in (I). Ki67/hematoxylin stainings for vehicle (left) and HRX215 10 mg/kg (right) are shown. Scale bars represent 100 μm. (N) Schematic outline of a chemically induced (CCl4) liver damage model conducted in C57BL/6 WT mice treated with HRX215 (at 0.4, 2, 10 mg/kg) or vehicle via oral gavage. Mice were euthanized after 48 h. (O) Quantification of TUNEL stainings (positive cells in %) on liver sections from mice as described in (N). Statistical significance was calculated using the Dunnett’s multiple comparisons test (n ranged from 9 to 10 per group). p values: p = 0.0002 (0.4 mg/kg HRX215), p < 0.0001 (2 mg/kg HRX215), p = 0.0005 (10 mg/kg HRX215). Mean + SEM. (P) Representative images of TUNEL stainings on liver sections from mice as described in (N). TUNEL staining for vehicle (left) and HRX215 10 mg/kg (right) are shown. Arrows indicate TUNEL-positive cells (brown). Scale bars indicate 100 μm. See also Figures S3 and S4.
Figure 4.
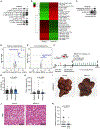
Figure 4.. Safety of long-term HRX215 treatment
(A) Immunoblot analysis of MAPK signaling cascade under HRX215 treatment in hepatectomized mice. 10 mg/kg HRX215 were administered to mice 8 and 1 h prior to partial hepatectomy (PH). Mice were euthanized 1 h after PH. Pooled lysates from four mouse livers were analyzed each. DMSO is indicated as “ ” and HRX215 as “+.” (B) Apoptosis phosphoprotein array analysis from whole-cell protein lysates extracted 48 h after PH from livers treated with either vehicle or HRX215. HRX215 or vehicle was administered 12 and 1 h prior to PH. Mice were euthanized 48 h after PH. Pooled lysates from three mouse livers were analyzed 48 h after PH. Top increased (green) and decreased (red) phosphorylated proteins are shown as heat map visualization and were calculated as log2-fold changes. Hierarchical clustering relationship between analyzed factors (left). (C) Immunoblot analysis of anti-apoptotic proteins in hepatectomized mouse livers under HRX215 treatment. 10 mg/kg HRX215 or vehicle was administered 12 and 1 h prior to PH. Mice were euthanized 48 h after PH. Pooled lysates from three mouse livers were analyzed 48 h after PH. DMSO is indicated as “ ” and HRX215 is indicated as “+.” (D and E) Nontargeted metabolomics analyses of differentially regulated features in plasma (D) and liver (E) samples between HRX215- and vehicle-treated mice. 1,337 features were found in plasma samples and 814 features in liver tissue. Volcano plots show log2-fold changes vs. Benjamini-Hochberg adjusted p values (−log10 transformed). Features with an absolute log2-fold change ≥ 1 and an adjusted p value < 0.05 are colored in blue. Structurally annotated metabolites are labeled with the corresponding name, whereas unassigned metabolites were not labeled. Gray dots represent features that were not significantly altered. Features detected in positive ionization mode are shown as triangles, whereas features detected in negative ionization mode are shown as circles. *HRX215-glucuronide was detected as multiple ESI-MS ionization adducts in plasma samples. (F) GAN-NASH HCC model conducted in C57BL/6 WT mice treated with HRX215 or vehicle (daily treatment via oral gavage over 12 weeks after 63 weeks of GAN diet). Mice were euthanized after a total of 76 weeks. (G) Quantification of tumors per liver in harvested mouse livers as described in (F). Tumors per liver at baseline were compared between vehicle and HRX215 treated mice. Statistical significance was calculated using the Dunnett’s multiple comparisons test (n = 19–20). p value: p = 0.9019. Mean + SEM. (H) Quantification of average tumor nodule volume (mm2) in harvested mouse livers as described in (F). Tumor volumes at baseline were compared with vehicle- and HRX 215-treated mice. Statistical significance was calculated using the Dunnett’s multiple comparisons test (n = 19–20). p value: p = 0.4096. Mean + SEM. (I) Bright-field images of representative livers from wild-type mice in (F) treated with vehicle (left) or HRX215 (right). (J) H&E stainings of representative livers from wild-type mice in (F) treated with vehicle (left) or HRX215 (right). Scale bars indicate 100 μm. (K) Quantification of dysplastic lesions in vehicle- or HRX215-treated livers from mice used in (F). Statistical analysis was conducted using unpaired t test (n = 12). p value: p = 0.0618. Mean + SD. See also Figures S4–S6.
Figure 5.
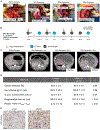
Figure 5.. HRX215 increases liver regeneration after 80% hepatectomy in pigs
(A) Photographs of situs before and after surgery (75%, 80%, and 85% resection) of porcine livers are depicted showing the remnant liver volume. LL, left liver lobe; M, middle lobe; RLL, right liver lobe. (B) 80% hepatectomy study in pigs treated with HRX215 (5 mg/kg intravenous [i.v.]) or vehicle at indicated time points (red arrow). During the indicated time course, CT scans (blue circles) and blood sampling (gray circles) were conducted. Pigs were euthanized 43 h after surgery. (C) CT scans before and after 80% PH at time point 0 and 43 h are shown. The liver (circled with dashed red line) of a carrier-treated pig is shown in direct comparison with the liver of an HRX 215-treated pig. (D) Quantification of liver volumes, extent of resection, and newly regenerated liver volume at indicated time points comparing control-treated with HRX 215-treated pigs. (E) Ki67 stainings on liver sections from control- (left) or HRX215 (right)-treated pigs. Ki67-positive cells are depicted in brown. Scale bar represents 40 μm.
Figure 6.
Figure 6.. HRX215 prevents liver failure after 85% hepatectomy
(A–F) (A) Experimental setup for porcine 85% hepatectomy experiments (B–F). Kinetics of intracranial pressure (ICP), ammonia, total bilirubin, INR, and aspartate aminotransferase (AST) over 120 h are shown (for pre- and post-liver resection treatment groups). Pigs received either carrier treatment (gray), HRX215 pre-surgery treatment (cyan), or HRX215 post-surgery treatment (red) (n = 6). (G) Survival of pigs that either received placebo (gray), HRX215 pre-surgery treatment (cyan), or HRX215 post-surgery treatment (red). Statistical significance was calculated using the log-rank (Mantel-Cox) test (n = 6). p value: p = 0.0039. (H) Representative images of a liver from a carrier- (left) or HRX215- (right) treated pig.
Figure 7.
Figure 7.. First-in-human (FIH) phase I clinical trial with HRX215
(A) Schematic outline of the trial illustrating the placebo (n = 12) and HRX215 treatment (n = 36) groups (left). Dosage scheme of the 6 active and 2 placebo cohorts included into the FIH study (right). Cohorts received 5–500 mg HRX215 as a single dose (s.d.) under fasting conditions during the first period. In period 2, single doses of 50 mg during fed conditions and multiple ascending doses of 100 and 250 mg HRX215 twice a day (b.i.d.) and 500 mg HRX215 once a day (q.d.) were administered. (B) Consolidated Standards of Reporting Trials (CONSORT) flow diagram. (C) Parameters of the s.d. pharmacokinetics (100, 250, and 500 mg) and the fed (black) vs. fasting (purple) conditions. (D) Pharmacokinetic profiles of HRX215 in the plasma after single dosages of 50–500 mg and 50 mg under fed (black) vs. fasting (purple) conditions. Mean ± SD. See also Figure S7.

Comment in

  • Kinase inhibitor rescues the liver.
    Crunkhorn S. Crunkhorn S. Nat Rev Drug Discov. 2024 May;23(5):336. doi: 10.1038/d41573-024-00055-x. Nat Rev Drug Discov. 2024. PMID: 38548888 No abstract available.

Similar articles

Cited by

References

    1. Asrani SK, Devarbhavi H, Eaton J, and Kamath PS (2019). Burden of liver diseases in the world. J. Hepatol 70, 151–171. - PubMed
    1. GBD (2020). The global, regional, and national burden of cirrhosis by cause in 195 countries and territories, 1990–2017: a systematic analysis for the Global Burden of Disease Study 2017. Lancet Gastroenterol. Hepatol 5, 245–266. - PMC - PubMed
    1. Campana L, Esser H, Huch M, and Forbes S (2021). Liver regeneration and inflammation: from fundamental science to clinical applications. Nat. Rev. Mol. Cell Biol 22, 608–624. - PubMed
    1. Wuestefeld T, Pesic M, Rudalska R, Dauch D, Longerich T, Kang TW, Yevsa T, Heinzmann F, Hoenicke L, Hohmeyer A, et al. (2013). A Direct In Vivo RNAi Screen Identifies MKK4 as a Key Regulator of Liver Regeneration. Cell 153, 389–401. - PubMed
    1. Canovas B, and Nebreda AR (2021). Diversity and versatility of p38 kinase signalling in health and disease. Nat. Rev. Mol. Cell Biol 22, 346–366. - PMC - PubMed

Publication types

LinkOut - more resources