. 2024 Mar 26;43(3):113940.
doi: 10.1016/j.celrep.2024.113940. Epub 2024 Mar 13.

Co-imaging of RelA and c-Rel reveals features of NF-κB signaling for ligand discrimination

Affiliations

Co-imaging of RelA and c-Rel reveals features of NF-κB signaling for ligand discrimination

Shah Md Toufiqur Rahman et al. Cell Rep. .

Abstract

Individual cell sensing of external cues has evolved through the temporal patterns in signaling. Since nuclear factor κB (NF-κB) signaling dynamics have been examined using a single subunit, RelA, it remains unclear whether more information might be transmitted via other subunits. Using NF-κB double-knockin reporter mice, we monitored both canonical NF-κB subunits, RelA and c-Rel, simultaneously in single macrophages by quantitative live-cell imaging. We show that signaling features of RelA and c-Rel convey more information about the stimuli than those of either subunit alone. Machine learning is used to predict the ligand identity accurately based on RelA and c-Rel signaling features without considering the co-activated factors. Ligand discrimination is achieved through selective non-redundancy of RelA and c-Rel signaling dynamics, as well as their temporal coordination. These results suggest a potential role of c-Rel in fine-tuning immune responses and highlight the need for approaches that will elucidate the mechanisms regulating NF-κB subunit specificity.

Keywords: CP: Molecular biology; NF-κB; RelA; c-Rel; endogenous knockin; fluorescent fusion reporter mice; inflammatory signaling; live microscopy; macrophages; mathematical modeling.


Conflict of interest statement

Declaration of interests The authors declare no competing interests.

Figures

Figure 1.
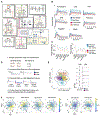
Figure 1.. Schematic workflow for simultaneous live-cell imaging and analysis of both RelA and c-Rel NF-κB subunits in primary BMDM cells following stimulation with TLR ligands and TNF-α
(A) A simplified schematic of ligand recognition by different TLRs and TNF receptors (TNFRs), initiating downstream responses where NF-κB is a primary signalencoding effector. RelA and c-Rel are the two canonical subunits of the NF-κB family that mediate TLR and TNF responses. (B) Primary BMDM cells were prepared using a standardized isolation and differentiation protocol from double-knockin endogenous NF-κB reporter mice. Both RelA and c-Rel are fluorescently labeled at their respective endogenous loci in the mice. In addition, double homozygotes are used to ensure complete labeling of the endogenous proteins. A panel of TLR ligands and a pro-inflammatory cytokine, TNF-α, were used to stimulate primary BMDMs in this study. Time lapse live-cell microscopy data were obtained and subject to quantification and analysis workflow for the characterization of signaling dynamics of the two NF-κB subunits.
Figure 2.
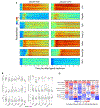
Figure 2.. Quantitative imaging of RelA and c-Rel in live macrophages captures the subunit-specific signaling features for different ligands
(A) Primary BMDM cells (n = 131 for LPS, n = 112 for Flagellin, n = 118 for CpG, n = 140 for poly(I:C),n = 96 for R848, n = 109 for Pam3CSK4, and n = 109 for TNF-α) from the young green-red double-knockin reporter mice (9 weeks of age, male) were plated in a fibronectin-coated, glass-bottom 8-well imaging slide. Cells were stained with the nuclear dye SPY650-DNA 1 h before the start of imaging and treated with optimum stimulatory concentrations of six TLR ligands along with TNF-α at t = 0. Three fluorescent channels were acquired at 7 min intervals for more than 12 h. The images were processed using custom-written MATLAB scripts. The individual rows in the heatmap show single-cell trajectories of the nuclear-to-total mean intensity ratio of RelA (left) and c-Rel (right) foreach ligand indicated on the right. The data are representative of three individual biological replicates (using independent BMDM batches from different mice on different days). (B) Comparison of six signaling features between RelA and c-Rel signal for the data in (A). *p < 0.05, **p < 0.01, and ***p < 0.001 from Mann-Whitney U-test. (C) The correlation of signaling features between RelA and c-Rel depends on the activating ligand. The heatmap displays the Pearson correlation coefficients between RelA and c-Rel signaling features extracted from time series data for each ligand. Each column is from the indicated ligand. The individual correlation coefficient values are shown within each cell, and the asterisk (*) denotes the statistical significance, where *p < 0.05, **p < 0.001, and ***p < 0.0001. Data are representative of three independent biological replicates (using independent BMDM batches from different mice on different days).
Figure 3.
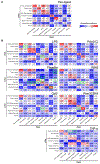
Figure 3.. Cross-correlations of signaling features reveal the sources of RelA and c-Rel divergence in encoding ligand specificity
(A) The pan-ligand cross-correlation matrix was generated by calculating the Pearson correlation coefficients between all possible pairs of signaling features between RelA and c-Rel. The entire single-cell time series imaging data were used from all ligands. The individual correlation coefficient values are shown within each cell, and the asterisk (*) denotes the statistical significance, where *p < 0.05, **p < 0.001, and ***p < 0.0001. (B) The ligand-specific cross-correlation matrix was similarly generated except by using imaging data for the indicated ligand only. The diagonal of each matrix corresponds to the column for the indicated ligand in Figure 2C. The green boxes around the cells in the matrix represent the correlations that are different (at least 0.45 absolute difference) from the pan-ligand correlation matrix. The data are representative of three individual biological replicates (using independent BMDM batches from different mice on different days).
Figure 4.
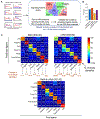
Figure 4.. The signaling features of both NF-κB subunits can distinguish immune threats better than those of either subunit alone
(A) Computational workflow of supervised machine learning (ML)with K-nearest neighbor (KNN) models that learn features from RelA alone or from both RelA and c-Rel and predict ligand identity. Models were created by randomly selecting 70% of data for training; the remaining 30% of data were used for testing with a 10-fold cross-validation. (B) The average F1 scores of ligand predictions using either the RelA signaling features only or both RelA and c-Rel signaling features, produced by the KNN or the linear discriminant analysis (LDA) methods. The F1 scores are shown here with mean ± standard error from a 10-fold cross-validation. (C) Confusion matrices show the performance of KNN ML models (K = 7, Canberra distance) using the signaling features of RelA (top left), c-Rel (top right), or both RelA and c-Rel (bottom). Within each cell of the matrix, the colors within the subrectangles above and below the numerical value (mean of the 10-fold cross-validation in B) represent the upper and lower bounds (95% confidence interval). The sum of diagonals (percentage correctly identified) for each matrix is shown in parentheses. The statistically significant changes between components of an upper matrix and a lower matrix are underlined (p < 0.05 in Mann-Whitney U test). The results are representative of three individual biological replicates (using independent BMDM batches from different mice on different days).
Figure 5.
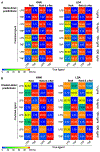
Figure 5.. Signaling features of c-Rel help maintain ligand discrimination at high doses
Primary BMDM cells from a young male green-red double-knockin reporter mouse (11 week of age) were imaged for their responses to LPS or TNF-α at the indicated concentrations. The dynamic features of RelA and c-Rel were quantified and analyzed (numbers of single cells analyzed: n = 154, 113, 127, and 149 for 1, 10, 100, and 500 ng/mL LPS; n = 267, 265, 212, and 266 for 1, 10, 100, and 500 ng/mL TNF-α). (A) For each dose, models were created by randomly selecting 70% of data for training; the remaining 30% of data were used for testing with a 10-fold cross-validation. The 2 × 2 confusion matrices show the performance of ML models, KNN with K = 7, Canberra distance (left), and LDA (right), using the signaling features of RelA, or both RelA and c-Rel, for a given dose. Within each cell of the matrix, the colors within the subrectangles above and below the numerical value (mean of the 10-fold cross-validation) represent the upper and lower bounds (95% confidence interval). The green boxes mark the ML models with less accurate predictions using RelA features only that undergo statistically significant improvements in predictions by using features of both subunits (p < 0.05 in Mann-Whitney U test). (B) ML models were trained with the signaling features extracted from data for the indicated concentration shown on the right. Each dose-specific model was tested against the remaining data from all the other doses. The confusion matrices show the performance of ML models, KNN with K = 7, Canberra distance (left), and LDA (right), using the signaling features of RelA or both RelA and c-Rel. The colormap was chosen to aid the visualization of changes in the 80%–100% range. The results are from one of two biological replicates (using independent BMDM batches from different mice on different days).
Figure 6.
Figure 6.. Mathematical modeling of the TLR-NF-κB signaling network recapitulates stimulus-responsive RelA and c-Rel dynamics
(A) The topology of the model that combines seven receptor-proximal signaling modules with a core NF-κB module that includes both RelA-and c-Rel-containing NF-κB dimers and both IκBα and IκBε. See STAR Methods for details. In the core module, A: RelA, C: c-Rel, 50: p50. (B) Simulated nuclear abundances (relative to total) of RelA- (blue) and c-Rel- (red) containing NF-κB dimers are shown as bold curves. Lighter color curves indicate five representative single-cell trajectories from imaging data of Figure 2. (C) Plots of peak amplitude (maximum value within first 4 h) and total activity (integral over complete time series) extracted from the experimental NF-κB trajectories and from model simulations. (D) Workflow for parameter set variation to identify determinants of RelA and c-Rel dynamic trajectories. (E) PCA (principal-component analysis) of 100,000 parameter sets defined by their differences in RelA and c-Rel signaling codons in response to TNF-α and LPS stimulation (left). Parameter sets colored by cluster identity and WT (wild-type) parameter set marked. Representative parameter set (smallest distance to cluster mean) simulations from each cluster (right). (F) PCA colored by values for the indicated interaction parameters.
Figure 7.
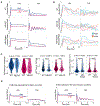
Figure 7.. RelA and c-Rel dynamics from IκB signaling mutants support model predictions
(A) Mathematical model predictions of RelA and c-Rel response dynamics to LPS and TNF-α stimulation in IκBε KO (middle) and IκBα mutant (bottom) cells. (B) Representative experimental trajectories of RelA and c-Rel in response to LPS and TNF-α stimulation in WT, IκBε KO, and IκBα mutant. (C) Violin plots of peak amplitude (left) in response to TNF-α of experimental RelA and c-Rel trajectories in IκBε KO, time to first peak (middle) in response to LPS, and oscillatory power (right) in response to TNF-α (average power within the biologically relevant 0.33–1 h−1 frequency range from power spectral density estimate of signal) of RelA and c-Rel experimental trajectories in IκBα mutant. White boxes denote median values. (D) Mathematical model simulations of RelA and c-Rel trajectories in response to LPS and TNF-α stimulation when IκBε affinity to RelA is set equivalent to that of c-Rel (left) and IKK affinity to IκBε is set equivalent to that of IκBα (right). The experimental results for RelA dynamics are consistent with three replicates in response to multiple ligand stimulations.
Figure 8.
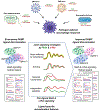
Figure 8.. Ligand discrimination by joint signaling of two NF-κB subunits
Some concepts and results of the study are illustrated. PAMPs are recognized by different TLRs as activating ligands, initiating complex kinetic responses of downstream transcription factors. Live-cell imaging of co-signaling dynamics showed unexpectedly non-redundant behaviors of the two subunits, RelA and c-Rel, of NF-κB that underlie an enhanced PAMP ligand discrimination in macrophages.

Similar articles

Cited by

References

    1. Levchenko A, and Nemenman I (2014). Cellular noise and information transmission. Curr. Opin. Biotechnol 28, 156–164. 10.1016/j.copbio.2014.05.002. - DOI - PMC - PubMed
    1. Cheong R, Rhee A, Wang CJ, Nemenman I, and Levchenko A (2011). Information transduction capacity of noisy biochemical signaling networks. Science 334, 354–358. 10.1126/science.1204553. - DOI - PMC - PubMed
    1. Rand U, Rinas M, Schwerk J, Nöhren G, Linnes M, Kröger A, Flossdorf M, Kály-Kullai K, Hauser H, Höfer T, and Köster M (2012). Multilayered stochasticity and paracrine signal propagation shape the type-I interferon response. Mol. Syst. Biol 8, 584. 10.1038/msb.2012.17. - DOI - PMC - PubMed
    1. Hannanta-Anan P, and Chow BY (2016). Optogenetic Control of Calcium Oscillation Waveform Defines NFAT as an Integrator of Calcium Load. Cell Syst. 2, 283–288. 10.1016/j.cels.2016.03.010. - DOI - PMC - PubMed
    1. Selimkhanov J, Taylor B, Yao J, Pilko A, Albeck J, Hoffmann A, Tsimring L, and Wollman R (2014). Systems biology. Accurate information transmission through dynamic biochemical signaling networks. Science 346, 1370–1373. 10.1126/science.1254933. - DOI - PMC - PubMed

LinkOut - more resources