Influence of Cigarette Aerosol in Alpha-Synuclein Oligomerization and Cell Viability in SH-SY5Y: Implications for Parkinson's Disease
- PMID: 38483468
- PMCID: PMC10995954
- DOI: 10.1021/acschemneuro.3c00771
Influence of Cigarette Aerosol in Alpha-Synuclein Oligomerization and Cell Viability in SH-SY5Y: Implications for Parkinson's Disease
Abstract
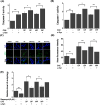
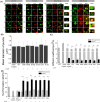
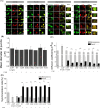
Although cigarette aerosol exposure is associated with various adverse health issues, its impact on Parkinson's disease (PD) remains elusive. Here, we investigated the effect of cigarette aerosol extract (CAE) on SH-SY5Y cells for the first time, both with and without α-synuclein (α-Syn) overexpression. We found that α-Syn aggravates CAE-induced cell death, oxidative stress, and mitochondrial dysfunction. Fluorescence cross-correlation spectroscopy (FCCS) revealed a dual distribution of α-Syn within the cells, with homogeneous regions indicative of monomeric α-Syn and punctated regions, suggesting the formation of oligomers. Moreover, we observed colocalization of α-Syn oligomers with lysosomes along with a reduction in autophagy activity. These findings suggest that α-Syn overexpression exacerbates CAE-induced intracellular cytotoxicity, mitochondrial dysfunction, and autophagy dysregulation, leading to elevated cell mortality. Our findings provide new insights into the pathogenic mechanisms linking exposure to cigarette aerosols with neurodegenerative diseases.
Keywords: Parkinson’s disease; autophagy activity; cigarette aerosol; fluorescence correlation spectroscopy; particulate matter; α-synuclein oligomerization.
Conflict of interest statement
The authors declare no competing financial interest.
Figures


Similar articles
-
Specific pesticide-dependent increases in α-synuclein levels in human neuroblastoma (SH-SY5Y) and melanoma (SK-MEL-2) cell lines.Toxicol Sci. 2013 Jun;133(2):289-97. doi: 10.1093/toxsci/kft076. Epub 2013 Mar 27. Toxicol Sci. 2013. PMID: 23535362
-
Suppression of MAPK attenuates neuronal cell death induced by activated glia-conditioned medium in alpha-synuclein overexpressing SH-SY5Y cells.J Neuroinflammation. 2015 Oct 26;12:193. doi: 10.1186/s12974-015-0412-7. J Neuroinflammation. 2015. PMID: 26502720 Free PMC article.
-
From the Cover: Arsenic Induces Accumulation of α-Synuclein: Implications for Synucleinopathies and Neurodegeneration.Toxicol Sci. 2016 Oct;153(2):271-81. doi: 10.1093/toxsci/kfw117. Epub 2016 Jul 13. Toxicol Sci. 2016. PMID: 27413109 Free PMC article.
-
The Role of α-Synuclein Oligomers in Parkinson's Disease.Int J Mol Sci. 2020 Nov 17;21(22):8645. doi: 10.3390/ijms21228645. Int J Mol Sci. 2020. PMID: 33212758 Free PMC article. Review.
-
Update on the association between alpha-synuclein and tau with mitochondrial dysfunction: Implications for Parkinson's disease.Eur J Neurosci. 2021 May;53(9):2946-2959. doi: 10.1111/ejn.14699. Epub 2020 Feb 25. Eur J Neurosci. 2021. PMID: 32031280 Review.
References
-
- Ljubimova J. Y.; Braubach O.; Patil R.; Chiechi A.; Tang J.; Galstyan A.; Shatalova E. S.; Kleinman M. T.; Black K. L.; Holler E. Coarse particulate matter (PM(2.5–10)) in Los Angeles Basin air induces expression of inflammation and cancer biomarkers in rat brains. Sci. Rep. 2018, 8 (1), 5708.10.1038/s41598-018-23885-3. - DOI - PMC - PubMed
-
- Calderon-Garciduenas L.; Reed W.; Maronpot R. R.; Henriquez-Roldan C.; Delgado-Chavez R.; Calderon-Garciduenas A.; Dragustinovis I.; Franco-Lira M.; Aragon-Flores M.; Solt A. C.; et al. Brain inflammation and Alzheimer’s-like pathology in individuals exposed to severe air pollution. Toxicol Pathol 2004, 32 (6), 650–658. 10.1080/01926230490520232. - DOI - PubMed
Publication types
MeSH terms
Substances
LinkOut - more resources
Full Text Sources
Medical
Miscellaneous

