

The spread in time and space of COVID-19 pandemic waves: the Italian experience from mortality data analyses
- PMID: 38481837
- PMCID: PMC10932994
- DOI: 10.3389/fpubh.2024.1324033
The spread in time and space of COVID-19 pandemic waves: the Italian experience from mortality data analyses
Abstract
Introduction: Italy was the first European country affected by COVID-19. Thanks to governmental containment measures (9 March 2020), the spread of COVID-19 was limited. However, in this context, accurate data assessment is crucial and mortality is a more reliable indicator of the virus spread compared to the count of positive cases. This study aimed to retrospectively evaluate the impact of the pandemic in different areas of Italy using the time series analysis of official deaths and excess COVID-19 deaths.
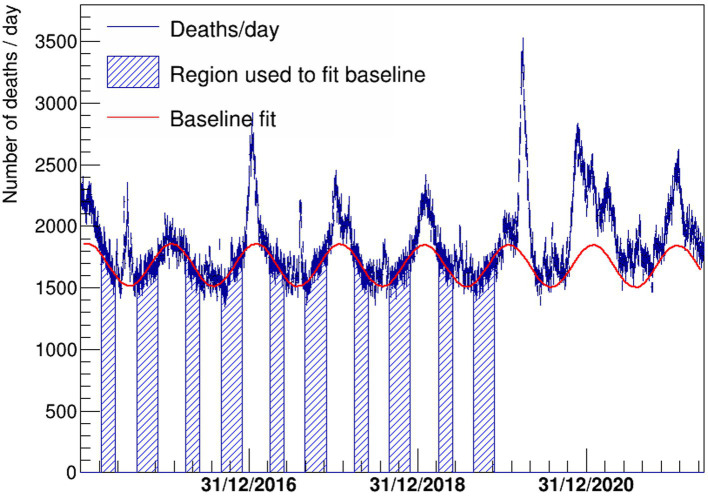
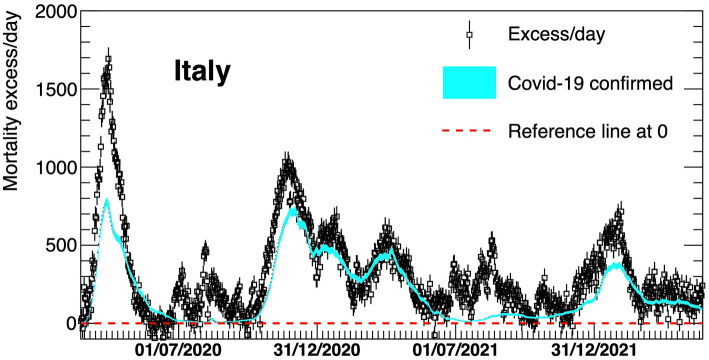
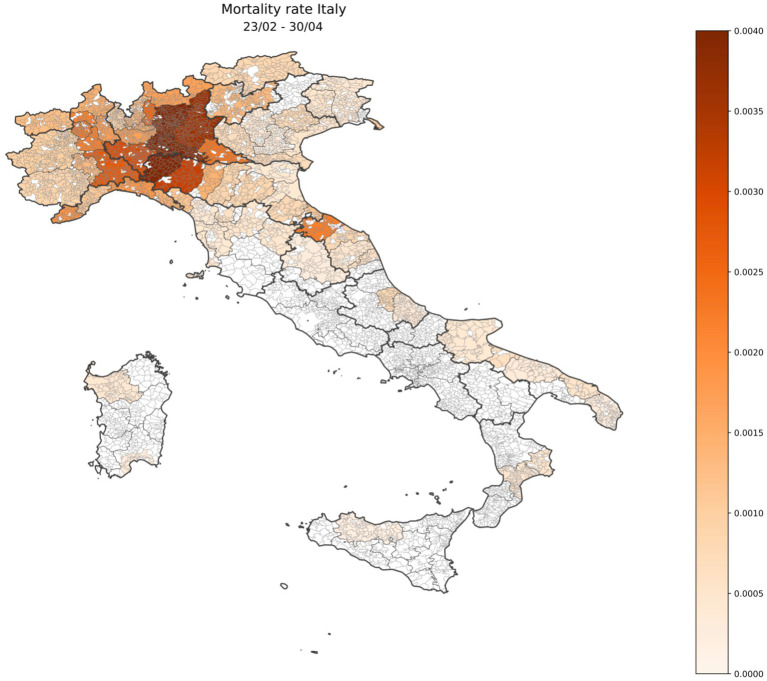
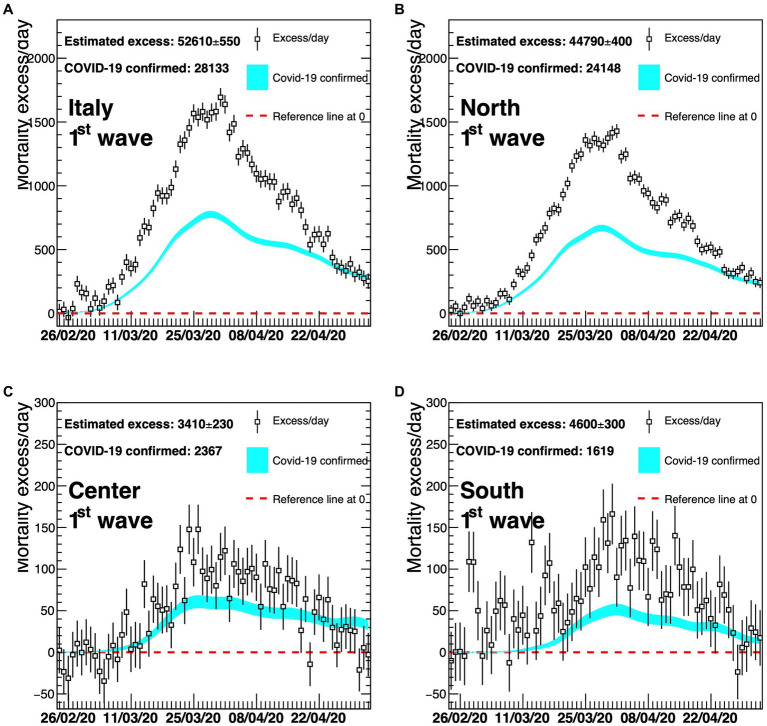
Methods: Mortality data (23 February-30 April 2022) by Istituto Nazionale di Statistica (ISTAT) were analyzed, including four waves of COVID-19. Previous mortality data (January 2015-November 2019) were used to estimate a Poisson regression model of the pre-pandemic mortality pattern and derive the excess COVID-19 deaths as the difference between the actual deaths number and the extrapolation of the previous mortality pattern to the pandemic period, separately for Northern, Central, and Southern Italy, to compare the impact of mortality across time periods and geographical areas.
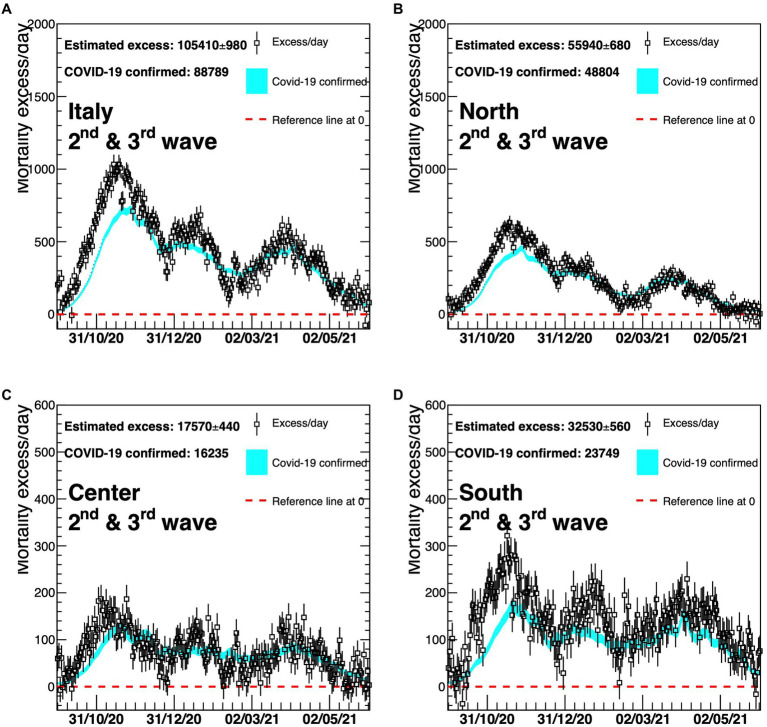
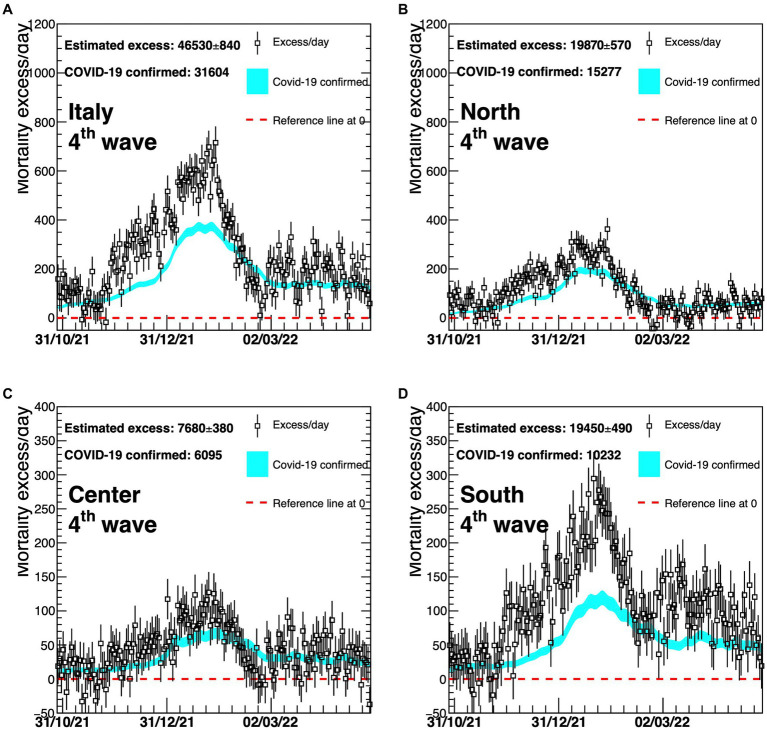
Results: Estimated excess compared with official COVID-19 mortality shows that, during the first wave, there was an underestimation of deaths. COVID-19 mortality rate almost doubled the official rate in the North (1.60‰ vs. 0.86‰) and nearly tripled it in the South (0.22‰ vs. 0.08‰). In late 2020-early 2021, official and estimated mortality curves are closer, displaying just a small gap at the start of the second wave. During the fourth wave (end of 2021-early 2022), Northern and Central Italy show reasonable agreement; the South presents a large relative underestimation of deaths (+90% increase), with a large increase in its excess deaths national quota, 9% in the first wave to 42% in the fourth.
Discussion: The results provide a measure of the COVID-19 excess deaths and an unbiased estimate of Italian mortality rates. In the first wave, the gap between official COVID-19 and excess mortality was particularly high and lockdown measures may have reduced the spread of the infection. In the fourth wave, the gap for the South increases again, probably because the healthcare system may not have coped with the prolonged pressure of the pandemic, or for a decreased compliance with the official paper-based mortality surveillance system that could be overcome in the future by digitalizing the process.
Keywords: COVID-19; EuroMOMO; Italy; containment measures; mortality; pandemic.
Copyright © 2024 del Re, Palla, Meridiani, Soffi, Loiudice, Antinozzi and Cattaruzza.
Conflict of interest statement
The authors declare that the research was conducted in the absence of any commercial or financial relationships that could be construed as a potential conflict of interest.
Figures
Similar articles
-
First Wave of COVID-19 Pandemic in Italy: Data and Evidence.Adv Exp Med Biol. 2021;1353:91-113. doi: 10.1007/978-3-030-85113-2_6. Adv Exp Med Biol. 2021. PMID: 35137370
-
Excess Mortality in Italy During the COVID-19 Pandemic: Assessing the Differences Between the First and the Second Wave, Year 2020.Front Public Health. 2021 Jul 16;9:669209. doi: 10.3389/fpubh.2021.669209. eCollection 2021. Front Public Health. 2021. PMID: 34336767 Free PMC article.
-
A population-based cohort approach to assess excess mortality due to the spread of COVID-19 in Italy, January-May 2020.Ann Ist Super Sanita. 2022 Jan-Mar;58(1):25-33. doi: 10.4415/ANN_22_01_04. Ann Ist Super Sanita. 2022. PMID: 35324471
-
COVID-19: update of the Italian situation.J Neurovirol. 2020 Dec;26(6):834-837. doi: 10.1007/s13365-020-00900-w. Epub 2020 Sep 8. J Neurovirol. 2020. PMID: 32901393 Free PMC article. Review.
-
Systematic Review of Excess Mortality in India during the Covid-19 Pandemic with Differentiation between Model-Based and Data-Based Mortality Estimates.Indian J Community Med. 2022 Oct-Dec;47(4):491-494. doi: 10.4103/ijcm.ijcm_11_22. Epub 2022 Dec 14. Indian J Community Med. 2022. PMID: 36742946 Free PMC article. Review.
Cited by
-
Predictive Value and Diagnostic Potential of IL-10, IL-17A, IL1-β, IL-6, CXCL, and MCP for Severe COVID-19 and COVID-19 Mortality.Biomedicines. 2024 Jul 10;12(7):1532. doi: 10.3390/biomedicines12071532. Biomedicines. 2024. PMID: 39062105 Free PMC article.
-
Power spectral density and similarity analysis of COVID-19 mortality waves across countries.Heliyon. 2024 Jul 31;10(15):e35546. doi: 10.1016/j.heliyon.2024.e35546. eCollection 2024 Aug 15. Heliyon. 2024. PMID: 39170280 Free PMC article.
References
-
- World Health Organization-a . Timeline of WHO’s response to COVID-19 (2022).
-
- World Health Organization-b . WHO director-General’s opening remarks at the media briefing (2023). Available at: https://www.who.int/news-room/speeches/item/who-director-general-s-openi...
-
- World Health Organization-c (2020). Available at: https://data.who.int/dashboards/covid19/deaths?n=c.
-
- Presidenza del Consiglio dei Ministri . Decreto Presidenza Consiglio Dei Ministri del 9 marzo 2020. Serie Generale n° 62 Italy: Gazzetta Ufficiale; (2020).
Publication types
MeSH terms
Grants and funding
LinkOut - more resources
Full Text Sources
Medical
Miscellaneous