. 2024 Jul 15;83(8):1048-1059.
doi: 10.1136/ard-2023-224945.

Primary osteoarthritis chondrocyte map of chromatin conformation reveals novel candidate effector genes

Affiliations

Primary osteoarthritis chondrocyte map of chromatin conformation reveals novel candidate effector genes

Norbert Bittner et al. Ann Rheum Dis. .

Abstract

Objectives: Osteoarthritis is a complex disease with a huge public health burden. Genome-wide association studies (GWAS) have identified hundreds of osteoarthritis-associated sequence variants, but the effector genes underpinning these signals remain largely elusive. Understanding chromosome organisation in three-dimensional (3D) space is essential for identifying long-range contacts between distant genomic features (e.g., between genes and regulatory elements), in a tissue-specific manner. Here, we generate the first whole genome chromosome conformation analysis (Hi-C) map of primary osteoarthritis chondrocytes and identify novel candidate effector genes for the disease.

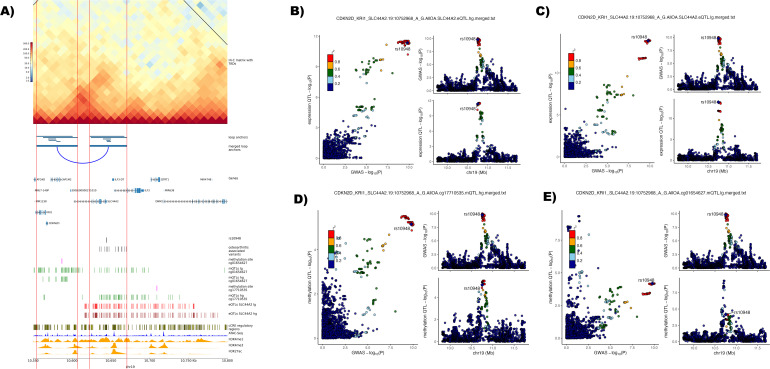
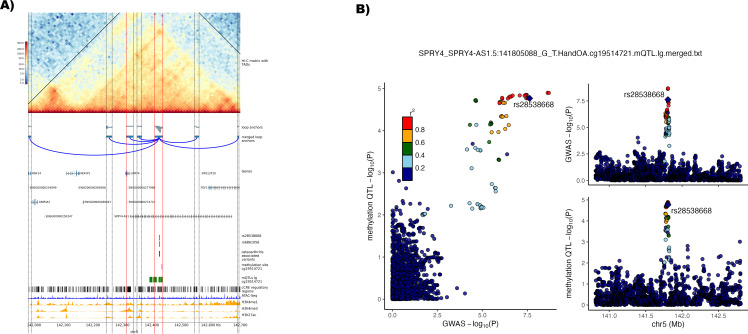
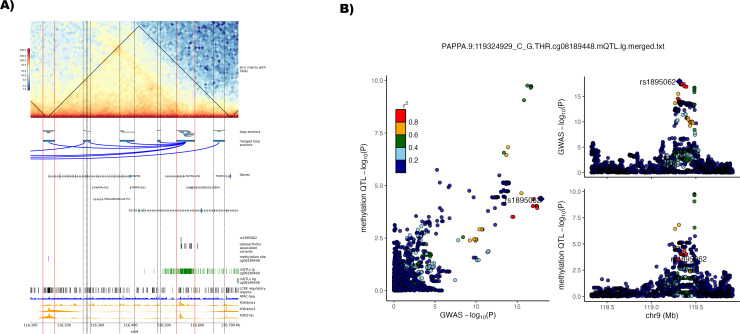
Methods: Primary chondrocytes collected from 8 patients with knee osteoarthritis underwent Hi-C analysis to link chromosomal structure to genomic sequence. The identified loops were then combined with osteoarthritis GWAS results and epigenomic data from primary knee osteoarthritis chondrocytes to identify variants involved in gene regulation via enhancer-promoter interactions.

Results: We identified 345 genetic variants residing within chromatin loop anchors that are associated with 77 osteoarthritis GWAS signals. Ten of these variants reside directly in enhancer regions of 10 newly described active enhancer-promoter loops, identified with multiomics analysis of publicly available chromatin immunoprecipitation sequencing (ChIP-seq) and assay for transposase-accessible chromatin using sequencing (ATAC-seq) data from primary knee chondrocyte cells, pointing to two new candidate effector genes SPRY4 and PAPPA (pregnancy-associated plasma protein A) as well as further support for the gene SLC44A2 known to be involved in osteoarthritis. For example, PAPPA is directly associated with the turnover of insulin-like growth factor 1 (IGF-1) proteins, and IGF-1 is an important factor in the repair of damaged chondrocytes.

Conclusions: We have constructed the first Hi-C map of primary human chondrocytes and have made it available as a resource for the scientific community. By integrating 3D genomics with large-scale genetic association and epigenetic data, we identify novel candidate effector genes for osteoarthritis, which enhance our understanding of disease and can serve as putative high-value novel drug targets.

Keywords: chondrocytes; osteoarthritis; osteoarthritis, knee; pharmacogenetics.


Conflict of interest statement

Competing interests: None declared.

Figures

Figure 1
Figure 1
Workflow for the analysis of putative effector genes Hi-C data from primary tissue chondrocytes with a 5 kb and 10 kb bin size were Knight-Ruiz (KR) normalised, merged and analysed separately with each of the four applied algorithms. Loop anchors were overlapped with CTCF binding sites as a quality control measure (table 1). Osteoarthritis genome-wide association studies (GWAS) single-nucleotide polymorphisms (SNPs) were overlapped with loop anchors and enhancer regions from ENCODE SCREEN (V.3). Activity screening for SNP-containing enhancers was performed with overlap of public ATAC-seq and ChIP-seq data. Active promoters on loop anchors contacting active SNP-enhancer regions were identified with the same epigenetic datasets. Overlapping enhancer-promoter loops were merged and putative effector genes were annotated. Figure was created with BioRender.com.
Figure 2
Figure 2
Hi-C contact matrix of primary chondrocyte tissue Hi-C contact matrix plot of all analysed chromosomes of primary chondrocyte tissue with a bin size of 500 kb. For visualisation, contact values were corrected with the Knight-Ruiz method and transformed to a log1p scale.
Figure 3
Figure 3
Identification of enhancer-promoter loops linked with osteoarthritis-associated lead variant rs10405617 on chromosome 19. (A) Plot of the identified enhancer-promoter loop associated with lead variant rs10405617 with the credible set variant rs10948 residing in an active cis-regulatory elements (cCRE) enhancer region. Horizontal red lines show the region of loop anchors with active promoter and enhancer regions throughout the plotting area. Hi-C matrix with topologically associated domains (TADs) show the log1p-transformed Hi-C contact matrix map showing the number of identified contacts between bins with a 10 kb bin size. Black lines show merged TADs calculated with a 50 kb bin size. Loop anchors show all identified loop anchors with the different loop calling algorithms used in this study as green bars at their respective location on the plotted chromosome region. The merged loop anchors show the region used for the final analysis after merging the several locally identified loop anchors. Putative identified loops are connected with a blue arc. Genes are the position of transcribed regions as identified in ENSEMBL genes V.110. Osteoarthritis-associated variants are variants from the 95% credible set of a study by Boer et al, with a posterior probability of >3% identified to reside in loop anchors called in this study. In addition, the position of the credible set variant residing in an enhancer region, rs10948, is shown in a separate track. Associated methylation QTL (methQTL) methylation sites and the respective positions of methQTLs in low-grade (lg) and high-grade (hg) degraded cartilage were identified by Kreitmaier et al. Positions of expression QTLs (eQTL) associated with the gene SLC44A2 were identified in a study by Steinberg et al. cCRE regulatory regions shows all cCRE as identified in V.3 from the ENCODE registry. ATAC-seq (n=8) and histone mark signal tracks for H3K4me1, H3K4me3 and H3K27ac (n=3) were averaged and merged into one track from the replicates of the public data repositories, genomic co-ordinates (GRCh38) are given below the plot. (B, C) Regional association plot with the enhancer variant rs10948 highlighted for the lead phenotype (osteoarthritis at any joint site) from Boer et al (top right) and the eQTL for SLC44A2 in (B) hg and (C) lg cartilage (bottom right). Comparison of p values between the genome-wide association studies (GWAS) and expression QTL are depicted on the left. Variants are annotated to the enhancer variant which is highlighted in purple. Linkage disequilibrium with the lead variant is depicted according to the colours in the legend. (D, E) Regional association plot with the enhancer variant rs10948 highlighted for the lead phenotype (osteoarthritis at any joint site) from Boer et al (top right) and the methQTL for (D) cg01654627 in hg and (E) cg01654627 in lg (bottom right). Comparison of p values between the GWAS and methQTL are depicted on the left. Variants are annotated to the enhancer variant which is highlighted in purple. Linkage disequilibrium with the lead variant is depicted according to the colours in the legend. QTL, quantitative trait loci.
Figure 4
Figure 4
Identification of enhancer-promoter loops linked with osteoarthritis-associated lead variant rs10062749 on chromosome 5. (A) Plot of the identified enhancer-promoter loop associated with lead variant rs100062749 with the credible set variants rs28538668 and rs6861056 residing in an active cis-regulatory elements (cCRE) enhancer region. Horizontal red lines show the region of loop anchors with active promoter and enhancer regions throughout the plotting area. Horizontal dotted black lines show other identified loop anchor regions without any active enhancer-promoter region. Hi-C matrix with topologically associated domains (TADs) show the log1p-transformed Hi-C contact matrix map showing the number of identified contacts between bins with a 10 kb bin size. Black lines show merged TADs calculated with a 50 kb bin size. Loop anchors show all identified loop anchors with the different loop calling algorithms used in this study as green bars at their respective location on the plotted chromosome region. The merged loop anchors show the region used for the final analysis after merging the several locally identified loop anchors. Putative identified loops are connected with a blue arc. Genes are the position of transcribed regions as identified in ENSEMBL genes V.110. Osteoarthritis-associated variants are variants from the 95% credible set of a study by Boer et al, with a posterior probability of >3% identified to reside in loop anchors called in this study. In addition, the position of the credible set variants residing in an enhancer region rs28538668 and rs6861056 are shown in a separate track. Associated methylation QTL (methQTL) methylation sites and the respective positions of methQTLs in low-grade (lg) degraded cartilage were identified by Kreitmaier et al. cCRE regulatory regions shows all cCRE as identified in V.3 from the ENCODE registry. ATAC-seq (n=8) and histone mark signal tracks for H3K4me1, H3K4me3 and H3K27ac (n=3) were averaged and merged into one track from the replicates of the public data repositories, genomic co-ordinates (GRCh38) are given below the plot. (B) Regional association plot with the enhancer variant rs28538668 highlighted for the lead phenotype (hand osteoarthritis) from Boer et al (top right) and the methQTL for cg19514721 in lg (bottom right). Comparison of p values between the genome-wide association studies (GWAS) and methQTL are depicted on the left. Variants are annotated to the enhancer variant which is highlighted in purple. Linkage disequilibrium with the lead variant is depicted according to the colours in the legend. QTL, quantitative trait loci.
Figure 5
Figure 5
Identification of enhancer-promoter loops linked with osteoarthritis associated lead variant rs1321917 on chromosome 9. (A) Plot of the identified enhancer-promoter loop associated with lead variant rs1321917 with the credible set variant rs1895062 residing in an active cis regulatory elements (cCRE) enhancer region. Horizontal red lines show the region of loop anchors with active promoter and enhancer regions throughout the plotting area. Horizontal dotted black lines show other identified loop anchor regions without any active enhancer/promoter region. Hi-C matrix with topologically associated domains (TADs) show the log1p-transformed Hi-C contact matrix map showing the number of identified contacts between bins with a 10 kb bin size. Black lines show merged TADs calculated with a 50 kb bin size. Loop anchors show all identified loop anchors with the different loop calling algorithms used in this study as green bars at their respective location on the plotted chromosome region. The merged loop anchors show the region used for the final analysis after merging the several locally identified loop anchors. Putative identified loops are connected with a blue arc. Genes are the position of transcribed regions as identified in ENSEMBL genes V.110. Osteoarthritis-associated variants are variants from the 95% credible set of a study by Boer et al, with a posterior probability of >3% identified to reside in loop anchors called in this study. In addition, the position of the credible set variant residing in an enhancer region, rs1895062, is shown in a separate track. Associated methylation QTL (mQTL) methylation sites and the respective positions of mQTLs in low-grade (lg) and high-grade (hg) degraded cartilage were identified by Kreitmaier et al. cCRE regulatory regions shows all cCRE as identified in V.3 from the ENCODE registry. ATAC-seq (n=8) and histone mark signal tracks for H3K4me1, H3K4me3 and H3K27ac (n=3) were averaged and merged into one track from the replicates of the public data repositories, genomic co-ordinates (GRCh38) are given below the plot. (B) Regional association plot with the enhancer variant rs1895062 highlighted for the lead phenotype (total hip replacement) from Boer et al (top right) and the mQTL for cg08189448 in lg (bottom right). Comparison of p values between the GWAS and mQTL are depicted on the left. Variants are annotated to the enhancer variant which is highlighted in purple. Linkage disequilibrium with the lead variant is depicted according to the colours in the legend. QTL, quantitative trait loci.

Similar articles

Cited by

References

    1. Vos T, Flaxman AD, Naghavi M, et al. . Years lived with disability (Ylds) for 1160 sequelae of 289 diseases and injuries 1990-2010: a systematic analysis for the global burden of disease study 2010. Lancet 2012;380:2163–96. 10.1016/S0140-6736(12)61729-2 - DOI - PMC - PubMed
    1. Musich S, Wang SS, Ruiz J, et al. . The impact of mobility limitations on health outcomes among older adults. Geriatric Nursing 2018;39:162–9. 10.1016/j.gerinurse.2017.08.002 - DOI - PubMed
    1. Boer CG, Hatzikotoulas K, Southam L, et al. . Deciphering osteoarthritis genetics across 826,690 individuals from 9 populations. Cell 2021;184:4784–818. 10.1016/j.cell.2021.07.038 - DOI - PMC - PubMed
    1. Cano-Gamez E, Trynka G. From GWAS to function: using functional genomics to identify the mechanisms underlying complex diseases. Front Genet 2020;11:424. 10.3389/fgene.2020.00424 - DOI - PMC - PubMed
    1. Panigrahi A, O’Malley BW. Mechanisms of enhancer action: the known and the unknown. Genome Biol 2021;22:108. 10.1186/s13059-021-02322-1 - DOI - PMC - PubMed