. 2024 Mar 11;25(1):67.
doi: 10.1186/s13059-024-03209-7.

Liquid-liquid phase separation of H3K27me3 reader BP1 regulates transcriptional repression

Affiliations

Liquid-liquid phase separation of H3K27me3 reader BP1 regulates transcriptional repression

Guangfei Tang et al. Genome Biol. .

Abstract

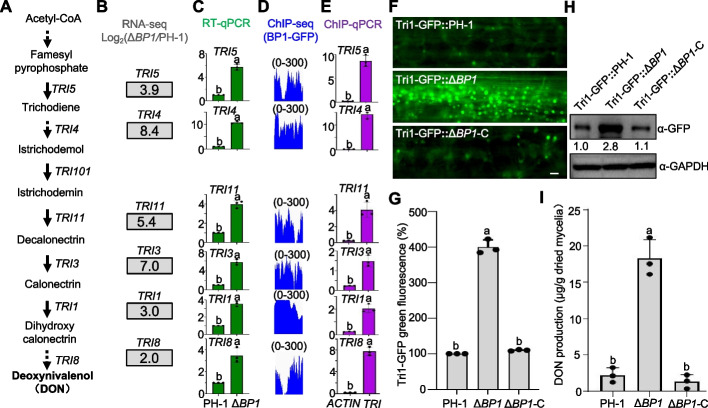
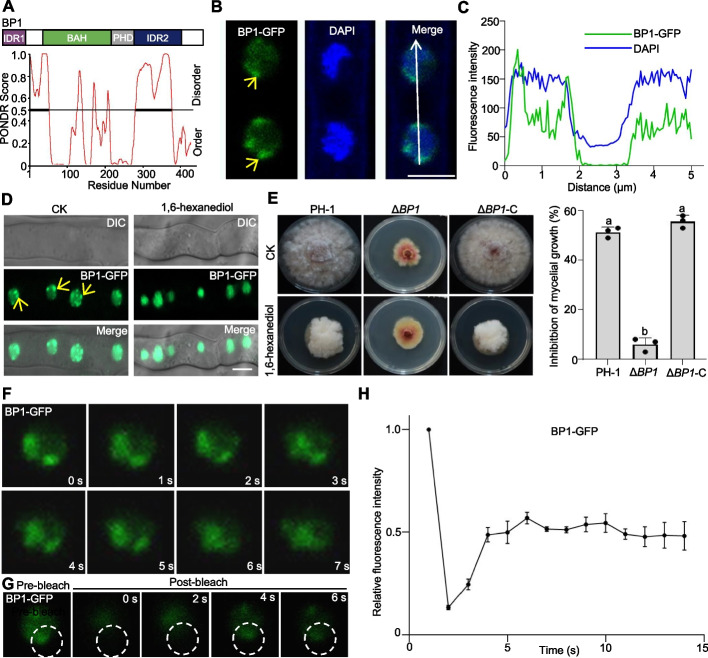
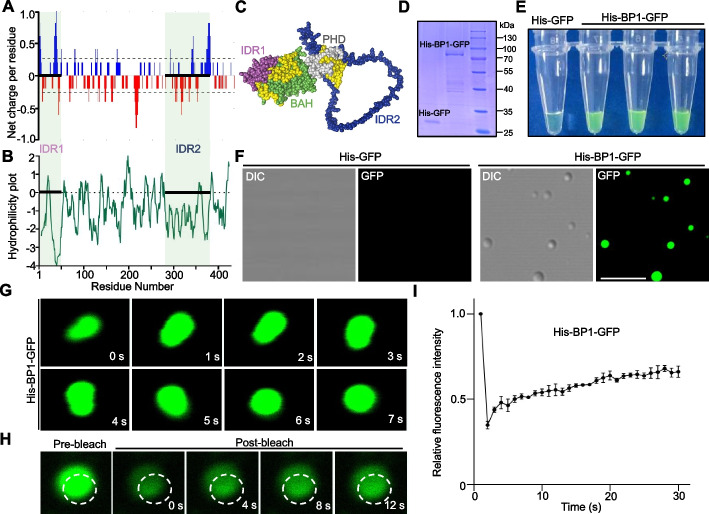
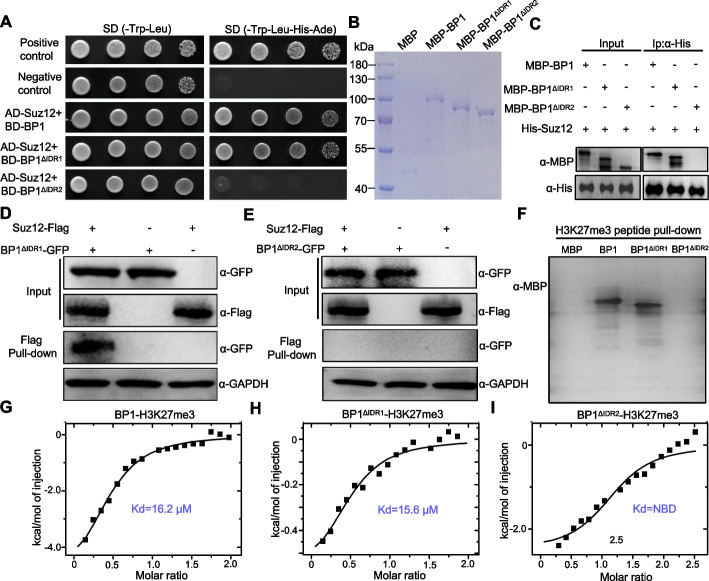
Background: Bromo-adjacent homology-plant homeodomain domain containing protein 1 (BP1) is a reader of histone post-translational modifications in fungi. BP1 recognizes trimethylation of lysine 27 in histone H3 (H3K27me3), an epigenetic hallmark of gene silencing. However, whether and how BP1 participates in transcriptional repression remains poorly understood.

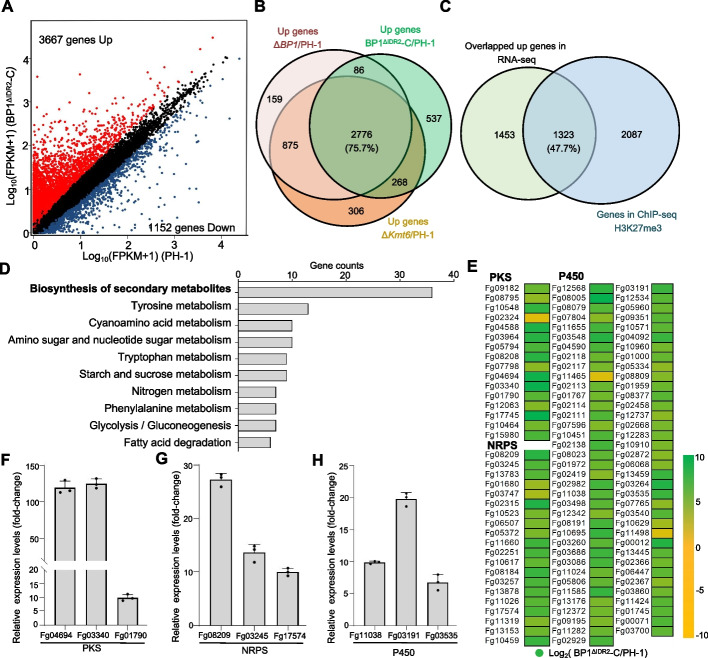
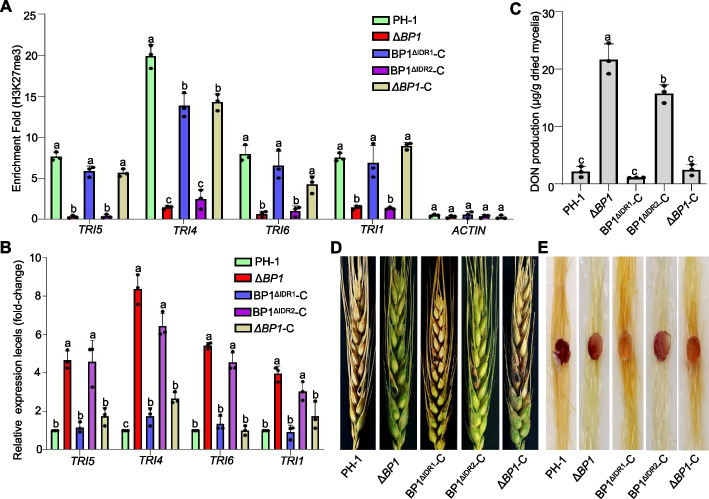
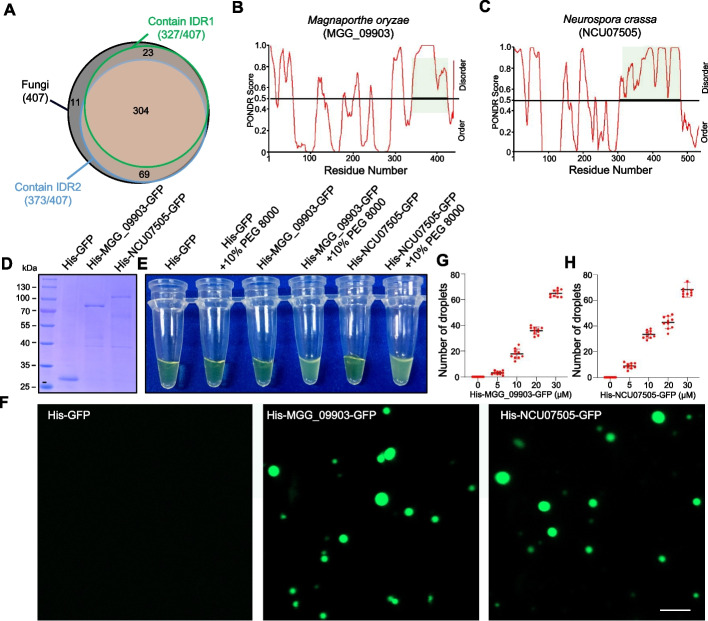
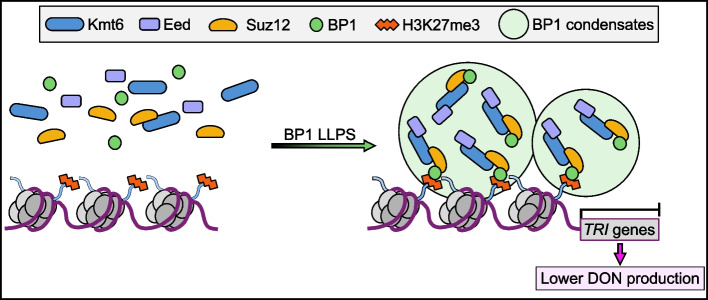
Results: We report that BP1 forms phase-separated liquid condensates to modulate its biological function in Fusarium graminearum. Deletion assays reveal that intrinsically disordered region 2 (IDR2) of BP1 mediates its liquid-liquid phase separation. The phase separation of BP1 is indispensable for its interaction with suppressor of Zeste 12, a component of polycomb repressive complex 2. Furthermore, IDR2 deletion abolishes BP1-H3K27me3 binding and alleviates the transcriptional repression of secondary metabolism-related genes, especially deoxynivalenol mycotoxin biosynthesis genes.

Conclusions: BP1 maintains transcriptional repression by forming liquid-liquid phase-separated condensates, expanding our understanding of the relationship between post-translational modifications and liquid-liquid phase separation.


Conflict of interest statement

The authors declare that they have no competing interests.

Figures

Fig. 1
Fig. 1
Loss of BP1 function upregulates DON production in Fusarium graminearum. A Diagram of the deoxynivalenol (DON) biosynthesis pathway. B Expression levels of TRI genes, as determined by transcriptome deep sequencing (RNA-seq; data were normalized to wild-type PH-1; ΔBP1/PH-1). C Relative transcript levels of TRI genes in wild-type PH-1 and ΔBP1 as determined by reverse transcription quantitative PCR (RT-qPCR). Transcript levels were normalized to ACTIN, with levels in PH-1 set to 1. Different lowercase letters denote significant differences at P = 0.05. D Genome browser view of normalized BP1-GFP chromatin immunoprecipitation sequencing (ChIP-seq) peaks at representative TRI loci. The track scale is 0–300. E Verification of ChIP-seq results by ChIP-qPCR of the indicated TRI genes in ΔBP1::BP1-GFP (the complementation strain, ΔBP1-C) using an anti-GFP antibody. Different lowercase letters denote significant differences at P = 0.05. F Toxisome formation in the wild-type PH-1, ΔBP1, and ΔBP1-C strains inoculated on a wheat (Triticum aestivum) leaf for 2 days. G GFP signal intensity for each strain, with levels in PH-1 set to 1. Different lowercase letters denote significant differences at P = 0.05. H Immunoblot analysis of proteins isolated from the same set of samples used in F, detected with an anti-GFP antibody. GAPDH was used as a loading control. I DON contents in the wild-type PH-1, ΔBP1, and ΔBP1-C complement strains after 7 days of incubation in YEPD medium. Different lowercase letters denote significant differences at P = 0.05 based on one-way ANOVA test
Fig. 2
Fig. 2
BP1 forms nuclear puncta in vivo. A Top, diagram of F. graminearum BP1 (top) with two intrinsically disordered regions (IDR1 and IDR2). Bottom, IDR analysis using the Predictor of Natural Disordered Regions (PONDR) database (http://pondr.com/). Regions with an average strength (PONDR score) ≥ 0.8 were considered to be disordered. B BP1 localization in hyphae of ΔBP1-C grown in YEPD medium at 25 °C for 24 h. The nuclei were stained with DAPI (4′,6-diamidino-2-phenylindole; blue fluorescence, 405-nm laser). The localization of BP1 to nuclear puncta is indicated by yellow arrows, scale bar, 2 μm. C Fluorescence intensity along the white line shown in B of the images of the ΔBP1-C strain expressing BP1-GFP and stained with DAPI. D BP1-GFP fluorescence in ΔBP1-C hyphae under control conditions (CK) or treated with 1% (w/v) 1,6-hexanediol before examination for GFP puncta. Scale bar, 5 μm. E 1,6-Hexanediol sensitivity of ΔBP1. The wild-type PH-1, ΔBP1, and ΔBP1-C strains were incubated on potato dextrose agar (PDA) containing 1% (w/v) 1,6-hexanediol for 3 days. Quantification of mycelial growth inhibition by 1,6-hexanediol for each strain is shown in the bar graph to the right. Different lowercase letters denote significant differences at P = 0.05. F ΔBP1-C complement strain grown in YEPD medium at 25 °C for 24 h. Fusion of nuclear puncta formed by BP1-GFP was examined by epifluorescence microscopy. Scale bar, 5 µm. G BP1-GFP nuclear puncta in the ΔBP1 mutant were subjected to fluorescence recovery after photobleaching (FRAP) experiments using a Zeiss LSM 980 confocal laser-scanning microscope. The bleaching laser intensity was set to 50%, and the excitation wavelength was 488 nm. H Quantification of BP1-GFP fluorescence intensity before and after bleaching, with six droplets included in the analysis
Fig. 3
Fig. 3
BP1 undergoes liquid–liquid phase separation in vitro. A Net charge per residue (NCPR) of BP1 was calculated using the Classification of Intrinsically Disordered Ensemble Regions (CIDER) web server (http://pappulab.wustl.edu/CIDER/analysis/). B Hydrophilicity plot of BP1 was predicted using ProtScale (https://web.expasy.org/protscale/). C 3D structure of BP1 was predicted using the AlphaFold Protein Structure Database (https://alphafold.ebi.ac.uk/). D Coomassie Brilliant Blue staining of recombinant His-GFP and His-BP1-GFP proteins purified from E. coli. E Turbidity visualization of recombinant His-GFP and His-BP1-GFP droplet formation. Tubes contained 30 μM His-GFP or His-BP1-GFP in 10% (w/v) PEG 8000 buffer. F Representative fluorescence and differential interference contrast (DIC) images of His-BP1-GFP droplets. Scale bar, 5 μm. G Confocal micrographs showing His-BP1-GFP droplets after phase separation and droplet fusion in vitro. H Phase-separated His-BP1-GFP droplets analyzed by fluorescence recovery after photobleaching (FRAP). The bleaching laser intensity was 100%, and representative images are shown. I Quantification of relative fluorescence recovery of His-BP1-GFP, six nuclei included in the analysis
Fig. 4
Fig. 4
IDR2-dependent BP1 phase separation is critical for its localization to nuclear puncta. A Diagrams of IDR-deletion BP1 variants (left panel). Coomassie Brilliant Blue staining of recombinant His-BP1-GFP, His-BP1ΔIDR1-GFP, and His-BP1ΔIDR2-GFP proteins purified from E. coli (right panel). B Assessment of turbidity indicating recombinant His-BP1-GFP, His-BP1ΔIDR1-GFP, and His-BP1ΔIDR2-GFP droplet formation. Tubes contained 30 μM His-BP1-GFP, His-BP1ΔIDR1-GFP, or His-BP1ΔIDR2-GFP in 10% (w/v) PEG 8000. C Representative fluorescence images of His-BP1-GFP, His-BP1ΔIDR1-GFP, and His-BP1ΔIDR2-GFP droplets. Scale bar, 5 μm. D Images showing the vegetative growth phenotypes of wild-type PH-1, ΔBP1, and the complementation strains ΔBP1-C, BP1ΔIDR1-C (lacking IDR1), and BP1ΔIDR2-C (lacking IDR2), grown on PDA medium for 3 days before imaging. E Subcellular localization of the IDR-deletion variants, BP1ΔIDR1-C, and BP1ΔIDR2-C, in mycelia grown in YEPD medium for 24 h. Scale bar, 5 µm. F BP1ΔIDR1-GFP nuclear puncta (upper panels) and BP1ΔIDR2-GFP diffuse nuclear localization (lower panels were subjected to FRAP experiments using a Zeiss LSM 980 confocal laser-scanning microscope). The bleaching laser intensity was set to 50%, and the excitation wavelength was 488 nm. G, H Quantification of BP1ΔIDR1-GFP (G) and BP1ΔIDR2-GFP (H) fluorescence intensity before and after bleaching, with six nuclei analyzed per strain
Fig. 5
Fig. 5
IDR2 of BP1 drives PRC2 interaction and H3K27me3 binding. A BP1 interaction with Suz12, a component of PRC2, requires IDR2 of BP1 in a yeast two-hybrid (Y2H) assay. Yeast cells harboring the indicated bait and prey constructs were assayed for growth on synthetic defined (SD) medium lacking leucine, tryptophan, histidine, and adenine SD (–Leu–Trp–His–Ade). The plasmid pair pGBKT7-53 and pGADT7 was used as the positive control. Another pair of plasmids, pGBKT7-Lam and pGADT7, was used as the negative control. Images were taken after 3 days of incubation at 30 °C. B SDS-PAGE analysis of recombinant MBP-BP1 and BP1 IDR deletion variants (MBP-BP1ΔIDR1 and MBP-BP1ΔIDR2) purified from E. coli. C Pull-down assay of the interaction between MBP-BP1ΔIDR1 or MBP-BP1ΔIDR2 and His-Suz12. Full-length MBP-BP1 was used as a positive control. D, E Interaction between BP1ΔIDR1-GFP (D), BP1ΔIDR2-GFP (E), and Suz12-Flag as examined by co-immunoprecipitation (Co-IP) in F. graminearum. GAPDH used as the loading control. F Peptide pull-down assays using the H3K27me3 peptide and either recombinant MBP-BP1 or its deletion variants (MBP-BP1ΔIDR1 and MBP-BP1ΔIDR2). MBP served as a negative control. Immunoprecipitation by biotinylated H3K27me3 was analyzed with an anti-MBP antibody. GI Isothermal titration calorimetry (ITC) assays performed to measure the binding affinity of MBP-BP1 (G), MBP-BP1ΔIDR1 (H), or MBP-BP1ΔIDR2 (I) to the H3K27me3 peptide. NDB, no detectable binding
Fig. 6
Fig. 6
IDR2 of BP1 is required for H3K27me3-mediated transcriptional repression of secondary metabolite–related genes. A Scatterplot of differentially expressed genes between the wild-type PH-1 and BP1ΔIDR2-C F. graminearum as identified by RNA-seq. The red circles represent significantly upregulated genes, and blue circles represent significantly downregulated genes (P value ≤ 0.05 and fold-change ≥ 2 or ≤  − 2, respectively). Genes not differentially expressed are shown in black. B Venn diagram showing the overlap between significantly upregulated genes in BP1ΔIDR2-C, ΔBP1, and ΔKmt6. C Venn diagram showing the overlap between significantly upregulated genes in BP1ΔIDR2-C, ΔBP1, and ΔKmt6 strains and genes harboring H3K27me3 (as identified by chromatin immunoprecipitation sequencing, ChIP-seq). D Kyoto Encyclopedia of Genes and Genomes (KEGG) analysis of the overlapping upregulated, H3K27me3-enriched genes in panel C. The top 10 significantly pathways are listed, based on enriched gene counts. E Heatmap representation of the transcriptional changes of selected secondary metabolism biosynthesis genes in BP1ΔIDR2-C strain compared to those in wild-type F. graminearum. Selected genes included those encoding polyketide synthases (PKSs), non-ribosomal peptide synthases (NRPSs), and cytochrome P450 enzymes. FH Transcript levels of secondary metabolism biosynthesis genes in BP1ΔIDR2-C as determined by RT-qPCR. Relative transcript levels were normalized to ACTIN as the internal standard and presented as means ± SD from three independent experiments. Different lowercase letters denote significant differences at P = 0.05 based on one-way ANOVA test
Fig. 7
Fig. 7
BP1ΔIDR2-C shows increased DON production and attenuated virulence in planta. A ChIP-qPCR analysis of relative H3K27me3 levels at TRI genes (TRI5, TRI4, TRI6, and TRI1) in wild-type PH-1, ΔBP1, BP1ΔIDR1-C, BP1ΔIDR2-C, and ΔBP1-C F. graminearum strains grown in toxin non-inducing conditions (YEPD) for 48 h. ACTIN served as a negative control. B Wild-type PH-1, ΔBP1, BP1ΔIDR1-C, BP1ΔIDR2-C, and ΔBP1-C strains were cultured in YEPD medium for 48 h. Total RNA was extracted for RT-qPCR analysis to determine relative transcript levels of TRI genes. Transcript levels were normalized to ACTIN. C DON production in the wild-type, ΔBP1 mutant, and complementation strains (BP1ΔIDR1-C, BP1ΔIDR2-C and ΔBP1-C) after 7 days of growth in YEPD medium. Different lowercase letters denote significant differences at P = 0.05 based on one-way ANOVA test. D, E Pathogenicity of the wild-type, mutant, and various complementation strains incubated in the central section spikelet of single flowering wheat head for 15 days (D) and on maize silks for 5 days (E)
Fig. 8
Fig. 8
Phase separation of BP1 orthologs is ubiquitous in fungi. A Venn diagram of IDR distribution in BP1 orthologs from fungi (407 total, black). Among the fungal BP1 orthologs, the number of proteins containing IDR1 (327, green) and IDR2 (373, blue) is shown. B, C The IDRs of Magnaporthe oryzae MGG_09903 (B) and Neurospora crassa NCU07505 (C) were detected by the Predictor of Natural Disordered Regions database. D Coomassie brilliant blue staining of recombinant His-MGG_09903-GFP and His-NCU07505-GFP proteins purified from E. coli. E Turbidity assay of recombinant His-MGG_09903-GFP and His-NCU07505-GFP in buffer containing 10% (w/v) PEG 8000 to visualize separation of high-concentration condensates. F Representative micrographs of His-MGG_09903-GFP and His-NCU07505-GFP protein preparations. G, H Quantifications of droplet numbers (G) and droplet area (H) are shown
Fig. 9
Fig. 9
A proposed model showing the role of BP1 phase separation in maintaining the transcriptional repression of DON mycotoxin biosynthesis genes. Under normal growth condition, H3K27me3 reader BP1 undergoes LLPS to form dynamic phase-separated liquid condensates in the nucleus. The condensates recruit and concentrate PRC2 protein complex (Kmt6-Suz12-Eed) to effectively regulate transcriptional repression of H3K27me3 binding genes, such as DON mycotoxin biosynthesis TRI genes, leading lower DON production

Similar articles

References

    1. Millán-Zambrano G, Burton A, Bannister AJ, Schneider R. Histone post-translational modifications—cause and consequence of genome function. Nat Rev Genet. 2022;23:563–580. doi: 10.1038/s41576-022-00468-7. - DOI - PubMed
    1. Michalak EM, Burr ML, Bannister AJ, Dawson MA. The roles of DNA, RNA and histone methylation in ageing and cancer. Nat Rev Mol Cell Biol. 2019;20:573–589. doi: 10.1038/s41580-019-0143-1. - DOI - PubMed
    1. Cavalli G, Heard E. Advances in epigenetics link genetics to the environment and disease. Nature. 2019;571:489–499. doi: 10.1038/s41586-019-1411-0. - DOI - PubMed
    1. Hyun K, Jeon J, Park K, Kim J. Writing, erasing and reading histone lysine methylations. Exp Mol Med. 2017;49:e324. doi: 10.1038/emm.2017.11. - DOI - PMC - PubMed
    1. Li N, Li Y, Lv J, Zheng X, Wen H, Shen H, Zhu G, Chen TY, Dhar SS, Kan PY, et al. ZMYND8 reads the dual histone mark H3K4me1-H3K14ac to antagonize the expression of metastasis-linked genes. Mol Cell. 2016;63:470–484. doi: 10.1016/j.molcel.2016.06.035. - DOI - PMC - PubMed

Publication types

MeSH terms