Echinacoside ameliorates hepatic fibrosis and tumor invasion in rats with thioacetamide-induced hepatocellular carcinoma
- PMID: 38461536
- PMCID: PMC11379005
- DOI: 10.17305/bb.2024.10367
Echinacoside ameliorates hepatic fibrosis and tumor invasion in rats with thioacetamide-induced hepatocellular carcinoma
Abstract
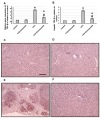
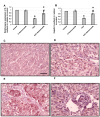
Hepatocellular carcinoma (HCC) affects approximately 800,000 individuals globally each year. Despite advancements in HCC treatments, there is still a pressing need to identify new drugs that can combat resistance. One potential option is echinacoside, a natural caffeic acid glycoside with antioxidant, anti-inflammatory, antidepressant, and antidiabetic properties. Therefore, we aimed to investigate the ability of echinacoside to exhibit antitumor activity against HCC in rats through ameliorating hepatic fibrosis and tumor invasion. Rats were given thioacetamide to induce HCC, and some were given 30 mg/kg of echinacoside twice a week for 16 weeks. The liver impairment was assessed by measuring serum α-fetoprotein (AFP) and examining liver sections stained with Masson trichrome or anti-transforming growth factor (TGF)-β1 antibodies. The hepatic expression of mRNA and protein levels of TGF-β1, β-catenin, SMAD4, matrix metalloproteinase-9 (MMP9), phosphoinositide 3-kinases (PI3K), mammalian target of rapamycin (mTOR), connective tissue growth factor 2 (CCN2), E-Cadherin, platelets derived growth factor (PDGF)-B and fascin were also analyzed. Echinacoside improved the survival rate of rats by decreasing serum AFP and the number of hepatic nodules. Examination of micro-images indicated that echinacoside can reduce fibrosis. It also significantly decreased the expression of TGF-β1, β-catenin, SMAD4, MMP9, PI3K, mTOR, CCN2, PDGF-B, and fascin while enhancing the expression of E-Cadherin. In conclusion, echinacoside exhibits a protective effect against HCC by increasing survival rates and decreasing tumor growth. It also acts as an inhibitor of the hepatic tissue fibrosis pathway by reducing the expression of TGF-β1, β-catenin, SMAD4, PI3K, CCN2, PDGF-B and mTOR. Additionally, it prevents tumor invasion by suppressing MMP9 and fascin, and increasing the expression of E-Cadherin.
Conflict of interest statement
Conflicts of interest: Authors declare no conflicts of interest.
Figures


Similar articles
-
Therapeutic effects of blocking β-catenin against hepatocellular carcinoma-induced activation of inflammation, fibrosis and tumor invasion.Biomed Pharmacother. 2021 Mar;135:111216. doi: 10.1016/j.biopha.2021.111216. Epub 2021 Feb 1. Biomed Pharmacother. 2021. PMID: 33433352
-
WRH-2412 alleviates the progression of hepatocellular carcinoma through regulation of TGF-β/β-catenin/α-SMA pathway.J Enzyme Inhib Med Chem. 2023 Dec;38(1):2185761. doi: 10.1080/14756366.2023.2185761. J Enzyme Inhib Med Chem. 2023. PMID: 36912230 Free PMC article.
-
Isoviolanthin Extracted from Dendrobium officinale Reverses TGF-β1-Mediated Epithelial⁻Mesenchymal Transition in Hepatocellular Carcinoma Cells via Deactivating the TGF-β/Smad and PI3K/Akt/mTOR Signaling Pathways.Int J Mol Sci. 2018 May 23;19(6):1556. doi: 10.3390/ijms19061556. Int J Mol Sci. 2018. PMID: 29882900 Free PMC article.
-
Connective tissue growth factor is overexpressed in human hepatocellular carcinoma and promotes cell invasion and growth.World J Gastroenterol. 2012 Dec 21;18(47):7070-8. doi: 10.3748/wjg.v18.i47.7070. World J Gastroenterol. 2012. PMID: 23323010 Free PMC article.
-
Hepatoprotective and anti-tumor effects of targeting MMP-9 in hepatocellular carcinoma and its relation to vascular invasion markers.Clin Exp Metastasis. 2015 Jun;32(5):479-93. doi: 10.1007/s10585-015-9721-6. Epub 2015 May 22. Clin Exp Metastasis. 2015. PMID: 25999065
Cited by
-
Evaluating anticancer activity of emodin by enhancing antioxidant activities and affecting PKC/ADAMTS4 pathway in thioacetamide-induced hepatocellular carcinoma in rats.Redox Rep. 2024 Dec;29(1):2365590. doi: 10.1080/13510002.2024.2365590. Epub 2024 Jun 11. Redox Rep. 2024. PMID: 38861483 Free PMC article.
References
-
- Alqahtani A, Khan Z, Alloghbi A, Said Ahmed TS, Ashraf M, Hammouda DM. Hepatocellular carcinoma: molecular mechanisms and targeted therapies. Medicina (Kaunas) 2019;55:526. https://doi.org/10.3390/medicina55090526. - PMC - PubMed
-
- Chidambaranathan-Reghupaty S, Fisher PB, Sarkar D. Hepatocellular carcinoma (HCC): epidemiology, etiology and molecular classification. Adv Cancer Res. 2021;149:1–61. https://doi.org/10.1016/bs.acr.2020.10.001. - PMC - PubMed
-
- Ikeda M, Morizane C, Ueno M, Okusaka T, Ishii H, Furuse J. Chemotherapy for hepatocellular carcinoma: current status and future perspectives. Jpn J Clin Oncol. 2018;48:103–14. https://doi.org/10.1093/jjco/hyx180. - PubMed
-
- Mandlik DS, Mandlik SK, Choudhary HB. Immunotherapy for hepatocellular carcinoma: current status and future perspectives. World J Gastroenterol. 2023;29:1054–75. https://doi.org/10.3748/wjg.v29.i6.1054. - PMC - PubMed
-
- Frangogiannis N. Transforming growth factor-beta in tissue fibrosis. J Exp Med. 2020;217:e20190103. https://doi.org/10.1084/jem.20190103. - PMC - PubMed
MeSH terms
Substances
LinkOut - more resources
Full Text Sources
Medical
Miscellaneous

