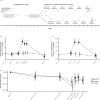
Glucose ingestion before and after resistance training sessions does not augment ribosome biogenesis in healthy moderately trained young adults
- PMID: 38459192
- PMCID: PMC11322406
- DOI: 10.1007/s00421-024-05446-x
Glucose ingestion before and after resistance training sessions does not augment ribosome biogenesis in healthy moderately trained young adults
Abstract
Purpose: Resistance training-induced skeletal muscle hypertrophy seems to depend on ribosome biogenesis and content. High glucose treatment may augment ribosome biogenesis through potentiating resistance training-induced adaptations. This was investigated with total RNA and ribosomal RNA abundances as main outcomes, with relevant transcriptional/translational regulators (c-Myc/UBF/rpS6) as a secondary outcome.
Methods: Sixteen healthy, moderately trained individuals [male/female, n = 9/7; age, 24.1 (3.3)] participated in a within-participant crossover trial with unilateral resistance training (leg press and knee extension, 3 sets of 10 repetitions maximum) and pre- and post-exercise ingestion of either glucose (3 × 30 g, 90 g total) or placebo supplements (Stevia rebaudiana, 3 × 0.3 g, 0.9 g total), together with protein (2 × 25 g, 50 g total), on alternating days for 12 days. Six morning resistance exercise sessions were conducted per condition, and the sessions were performed in an otherwise fasted state. Micro-biopsies were sampled from m. vastus lateralis before and after the intervention.
Results: Glucose ingestion did not have beneficial effects on resistance training-induced increases of ribosomal content (mean difference 7.6% [- 7.2, 24.9], p = 0.34; ribosomal RNA, 47S/18S/28S/5.8S/5S, range 7.6-37.9%, p = 0.40-0.98) or levels of relevant transcriptional or translational regulators (c-MYK/UBF/rpS6, p = 0.094-0.292). Of note, both baseline and trained state data of total RNA showed a linear relationship with UBF; a ∼14% increase in total RNA corresponded to 1 SD unit increase in UBF (p = 0.003).
Conclusion: Glucose ingestion before and after resistance training sessions did not augment ribosomal RNA accumulation during twelve days of heavy-load resistance training in moderately trained young adults.
Keywords: Glucose; Hypertrophy; Resistance training; Ribosome; Skeletal muscle.
© 2024. The Author(s).
Conflict of interest statement
This study was financed through research funds from the Inland Norway University of Applied Sciences. The authors have no competing interests to declare, and researchers and associates participating in the study conduct received only a regular salary.
Figures


Similar articles
-
Falls prevention interventions for community-dwelling older adults: systematic review and meta-analysis of benefits, harms, and patient values and preferences.Syst Rev. 2024 Nov 26;13(1):289. doi: 10.1186/s13643-024-02681-3. Syst Rev. 2024. PMID: 39593159 Free PMC article.
-
Post-exercise hot-water immersion is not effective for ribosome biogenesis in rat skeletal muscle.Am J Physiol Regul Integr Comp Physiol. 2024 Dec 1;327(6):R601-R615. doi: 10.1152/ajpregu.00068.2024. Epub 2024 Nov 4. Am J Physiol Regul Integr Comp Physiol. 2024. PMID: 39495238
-
Effect of Strength Training Programs in Middle- and Long-Distance Runners' Economy at Different Running Speeds: A Systematic Review with Meta-analysis.Sports Med. 2024 Apr;54(4):895-932. doi: 10.1007/s40279-023-01978-y. Epub 2024 Jan 2. Sports Med. 2024. PMID: 38165636 Free PMC article.
-
Physical exercise training for type 3 spinal muscular atrophy.Cochrane Database Syst Rev. 2019 Mar 1;3(3):CD012120. doi: 10.1002/14651858.CD012120.pub2. Cochrane Database Syst Rev. 2019. PMID: 30821348 Free PMC article. Review.
-
Interventions for providers to promote a patient-centred approach in clinical consultations.Cochrane Database Syst Rev. 2012 Dec 12;12(12):CD003267. doi: 10.1002/14651858.CD003267.pub2. Cochrane Database Syst Rev. 2012. PMID: 23235595 Free PMC article. Review.
References
-
- Bates D, Mächler M, Bolker B, Walker S (2014) Fitting linear mixed-effects models using lme4. arXiv Prepr. 10.48550/ARXIV.1406.582310.48550/ARXIV.1406.5823 - DOI
Publication types
MeSH terms
Substances
LinkOut - more resources
Full Text Sources
Miscellaneous

