. 2024 Jun;23(6):e14131.
doi: 10.1111/acel.14131. Epub 2024 Mar 7.

Integrin restriction by miR-34 protects germline progenitors from cell death during aging

Affiliations

Integrin restriction by miR-34 protects germline progenitors from cell death during aging

Noam Perry et al. Aging Cell. 2024 Jun.

Abstract

During aging, regenerative tissues must dynamically balance the two opposing processes of proliferation and cell death. While many microRNAs are differentially expressed during aging, their roles as dynamic regulators of tissue regeneration have yet to be described. We show that in the highly regenerative Drosophila testis, miR-34 levels are significantly elevated during aging. miR-34 modulates germ cell death and protects the progenitor germ cells from accelerated aging. However, miR-34 is not expressed in the progenitors themselves but rather in neighboring cyst cells that kill the progenitors. Transcriptomics followed by functional analysis revealed that during aging, miR-34 modifies integrin signaling by limiting the levels of the heterodimeric integrin receptor αPS2 and βPS subunits. In addition, we found that in cyst cells, this heterodimer is essential for inducing phagoptosis and degradation of the progenitor germ cells. Together, these data suggest that the miR-34-integrin signaling axis acts as a sensor of progenitor germ cell death to extend progenitor functionality during aging.

Keywords: drosophila; miR‐34; aging; integrin; micro‐RNAs; phagoptosis; spermatogenesis.


Conflict of interest statement

The authors declare no competing interests.

Figures

FIGURE 1
FIGURE 1
GCD increases at the apical tip of the testis of aged miR‐34 null. (a) Schematic representation and immunofluorescent image of the apical tip of the testis (side‐view). GSCs (blue) flanked by CySCs (green) are both attached to the hub (magenta). Spermatogonia germ cells (blue) are transit‐amplified progenitor cells encapsulated by cyst cells (green). Cyst cells also induce GCD of targeted spermatogonia (red). The differentiation axis (arrow) runs from the apical (stem cell niche) to the basal end (sperm maturation). In the immunofluorescent image, the hub was labeled with anti‐Fas3 antibodies (magenta) and germ cells with anti‐Vasa (blue) antibodies. GCD was labeled with LysoTracker (red) and cyst cells were genetically labeled with GFP (green). (b, c) Quantification of the volume of LysoTracker‐positive germ cells as measured with Imaris in the testes of 1, 15 or 30 day‐old wild‐type control males (w1118, blue dots) and from 1 or 15 day‐old miR‐34 null males (purple dots). Note no significant change in GCD during aging of wild‐type males (b) and age‐related increase in GCD in testes of 15 day‐old miR‐34 null (c) Statistical significance was determined by a Kruskal‐Wallis test; ****p ≤ 0.0001 and ns = not significant. (d‐i) Representative images of the apical tip of the testes of 1, 15 or 30 day‐old wild‐type (w1118, d–f) or miR‐34 null (g–i’) males. Testes were stained with LysoTracker (red, GCD), DAPI (nuclei) and immunostained for Vasa (blue, germ cells) and Fas3 (green, hub). The total number of testes scored: Control (w1118) 1 day‐old (n = 40), 15 day‐old (n = 39) and 30 day‐old (n = 34); miR‐34 null 1 day‐old (n = 43) and 15 day‐old (n = 39). Asterisks mark the hub and scale bars represent 10 μm. Note the accelerated aging in testes of miR‐34 null flies, the increase in GCD at 15 days and complete loss of the stem cell niche and regeneration at 33% of testes from 30‐days old males.
FIGURE 2
FIGURE 2
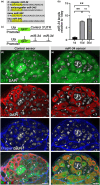
miR‐34 is expressed in somatic cells and its levels increase during aging. (a) miR‐34 sequence as expressed in four organisms: C. elegans, Drosophila, mouse (mmu) and humans (hsa). The evolutionarily conserved seed sequence is marked in yellow. (b) qRT‐PCR of mature miR‐34 relative to control (2S rRNA) in the testes of 1, 15 or 30 day‐old wild‐type (w1118) males. Levels are normalized to those of 1‐day‐old adults. Error bars denote s.d. of three biological repeats, each performed in triplicate measurements. Note the 9‐fold increase of miR‐34 levels at 30 days. Statistical significance was determined by one‐way ANOVA and posthoc analysis was performed with Tukey multi‐comparison test. **p values ≤0.005 between 15 and 1 day‐olds and between 30 and 1 day‐olds. (c) Schematic representation of GFP‐control and GFP‐miR‐34 sensors. (d, e) Testes of GFP‐control sensor (d, green) and GFP‐miR‐34 sensor (e, green) flies immunostained for Vasa to mark germ cells (red) and for Draper (blue) to mark the hub and cyst cell membranes and stained with DAPI to label the nuclei. A GFP‐control sensor was expressed in all cells at the apical tip of the testis, including the hub (asterisk), GSCs (arrowhead), CySCs, cyst cells (arrows) and spermatogonia. The GFP‐miR‐34 sensor detected endogenous levels of miR‐34 in the somatic niche (hub and CySCs) and in cyst cells (no GFP expression). Note that miR‐34 was not expressed in germ cells (e, GFP is detected). Asterisks mark the hub and scale bars represent 10 μm.
FIGURE 3
FIGURE 3
miR‐34 regulates integrin receptor in aged testis and integrin receptor expression in GCD. (a) Venn diagram of genes increased in testis from aged (30 day‐old) miR‐34 null mutants (purple), relative to age‐matched controls as determined by transcriptome analysis versus computationally predicted miR‐34 targets (blue; http://www.targetscan.org/). Shown in the center of the Venn diagram are the 19 genes (Table S2) that were found in both groups; differential gene analysis (purple group) and miR34 in silico predicted targets. (b, c) qRT‐PCR analyses of RNA of two integrins receptor subunits, αPS2 (b) and βPS (c), extracted from testes of young and aged miR‐34 mutants (purple), as compared to aged‐matched control (blue), relative to the average of the two normalizing genes sdh1 and actin42a. Levels are normalized to those in a 1‐day old control. Note the significant 2‐fold increase in expression of the integrin receptor subunits in aged testes. Error bars denote SD of three biological repeats each performed in triplicate measurements. Statistical significance was determined as in 2d. p values ** ≤ 0.01 (b) or * ≤ 0.05 (c) between aged miR‐34 mutants and controls. (d, e) Testes were stained with LysoTracker (red, GCD events) and immunostained for Vasa (blue) and αPS2 (d, green) or βPS (e, green). Note rectangles and blown‐up insets highlighting advanced GCD events. Arrows mark expression of αPS2 and βPS at the membrane of cyst cells that penetrate into notches of degraded germ cells. Asterisks mark the hub and scale bars represent 10 μm.
FIGURE 4
FIGURE 4
Integrin signaling is activated in GCD and increases in aged miR‐34 null. (a–c) Snapshots of live‐imaged testis, marked with LysoTracker (red), Hoechst stain (blue, nuclei) and GFP (cyst cells, ILK‐GFP). Time (h:Min) is shown on the bottom left of the images. Bottom images are separate channels views of the areas surrounded by the yellow and red rectangles, highlighting dynamic expression of ILK during two GCD events. The yellow rectangle marks a new GCD event depicting packed DNA in separate nuclei (a), acidification begins after ~1 h by the onset of LysoTracker expression (b), and DNA further involuted into one bundle (c). The red rectangle marks an advanced GCD event with one bundle of DNA (a‐b) which is completely degraded within ~5 h (c). Arrow marks LysoTracker‐free blebs, which may serve as a transport mechanism to recycle components of the dying germ cells. Asterisks mark the hub and scale bars correspond to 10 μm. (d,e) Western blot analysis of protein extracted from cytoplasm and membrane fractions of young 1 day and aged 30 day‐old control (w1118), miR‐34 null mutants, ilk‐gfp and miR‐34, ilkGFP 41 recombinant flies. (d) Shown is a representative Western blot of n = 4 (biological repeats) cytoplasm (left) and membrane (right) fractions of young and aged testes from control (w1118), miR‐34 null, ilk‐gfp and miR‐34, ilkGFP 41 males, as indicated. Membranes were blotted with anti‐GFP (upper), anti‐Actin (middle) and anti‐Dicer (lower) antibodies. (e) Quantification of membrane GFP relative to Dicer; levels are normalized to ILK‐GFP levels in 1 day‐old flies (n = 4, biological repeats). Statistical significance was determined by one‐way ANOVA and posthoc analysis was performed with Tukey multi‐comparison test. p values ** ≤ 0.01 between aged control and recombinant flies. Note the higher ILK‐GFP expression in aged miR‐34, ilkGFP 41 recombinants.
FIGURE 5
FIGURE 5
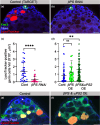
Integrin signaling by cyst cells regulates GCD. (a–c) Immunofluorescent images of testes from 7 day‐old control TARGET flies (a) c587Gal4;Gal80ts outcrossed to w1118 (n = 32) and βPS RNAi transgene expressed in cyst cells of adult males by TARGET driver (b) c587Gal4;Gal80ts, UAS‐mysRNAi (n = 27). Testes were labeled with LysoTracker (red, dying germ cells) and for Fas3 (green, hub) and Vasa (blue, live germ cells). Quantification of the volume of LysoTracker‐positive germ cells as measured with Imaris (c) control, blue dots and mys RNAi, pink dots. Note the significant reduction in GCD in testes of βPS RNAi‐expressing flies. Statistical significance was determined by a Mann–Whitney test, ****p ≤ 0.0001. (d, e) Quantification of the volume of LysoTracker‐positive germ cells, as measured with Imaris (d) of control (c587Gal4; UAS‐cytGFP/+; blue dots), βPS OE (c587Gal4; UAS‐cytGFP/UAS‐βps‐GFP; light green dots) and βPS & αPS2 OE (c587Gal4; UAS‐cytGFP/UAS‐βps, UAS‐ αps2; dark green dots). Note the significant increase in GCD only in testes expressing the two integrin receptor subunits in cyst cells. Immunofluorescent images of testes from control (e) and from βPS & αPS2 overexpressing flies (F). Statistical significance was determined by a Kruskal‐Wallis test. **p ≤ 0.01; ns, not significant. Asterisks mark the hub and scale bars correspond to 10 μm.
FIGURE 6
FIGURE 6
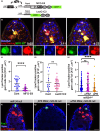
Integrin signaling by cyst cells regulates GCD. (a) Schematic representation of the secreted PS‐integrin binding protein, MFG‐E8‐GFP. MFG‐E8 includes C1 and C2 domains that bind PS and the RGD motif that binds the integrin receptor. LactC1C2‐GFP is a truncated version of MFG‐E8‐GFP that lacks the integrin‐interacting RGD motif. (b) Snapshots of live‐imaged testis, marked with LysoTracker (red), Hoechst (blue, nuclei) and MFG‐E8‐GFP (green) expressed in and secreted from cyst cells (c587Gal4;UAS‐mfg‐e8‐gfp). Lower panels are high‐magnification views of one GCD event (white arrow) highlighting the MFG‐E8‐mediated signal of PS exposure accumulating for ~4 h. Time (h:min) is shown on the bottom right of the images, asterisks mark the hub and scale bars correspond to 10 μm. (c–e) Quantification of the volume of LysoTracker‐positive germ cells, as measured with Imaris. (c) Control, blue dots (C587Gal4 outcrossed to W1118; n = 29) and MFG‐E8‐GFP, purple dots (c587gal4::uas‐mfg‐e8‐gff; n = 32). Note the significant reduction in GCD in testes of MFG‐E8‐GFP‐expressing flies. (d) Control, blue dots (C587Gal4; Gal80 ts outcrossed to W1118; n = 14), and LactC1C2‐GFP (c587gal4; gal80 ts ::uas‐lactc1c2‐gfp; n = 26). Note that the integrin‐interacting motif is required to reduce GCD. (e) miR‐34 null (blue dots), αPS2 RNAi (pink dots) and βPS RNAi (orange dots) expressed in cyst cells of miR‐34 null flies. Statistical significance was determined by a Mann–Whitney test; ****p ≤ 0.0001 and ns = not significant. Note that reduction of βPS in cyst cells is sufficient to rescue the excessive GCD in testes of miR‐34 null. (f–h) Immunofluorescent images of testes from (f) miR‐34 null (tjGal4; miR‐34 null; n = 49), (g) βPS and αPS2 (h) RNAi transgenes expressed in cyst cells of miR‐34 null (tjGal4; UAS‐mysRNAi miR‐34 null; n = 49), Testes were labeled with LysoTracker (red, dying germ cells) and immunostained for Fas3 (green, hub) and Vasa (blue, live germ cells). Asterisks mark the hub and scale bars correspond to 10 μm.

Similar articles

References

    1. Agostini, M. , & Knight, R. A. (2014). miR‐34: From bench to bedside. Oncotarget, 5(4), 872–881. 10.18632/oncotarget.1825 - DOI - PMC - PubMed
    1. Alenzi, F. Q. , Alenazi, B. Q. , Ahmad, S. Y. , Salem, M. L. , Al‐Jabri, A. A. , & Wyse, R. K. (2009). The haemopoietic stem cell: Between apoptosis and self renewal. The Yale Journal of Biology and Medicine, 82(1), 7–18. https://www.ncbi.nlm.nih.gov/pubmed/19325941 - PMC - PubMed
    1. Allan, D. J. , Harmon, B. V. , & Roberts, S. A. (1992). Spermatogonial apoptosis has three morphologically recognizable phases and shows no circadian rhythm during normal spermatogenesis in the rat. Cell Proliferation, 25(3), 241–250. 10.1111/j.1365-2184.1992.tb01399.x - DOI - PubMed
    1. Boada‐Romero, E. , Martinez, J. , Heckmann, B. L. , & Green, D. R. (2020). The clearance of dead cells by efferocytosis. Nature Reviews. Molecular Cell Biology, 21(7), 398–414. 10.1038/s41580-020-0232-1 - DOI - PMC - PubMed
    1. Bokel, C. , & Brown, N. H. (2002). Integrins in development: Moving on, responding to, and sticking to the extracellular matrix. Developmental Cell, 3(3), 311–321. 10.1016/s1534-5807(02)00265-4 - DOI - PubMed

Publication types

LinkOut - more resources