. 2024 Apr 1;35(4):br10.
doi: 10.1091/mbc.E23-10-0388. Epub 2024 Mar 6.

Tools for live-cell imaging of cytoskeletal and nuclear behavior in the unconventional yeast, Aureobasidium pullulans

Affiliations

Tools for live-cell imaging of cytoskeletal and nuclear behavior in the unconventional yeast, Aureobasidium pullulans

Claudia A Petrucco et al. Mol Biol Cell. .

Abstract

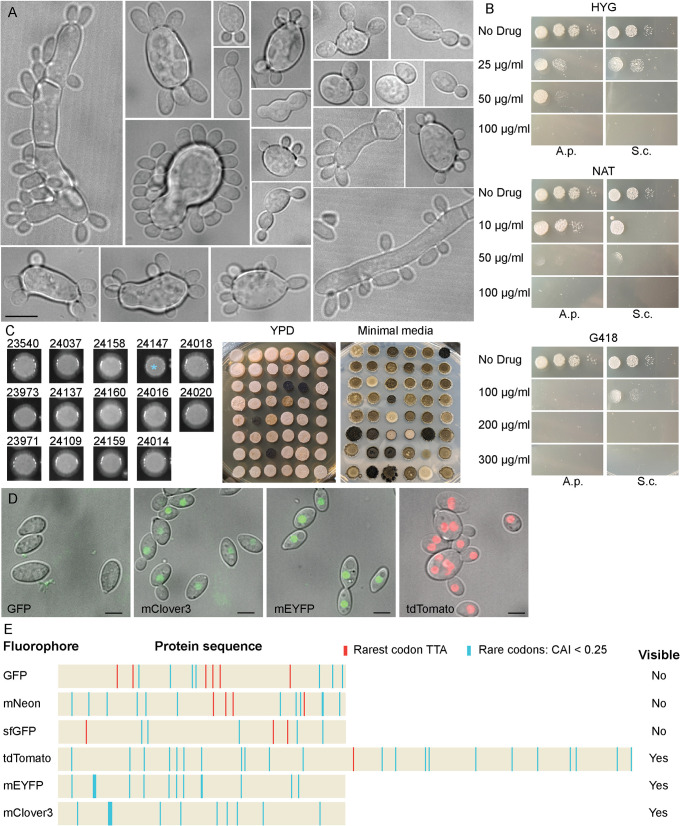
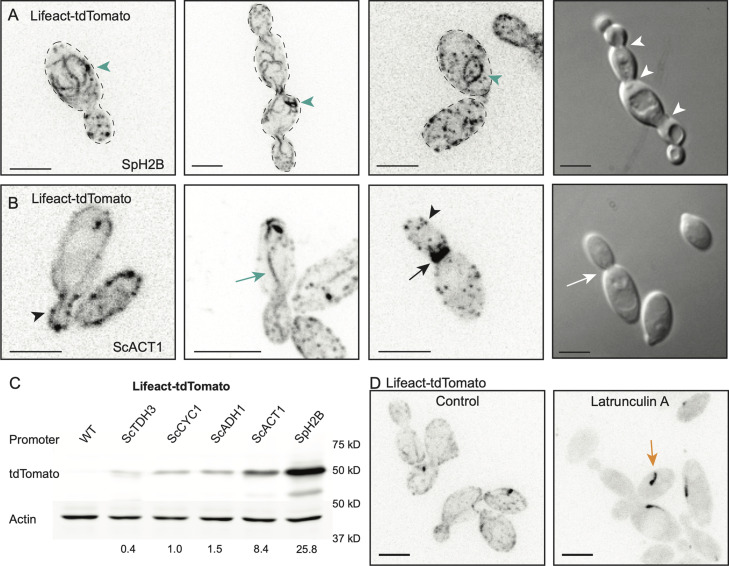
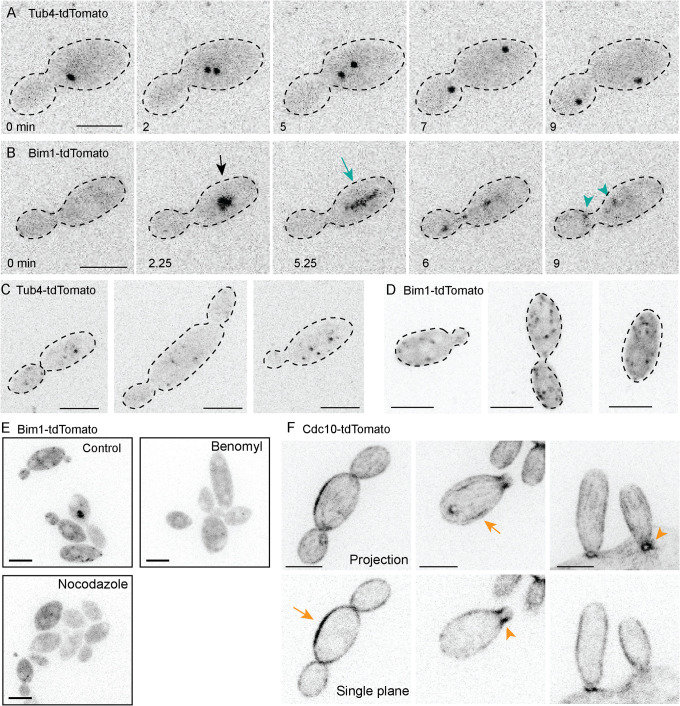
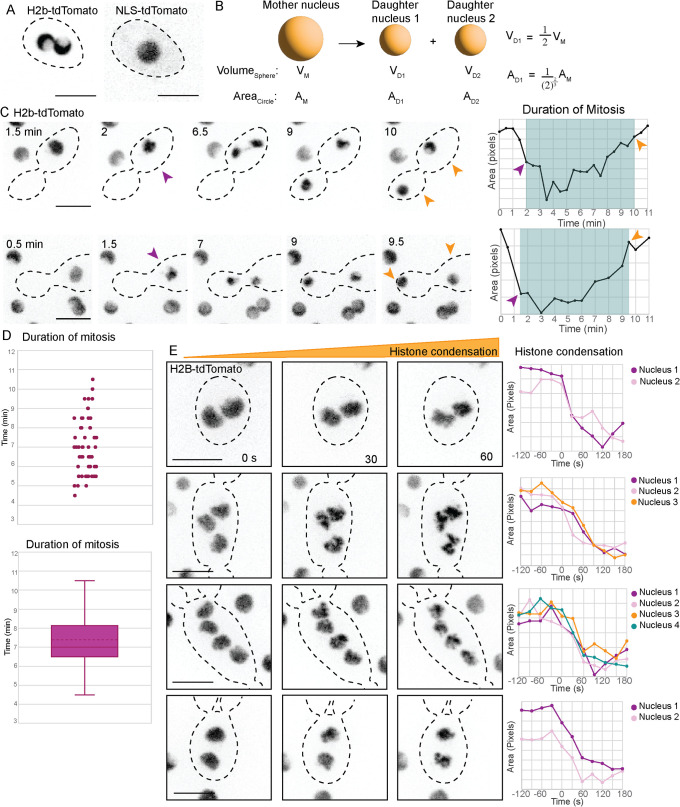
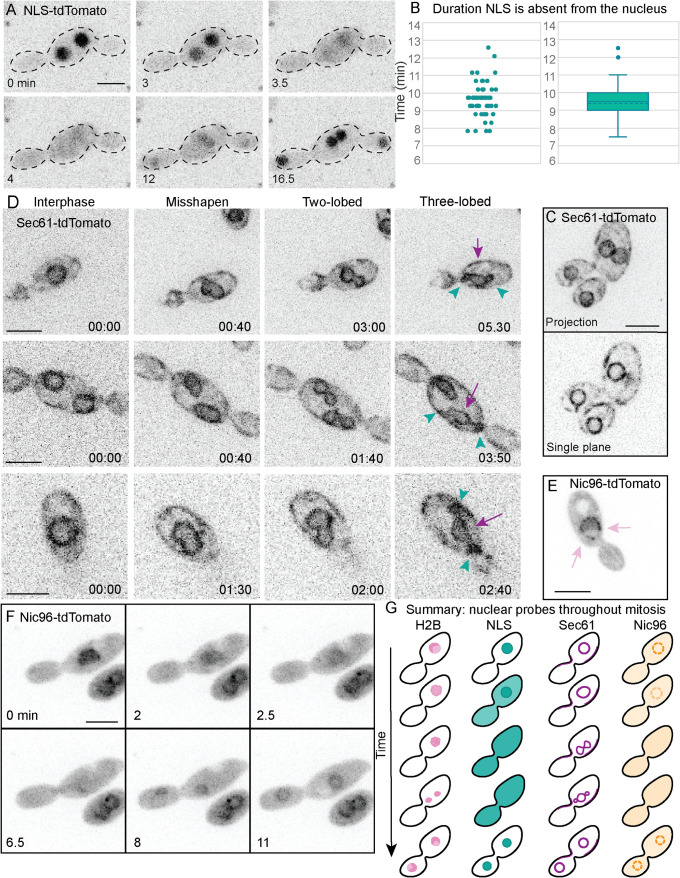
Aureobasidium pullulans is a ubiquitous fungus with a wide variety of morphologies and growth modes including "typical" single-budding yeast, and interestingly, larger multinucleate yeast than can make multiple buds in a single cell cycle. The study of A. pullulans promises to uncover novel cell biology, but currently tools are lacking to achieve this goal. Here, we describe initial components of a cell biology toolkit for A. pullulans, which is used to express and image fluorescent probes for nuclei as well as components of the cytoskeleton. These tools allowed live-cell imaging of the multinucleate and multibudding cycles, revealing highly synchronous mitoses in multinucleate yeast that occur in a semiopen manner with an intact but permeable nuclear envelope. These findings open the door to using this ubiquitous polyextremotolerant fungus as a model for evolutionary cell biology.


Figures

FIGURE 1:
FIGURE 1:
A. pullulans morphology and transformation. (A) Examples of A. pullulans morphology. DIC images of EXF-150 strain grown in YPD. Scale bar, 10 µm. (B) Sensitivity of A. pullulans (A.p.) and S. cerevisiae (S.c.) to three antibiotics – hygromycin (HYG), nourseothricin (NAT), and geneticin (G418). 5000, 500, 50, and five cells were spotted onto YPD plates with the indicated antibiotics and grown for 2 d at 25°C. (C) AMT yields antibiotic-resistant colonies. Large colonies behave similarly to the parent untransformed strain (left), with the exception of strains expressing the Lifeact probe from the strong histone promoter (blue asterisk). Numbers correspond to strains used in this study (Table 3). Smaller colonies exhibit a range of morphologies and melanization (right), presumably due to integration of transforming DNA at different genomic locations. The same strains were spotted onto plates with different media as indicated. (D) Transformants with tagged histone H2B show nuclear signal when tagged with mClover3, mEYFP, and tdTomato, but not GFP. Merged DIC and maximum projection images. Scale bar, 5 µm. (E) Presence of A. pullulans rare codons (CAI < 0.25) in different fluorescent proteins. TTA codons (orange) were prevalent in genes encoding fluorescent proteins that were not detected.
FIGURE 2:
FIGURE 2:
Visualization of F-actin in A. pullulans. (A) Lifeact-tdTomato expressed from the SpH2B promoter decorates cytoplasmic loops and lariats (green arrowheads), and buds from these cells often fail to divide and detach from mother cell (white arrowheads indicate sites of failed cytokinesis). Inverted maximum projection and DIC images of DLY24147. (B) F-actin structures in cells expressing Lifeact-tdTomato from the ScACT1 promoter, highlighting examples of cortical actin patches (black arrowheads), actin cables extending from mother to bud (green arrow), and putative rings at the mother-bud neck (black arrow). Buds did not fail to detach from mother cells (white arrows indicate normal cytokinesis). Inverted maximum projection and DIC images of DLY24016. (C) Western blot of Lifeact-tdTomato expressed from different promoters in A. pullulans. Cell extracts were analyzed by western blotting with antibodies against tdTomato and actin. tdTomato abundance (normalized against actin) is shown below each lane. Similar results were obtained in two western blots. Strains DLY23540, DLY24020, DLY24018, DLY24014, DLY24016, and DLY24147. (D) Treatment of cells expressing Lifeact-tdTomato with 200 µM Latrunculin A for 15 min eliminated all cables and patches but not an occasional dark comet (orange arrow). Inverted maximum projection images of DLY24016. Scale bars, 5 µm.
FIGURE 3:
FIGURE 3:
Visualization of microtubule ends and septins in A. pullulans. (A) Dividing cells show strong Tub4-tdTomato puncta consistent with separating SPBs in mitosis. Time-lapse inverted maximum projection images of DLY24109. (B) Dividing cells show a strong Bim1-tdTomato signal (black arrow) that elongates (green arrow) and disassembles leaving two puncta (green arrowheads) in a manner suggestive of mitotic spindle behavior. Time lapse inverted maximum projection images of DLY24137. (C) Some postmitotic cells exhibit multiple faint Tub4-tdTomato puncta (potential non-SPB MTOCs). Inverted maximum projection images of DLY24019 taken with stronger illumination. (D) Some postmitotic cells exhibit multiple weak puncta of Bim1-tdTomato consistent with interphase microtubule plus ends. Inverted maximum projection images of DLY24137 taken with stronger illumination. (E) Cells expressing Bim1-tdTomato were treated with 50 nM Nocodazole or 200 µM Benomyl for 15 min. Treated cells had few Bim1-tdTomato puncta and lacked presumed mitotic spindles. Inverted maximum projection images of DLY24137. (F) Septin probe Cdc10-tdTomato. Postmitotic cells exhibit fainter linear cortical elements (orange arrows). Dividing cells show a strong septin signal at each mother-bud neck (orange arrowheads). Inverted maximum projection (top) and single-plane (bottom) confocal images of DLY24160. Scale bars, 5 µm.
FIGURE 4:
FIGURE 4:
Synchronous mitosis in A. pullulans. (A) H2B-tdTomato signal (presumed chromatin) decorates a cup-shaped zone in interphase cells, in contrast to NLS-tdTomato that appears as uniform spheres (presumed nuclei). Inverted single plane confocal images of DLY23973 and DLY23971. (B) When a sphere is divided into two spheres with preservation of total volume (presumed condition for division of a mother nucleus into daughter nuclei), the summed areas of the daughter spheres are greater than the area of the mother sphere, and a geometrical correction factor is used to plot area. (C) Time-lapse images of H2B-tdTomato signal reveal a rapid mitosis whose duration can be measured from condensation (purple arrowhead) to decondensation (orange arrowhead). Line graphs plot area of H2B-tdTomato signal: condensation results in decreased area. Mitosis is indicated by the blue box. (D) Scatter plot and box-and-whiskers plot of the duration of mitosis measured as in (C) (n = 58 cells). Dotted line is the mean. (E) H2B-tdTomato signals condense synchronously in multinucleated cells. Time lapse inverted maximum projection images taken at 30-s intervals. Line graphs plot the area of each H2B-tdTomato nucleus leading up to and following the start of mitosis. Nuclei in the same cell condense at the same time. Scale bars, 5 µm.
FIGURE 5:
FIGURE 5:
Semiopen mitosis in A. pullulans. (A) NLS-tdTomato signal disperses during mitosis. Inverted maximum projection image time-lapse series of DLY23971. (B) Scatter plot and box-and-whiskers plot of the interval during which the NLS probe was dispersed (dotted line is mean; n = 50 cells). (C) Sec61-tdTomato (presumed ER) decorates both cortical and perinuclear regions. Inverted maximum projection (top) and single-plane (bottom) images of DLY24037. (D) During mitosis Sec61-tdTomato (presumed nuclear envelope) progresses from a circle to a misshapen ovoid, then two-lobed and three-lobed intermediates before resolving to two daughter circles. In the three-lobed intermediates the lobe in the middle (purple arrow) was larger than the other two (green arrowheads). Inverted maximum projection image time-lapse series of DLY24037. (E) Nic96-tdTomato decorates puncta (presumed nuclear pore complexes) around a sphere in interphase (pink arrows). Inverted single plane images of DLY24031. (F) Nic96-tdTomato signal dissipates during mitosis. Inverted maximum projection image time-lapse series of DLY24031. Scale bars, 5 µm. (G) Summary and interpretation. Before chromosome condensation, nuclear pores become permeable, with dispersal of Nic96 and NLS probes from the nucleus. The chromatin (histone signal) then condenses, and the envelope (Sec61 signal) deforms to generate separate daughter nuclei. Following chromosome decondensation, the nuclear pores resume transport and the NLS probe reconcentrates in the nuclei.

Similar articles

Cited by

References

    1. Altamirano S, Li Z, Fu M, Ding M, Fulton S, Yoder J, Tran V, Nielsen K (2021). The cyclin cln1 controls polyploid titan cells formation following a stress-induced G (2) arrest in Cryptococcus. mBio 12, e02509-21. - PMC - PubMed
    1. Aoki K, Hayashi H, Furuya K, Sato M, Takagi T, Osumi M, Kimura A, Niki H (2011). Breakage of the nuclear envelope by an extending mitotic nucleus occurs during anaphase in Schizosaccharomyces japonicus. Gene Cells 16, 911–926. - PubMed
    1. Berman J (2006). Morphogenesis and cell cycle progression in Candida albicans. Curr Opin Microbiol 9, 595–601. - PMC - PubMed
    1. Botstein D, Fink G (2011). Yeast: an experimental organism for 21st century biology. Genetics 189, 695–704. - PMC - PubMed
    1. Bundock P, den Dulk-Ras A, Beijersbergen A, Hooykaas P (1995). Trans-kingdom T-DNA transfer from Agrobacterium tumefaciens to Saccharomyces cerevisiae. EMBO J 14, 3206–3214. - PMC - PubMed

Supplementary concepts

LinkOut - more resources