. 2024 Apr 10;15(4):e0335723.
doi: 10.1128/mbio.03357-23. Epub 2024 Mar 6.

The antagonistic transcription factors, EspM and EspN, regulate the ESX-1 secretion system in M. marinum

Affiliations

The antagonistic transcription factors, EspM and EspN, regulate the ESX-1 secretion system in M. marinum

Kathleen R Nicholson et al. mBio. .

Abstract

Bacterial pathogens use protein secretion systems to transport virulence factors and regulate gene expression. Among pathogenic mycobacteria, including Mycobacterium tuberculosis and Mycobacterium marinum, the ESAT-6 system 1 (ESX-1) secretion is crucial for host interaction. Secretion of protein substrates by the ESX-1 secretion system disrupts phagosomes, allowing mycobacteria cytoplasmic access during macrophage infections. Deletion or mutation of the ESX-1 system attenuates mycobacterial pathogens. Pathogenic mycobacteria respond to the presence or absence of the ESX-1 system in the cytoplasmic membrane by altering transcription. Under laboratory conditions, the EspM repressor and WhiB6 activator control transcription of specific ESX-1-responsive genes, including the ESX-1 substrate genes. However, deleting the espM or whiB6 gene does not phenocopy the deletion of the ESX-1 substrate genes during macrophage infection by M. marinum. In this study, we identified EspN, a critical transcription factor whose activity is masked by the EspM repressor under laboratory conditions. In the absence of EspM, EspN activates transcription of whiB6 and ESX-1 genes during both laboratory growth and macrophage infection. EspN is also independently required for M. marinum growth within and cytolysis of macrophages, similar to the ESX-1 genes, and for disease burden in a zebrafish larval model of infection. These findings suggest that EspN and EspM coordinate to counterbalance the regulation of the ESX-1 system and support mycobacterial pathogenesis.IMPORTANCEPathogenic mycobacteria, which are responsible for tuberculosis and other long-term diseases, use the ESX-1 system to transport proteins that control the host response to infection and promote bacterial survival. In this study, we identify an undescribed transcription factor that controls the expression of ESX-1 genes and is required for both macrophage and animal infection. However, this transcription factor is not the primary regulator of ESX-1 genes under standard laboratory conditions. These findings identify a critical transcription factor that likely controls expression of a major virulence pathway during infection, but whose effect is not detectable with standard laboratory strains and growth conditions.

Keywords: ESX-1; Mycobacterium; regulation; transcription; type VII secretion.


Conflict of interest statement

The authors declare no conflict of interest.

Figures
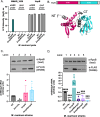
Fig 1
Fig 1
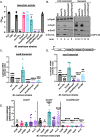
EspN binds the whiB6 promoter and activates whiB6 expression in the absence of EspM. (A) Mass spectrometry analysis of the DNA affinity chromatography showing enrichment of the MMAR_1626 and HupB proteins. The HupB protein binds non-specifically to both DNA probes. The scale represents the log2 intensity of Mass Spectral peak area (MS peak areas). The data were published in Sanchez et al. (22) and adapted in Data set S1. (B) The predicted domain structure of MMAR_1626, which we renamed EspN. Modeled using RoseTTAFold from Robetta (29). Model confidence: 0.80. (C) (Top) Western blot analysis of M. marinum cell-associated proteins. RpoB is a loading control. All strains include a whiB6-3xFl allele at the whiB6 locus (20). (Bottom) Relative qRT-PCR analysis of M. marinum strains compared to sigA transcript levels. Statistical analysis was performed using one-way ANOVA (P = 0.0359), followed by a Dunnett’s multiple comparison test, which revealed no significant differences relative to the WT strain. (D) (Top) Western blot analysis of 10 µg of M. marinum whole-cell lysates. RpoB serves as a loading control. All strains include a whiB6-3xFl allele at the whiB6 locus (20); (bottom) qRT-PCR of the whiB6 transcript relative to sigA. Significance was determined using ordinary one-way ANOVA (P = 0.0001), followed by Tukey’s multiple comparisons test. Significance shown is relative to the ΔespM strain, with additional statistics of interest discussed in the text. ****P < 0.0001, ***P = 0.0002 for ΔeccCb1, **P = 0.0010, ***P = 0.0002 for ΔespM/pespN, ***P = 0.0009 for ΔwhiB6. Western blots are representative of three independent biological replicates. All qRT-PCRs include at least three independent biological replicates, each in technical triplicate. ANOVA, analysis of variance; au, arbitrary units; qRT-PCR, quantitative reverse transcription PCR; SCP2, sterol carrier protein 2; wHTH, winged helix-turn-helix; WT, wild type.
Fig 2
Fig 2
EspN and EspM control transcription of ESX-1 components and substrates. (A) Sheep red blood cell lysis measuring hemolytic activity of M. marinum. Statistical analysis was performed using ordinary one-way ANOVA followed by Dunnett’s multiple comparisons test relative to the WT strain. ****P < 0.0001, ***P = 0.0003. Data include three biological replicates each in technical triplicate. (B) Western blot of 10 µg of M. marinum cell-associated proteins. All strains include a whiB6-Fl allele. RpoB is a control for lysis. MPT-32 is a loading control for the secreted fractions. Blot is representative of three independent biological replicates. (C) Relative qRT analysis of the espE transcript compared to sigA transcript levels in M. marinum. Statistical analysis was performed using ordinary one-way ANOVA (P < 0.0001) followed by Tukey’s multiple comparisons test. Significance is shown relative to the ΔespM strain. ***P = 0.0010 (WT), ****P < 0.0001, ***P = 0.0003 (ΔwhiB6). (D) Relative qRT analysis of the eccA transcript compared to sigA transcript levels in M. marinum. Statistical analysis was performed using ordinary one-way ANOVA (P < 0.0001) followed by Tukey’s multiple comparisons test. Significance shown relative to the ΔespM strain. **P = 0.0012 (WT), P = 0.0026 (ΔwhiB6); ****P < 0.0001. (E) Relative qRT-PCR of the espN, espM, whiB6, espE, and eccA transcripts during macrophage infection. RAW 264.7 cells were infected with a multiplicity of infection of 20, and M. marinum strains were isolated at 4 hours post-infection. Outliers were identified using Robust regression and Outlier(ROUT) analysis, Q = 0.05%. Statistical analysis was performed using ordinary one-way ANOVA (P = 0.0004 for ΔespN, P < 0.0001 for ΔespM and ΔespMΔespN) followed by Dunnett’s multiple comparisons test relative to the WT strain (dotted line) in each strain. For ΔespN, *P = 0.0352, ΔespM, *P = 0.0320, ****P < 0.0001; for ΔespMΔespN, ****P < 0.0001. For all qRT-PCR, data include three independent biological replicates each in technical triplicate.
Fig 3
Fig 3
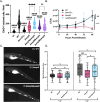
EspN is required for pathogenesis. (A) CFU of M. marinum strains (MOI = 0.2). The data points are the average of three independent biological replicates. Significance was determined using ordinary two-way ANOVA (P < 0.0001) followed by Tukey’s multiple comparisons test compared to the WT strain. The significance shown is compared to the WT strain at 96 hours post-infection (P < 0.0001). The ΔeccCb1 and ΔespN strains were also significantly different from the WT strain at 72 hpi (P = 0.0021 and P = 0.0024, respectively). (B) M. marinum burden in zebrafish infection measured using bacterial mCerulean fluorescence. Data are composed of two biological replicates with 20–30 independent infections per replicate. Statistical analyses were performed using one-way ANOVA followed by Tukey’s multiple comparisons of each group to the WT strain (***P = 0.00012, *P = 0.021). (C) Representative images of zebrafish infected with an initial dose of 150–200 fluorescent bacilli for (1.) WT, (2.) ΔespN, or (3.) ΔespN/pespN at 5 days post-infection. Scale bar is 500 µm. (D) Macrophage cytolysis as measured by EthD-1 staining 24 hours post-infection with M. marinum at an MOI of 4. Statistical analysis was performed using one-way ANOVA followed by Dunnett’s multiple comparisons test relative to the WT strain (****P < 0.0001). Each dot represents the number of EthD-1-stained cells in a single field. A total of 10 fields were counted using ImageJ for each well. Processing of three wells was performed for each biological replicate. A total of 90 fields were counted for each strain. CFU, colony-forming unit; ns, not significant.
Fig 4
Fig 4
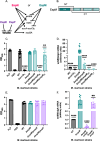
High levels of EspN transcription are required for dominance in the ΔespM strain. (A) Schematic of the −10 region from the mycobacterial optimal promoter driving espN transcription. Pink residues are mutations in the −7 and −12 positions. (B) Relative qRT analysis of the espN transcript compared to sigA transcript levels in M. marinum. Outliers were identified using ROUT analysis, Q = 0.5%. Statistical analysis was performed using ordinary one-way ANOVA (P < 0.0001) followed by Dunnett’s multiple comparisons test. Significance is shown relative to the ΔespM/pespN or ΔespMΔespN/pespN strain. ****P < 0.0001. Data include three biological replicates each in technical triplicate. (C) sRBC lysis measuring hemolytic activity of M. marinum. Statistical analysis was performed using ordinary one-way ANOVA followed by Dunnett’s multiple comparisons test relative to the ΔespM or ΔespMΔespN strain. ****P < 0.0001. Data include three biological replicates each in technical triplicate.
Fig 5
Fig 5
Overexpression of the EspM N-terminus or EspE negatively impacts ESX-1 transcription in the absence of EspM. (A) Schematic of transcriptional regulation by EspM, EspN, and WhiB6. EspE and EspF are ESX-1 substrates that negatively regulate the WhiB6 transcription factor (28). (B) Schematic of the predicted domains of the EspM protein. (C) sRBC lysis measuring the hemolytic activity of M. marinum. Outliers were identified using ROUT analysis, Q = 0.05%. Statistical analysis was performed using one-way ANOVA (P < 0.0001) followed by Dunnett’s multiple comparisons test (**P = 0.0034, ****P < 0.0001). The data include at least three independent biological replicates each in technical triplicate. (D) Relative qRT-PCR analysis of whiB6 compared to sigA transcript levels. Significance was determined using ordinary one-way ANOVA (P < 0.0001), followed by Dunnett's multiple comparisons test (****P < 0.0001) relative to the ΔespM strain. The qRT-PCR data include at least three independent biological replicates each in technical triplicate. (E) sRBC lysis measuring hemolytic activity of M. marinum. Outliers were identified using ROUT analysis, Q = 0.05%. Statistical analysis was performed using ordinary one-way ANOVA (P = 0.9639), which did not indicate significant differences. The data include at least three independent biological replicates each in technical triplicate. (F) Relative qRT-PCR analysis of whiB6 compared to sigA transcript levels. Outliers were identified using ROUT analysis (Q = 0.5%). Significance was determined using ordinary one-way ANOVA (P < 0.0001), followed by Dunnett's multiple comparisons test (**P = 0.0070, ****P < 0.0001) relative to the ΔespM strain. The qRT-PCR data include at least three independent biological replicates each in technical triplicate. FHA, forkhead-associated domain; HTH, helix-turn-helix; NT, N-terminus.

Similar articles

Cited by

References

    1. Green ER, Mecsas J. 2016. Bacterial secretion systems: an overview. Microbiol Spectr 4. doi:10.1128/microbiolspec.VMBF-0012-2015 - DOI - PMC - PubMed
    1. Nicholson KR, Champion PA. 2022. Bacterial secretion systems: networks of pathogenic regulation and adaptation in mycobacteria and beyond. PLoS Pathog 18:e1010610. doi:10.1371/journal.ppat.1010610 - DOI - PMC - PubMed
    1. Tobin DM, Ramakrishnan L. 2008. Comparative pathogenesis of Mycobacterium marinum and Mycobacterium tuberculosis. Cell Microbiol 10:1027–1039. doi:10.1111/j.1462-5822.2008.01133.x - DOI - PubMed
    1. Stanley SA, Raghavan S, Hwang WW, Cox JS. 2003. Acute infection and macrophage subversion by Mycobacterium tuberculosis require a specialized secretion system. Proc Natl Acad Sci U S A 100:13001–13006. doi:10.1073/pnas.2235593100 - DOI - PMC - PubMed
    1. Gao L-Y, Guo S, McLaughlin B, Morisaki H, Engel JN, Brown EJ. 2004. A mycobacterial virulence gene cluster extending RD1 is required for cytolysis, bacterial spreading and ESAT-6 secretion. Mol Microbiol 53:1677–1693. doi:10.1111/j.1365-2958.2004.04261.x - DOI - PubMed

MeSH terms