. 2024 Mar 1;41(3):msae050.
doi: 10.1093/molbev/msae050.

Evolution of a Restriction Factor by Domestication of a Yeast Retrotransposon

Affiliations

Evolution of a Restriction Factor by Domestication of a Yeast Retrotransposon

J Adam Hannon-Hatfield et al. Mol Biol Evol. .

Abstract

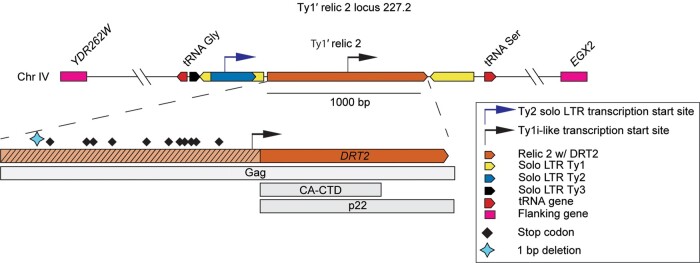
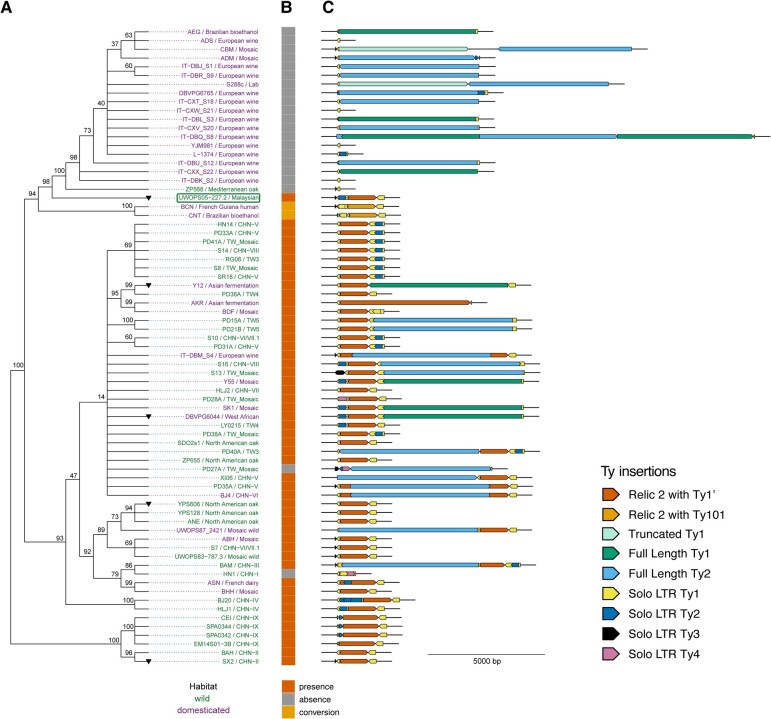
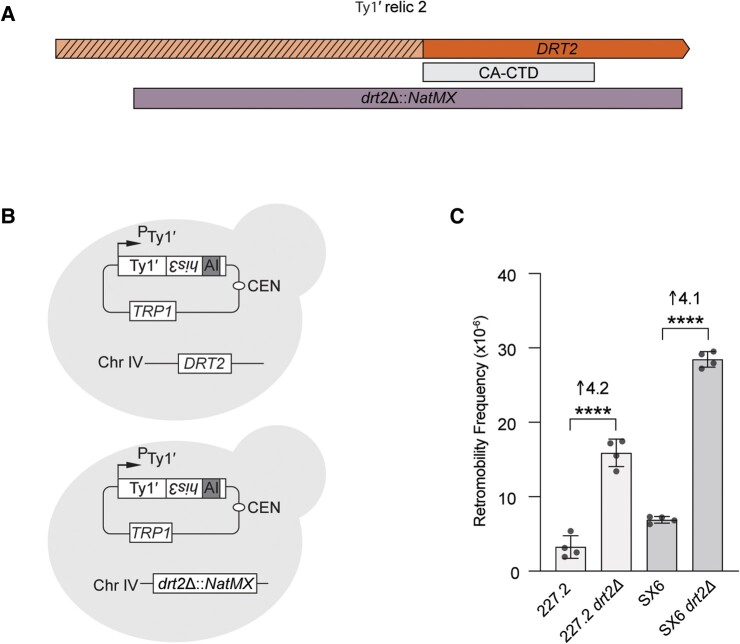
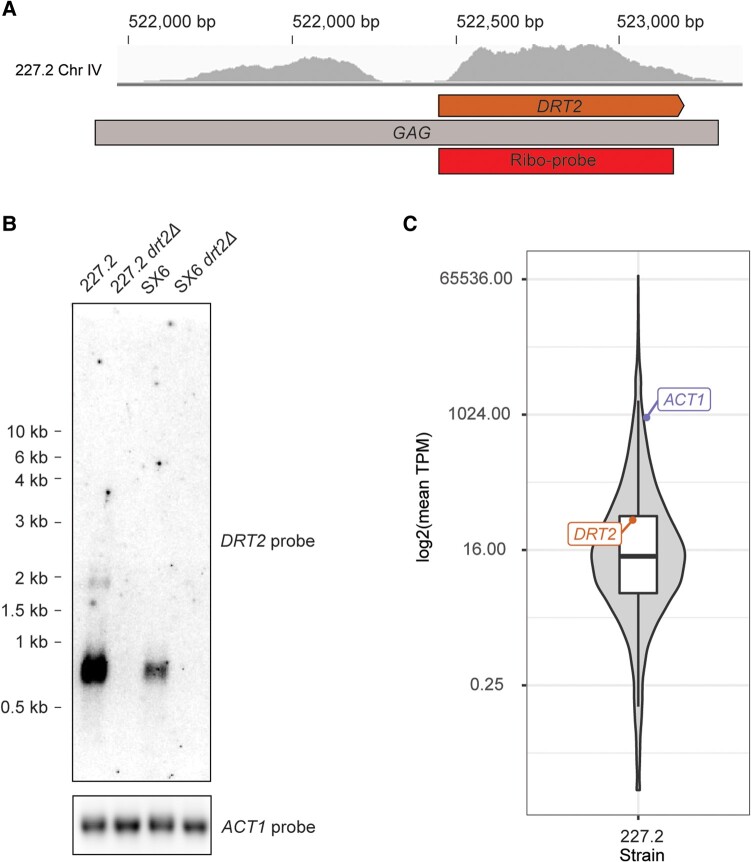
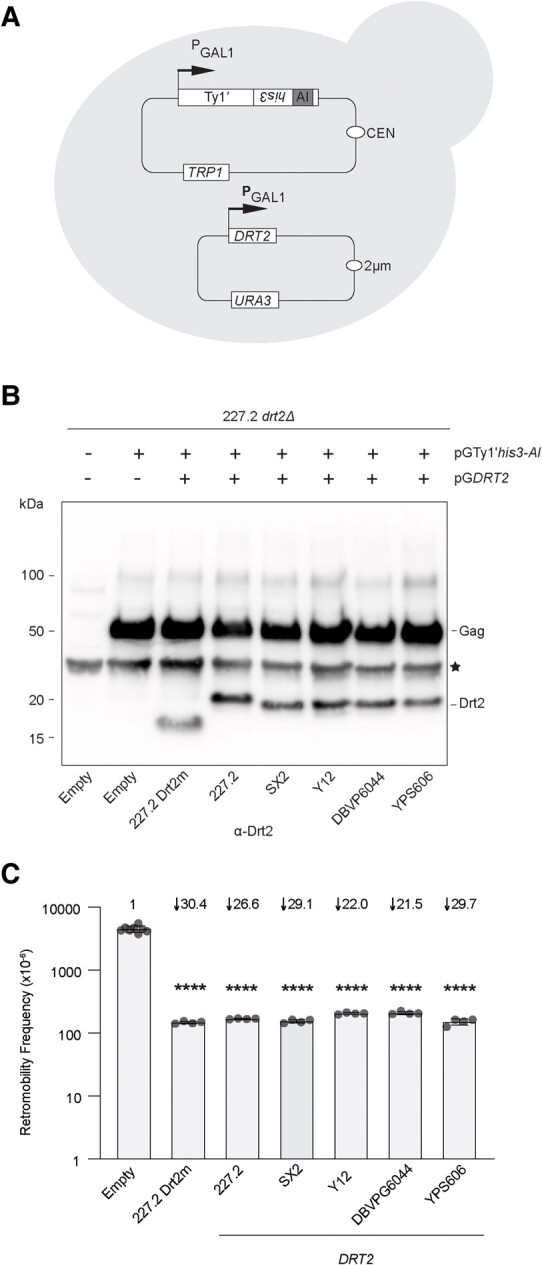
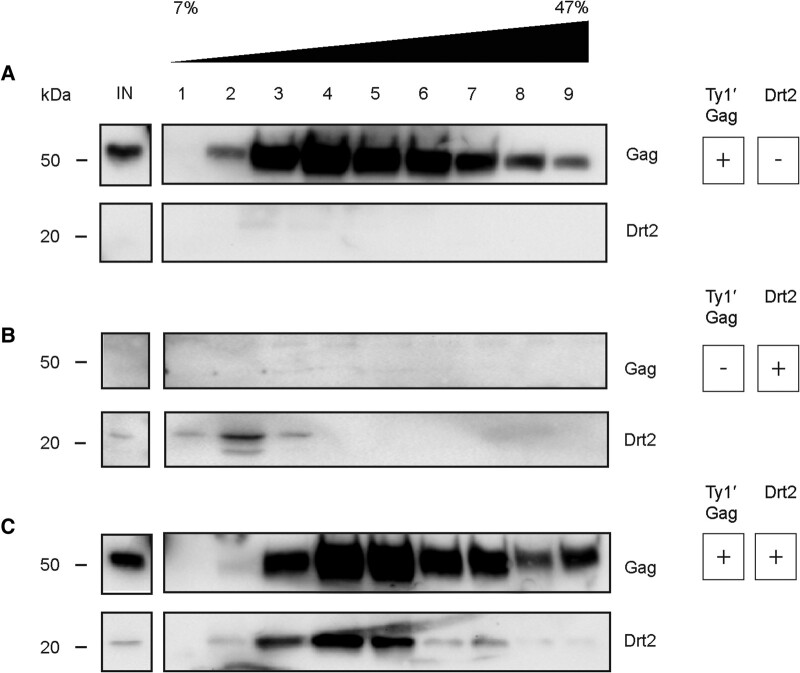
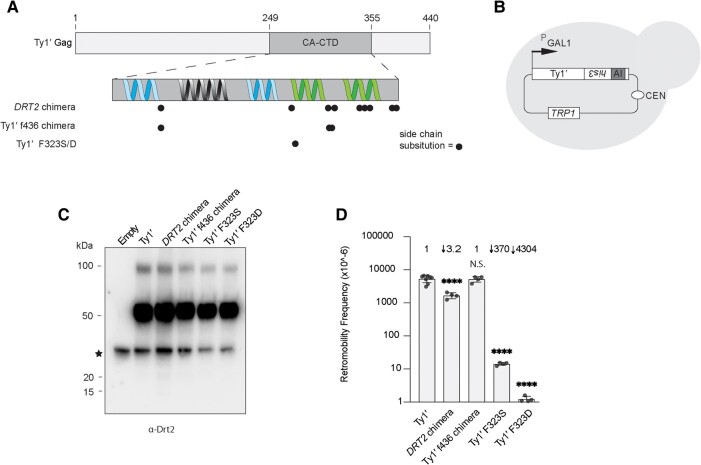
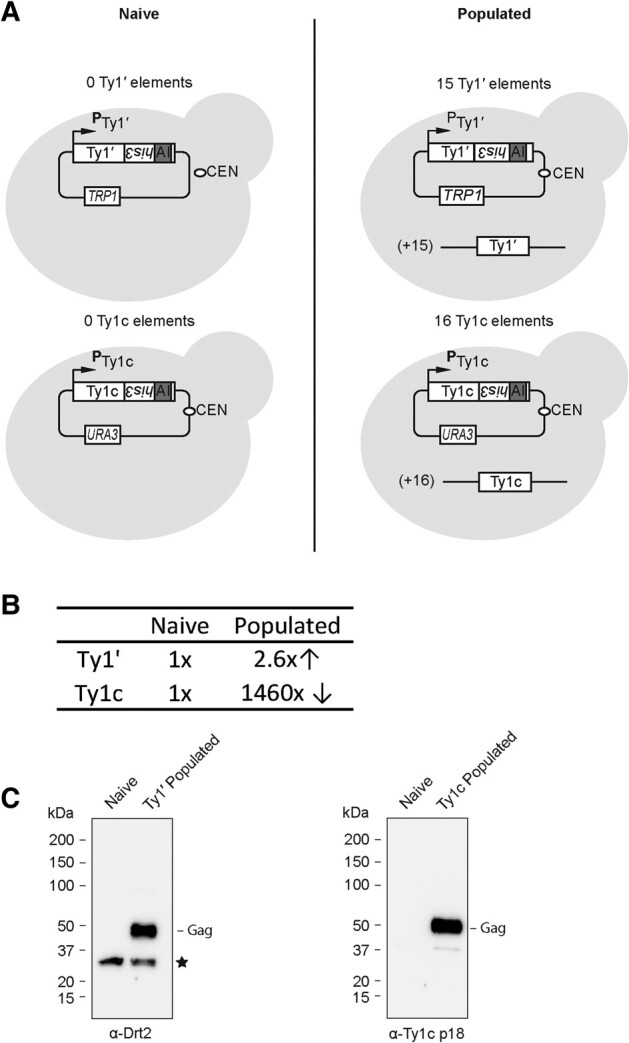
Transposable elements drive genome evolution in all branches of life. Transposable element insertions are often deleterious to their hosts and necessitate evolution of control mechanisms to limit their spread. The long terminal repeat retrotransposon Ty1 prime (Ty1'), a subfamily of the Ty1 family, is present in many Saccharomyces cerevisiae strains, but little is known about what controls its copy number. Here, we provide evidence that a novel gene from an exapted Ty1' sequence, domesticated restriction of Ty1' relic 2 (DRT2), encodes a restriction factor that inhibits Ty1' movement. DRT2 arose through domestication of a Ty1' GAG gene and contains the C-terminal domain of capsid, which in the related Ty1 canonical subfamily functions as a self-encoded restriction factor. Bioinformatic analysis reveals the widespread nature of DRT2, its evolutionary history, and pronounced structural variation at the Ty1' relic 2 locus. Ty1' retromobility analyses demonstrate DRT2 restriction factor functionality, and northern blot and RNA-seq analysis indicate that DRT2 is transcribed in multiple strains. Velocity cosedimentation profiles indicate an association between Drt2 and Ty1' virus-like particles or assembly complexes. Chimeric Ty1' elements containing DRT2 retain retromobility, suggesting an ancestral role of productive Gag C-terminal domain of capsid functionality is present in the sequence. Unlike Ty1 canonical, Ty1' retromobility increases with copy number, suggesting that C-terminal domain of capsid-based restriction is not limited to the Ty1 canonical subfamily self-encoded restriction factor and drove the endogenization of DRT2. The discovery of an exapted Ty1' restriction factor provides insight into the evolution of the Ty1 family, evolutionary hot-spots, and host-transposable element interactions.

Keywords: Saccharomyces; domesticated gene; host defense; retrotransposon.


Figures

Fig. 1.
Fig. 1.
Organization of the relic 2 locus on chromosome IV in UWOPS05-227.2. The relic 2 Ty1′ insertion is flanked upstream by Ty1, Ty2, and Ty3 solo LTR sequences, tRNA Gly (YNCD0020W), and the coding gene YDR262W and flanked downstream by Ty1 solo LTR sequence, tRNA Ser (YNCD0019C), and the coding gene EXG2. The approximate locations of Ty2 solo LTR and Ty1i-like transcription start sites are labeled with blue and black arrows, respectively. Within the relic 2 Ty1′ sequence, a 1 bp deletion relative to Ty1′ GAG (blue diamond) causes in-frame stop codons (black diamonds) upstream of DRT2. Regions homologous to Ty1c GAG, the CA-CTD coding region, and the p22 protein are shown as gray boxes.
Fig. 2.
Fig. 2.
Evolution of the relic 2 locus. A) ML phylogenetic tree based on the concatenated sequence 1 kb upstream and 1 kb downstream of the tRNA genes from local assemblies of the relic 2 locus. The phylogeny was rooted with the clade containing the most ancient S. cerevisiae lineage (China IX/Taiwan). Branch lengths do not represent evolutionary distance, and branches <1e−05 were omitted to simplify the visualization. Taxa in green indicate strains from wild isolations; taxa in purple represent strains from domesticated/human associated lineages. Numbers at internal nodes represent bootstrap support values based on 100 replicates. The 227.2 reference is highlighted in the box. Five strains used for functional analysis of DRT2 alleles are indicated with black triangles. B) Color stripe showing the presence (orange), absence (gray), or gene conversion (gold) of the relic 2 Ty1′ insertion in each strain. BCN and CNT contain a truncated insertion structurally like relic 2 Ty1′, but with a sequence haplotype from the Ty101 subfamily, and represent putative gene conversion events. C) Ty content of relic 2 locus. Arrowheads indicate the orientation of annotated Ty fragments.
Fig. 3.
Fig. 3.
DRT2 restriction of Ty1′. A) The relic 2 locus with the DRT2 deletion interval (drt2Δ::NatMX, purple box) and CA-CTD is indicated. B) Scheme for determining DRT2 restriction of Ty1′. A Ty1′ reporter element under its endogenous promoter (PTy1′) containing the his3-AI retromobility reporter is presented. Ty1′his3-AI mobility restores histidine prototrophy in a strain lacking chromosomal HIS3. An arrow represents transcription start site. PTy1′ contains a low-copy centromere replication sequence (CEN) and the TRP1 gene. The 2 strains represent the WT parent containing DRT2 or the knockout containing drt2::ΔNatMX. C) Ty1′his3-AI retromobility in isogenic 227.2 or SX6 WT and drt2Δ strains. Bars represent the mean of at least 4 independent measurements (circles). Standard deviation is represented by error bars. Fold change compared with WT is shown above bars. Statistical significance measured with Welch's t-test comparison of WT with drt2Δ strains. ****P < 0.0001 with exact values reported in supplementary table S4, Supplementary Material online.
Fig. 4.
Fig. 4.
DRT2 expression. A) Poly(A)+ RNA-seq coverage in the relic 2 locus in strain 227.2. Sequences corresponding to DRT2 orange, GAG (gray), and the DRT2 ribo-probe (red) are noted. B) Northern blot analysis of DRT2 transcripts. Poly(A)+ RNA was isolated from strains 227.2, 227.2 drt2Δ, SX6, and SX6 drt2Δ, separated by formaldehyde–agarose gel electrophoresis, and hybridized with strand-specific 227.2 DRT2 or ACT1  32P-labeled riboprobes. The band intensities do not correspond to relative abundance of transcripts. RNA size markers are indicated alongside the blot. C) Expression level of DRT2 relative to other S. cerevisiae genes in strain 227.2. Mean TPM for 5,395 S. cerevisiae protein-coding genes plus DRT2 was estimated across 16 runs of poly(A)+ RNA-seq reads in strain 227.2 (Lee et al. 2013) and then log2 transformed and plotted as a boxplot overlayed on a violin plot. The lower and upper edges of the boxplot correspond to the first and third quartiles, whiskers extend to points within ±1.5 the interquartile range, outlying points are not plotted, and ACT1 and DRT2 are annotated.
Fig. 5.
Fig. 5.
Multiple DRT2 alleles restrict Ty1′ retromobility. A) Scheme used to determine Ty1′ retromobility in strain 227.2 drt2Δ. Shown is a full-length Ty1′ reporter element under control of the inducible GAL1 promoter (PGAL1) and marked with his3-AI. A retromobility event restores histidine prototrophy. The arrow represents the transcription start site. The plasmid contains a low-copy centromere replication sequence (CEN) and the TRP1 gene for plasmid selection in yeast. DRT2 variant alleles, including the truncated 227.2 Drt2m (CA-CTD only), expressed from the GAL1 promoter are present on a 2 μ multicopy plasmid with the URA3 gene for plasmid selection in yeast. B) Western blot of Ty1′ Gag and Drt2 in strains used to determine the level of retromobility. Whole cell extracts prepared from galactose-induced cells were probed with α-Drt2 antibody. A black star indicates a nonspecific protein recognized by α-Drt2. Plasmids harbored in each strain are indicated above blot. The label below the graph indicates the DRT2 variant allele or the empty multicopy plasmid control. All strains are 227.2 drt2Δ derivatives. C) Retromobility frequency of variant DRT2 alleles from independent strains. Cells were grown under galactose-inducing conditions, and frequency of cells able to grow on selective media was determined. All strains are 227.2 drt2Δ derivatives. Statistical significance was measured with Welch's t-test comparison of WT with drt2Δ strains. ****P < 0.0001 with exact values reported in supplementary table S4, Supplementary Material online.
Fig. 6.
Fig. 6.
Drt2 associates with Ty1′ VLPs. Whole cell protein extracts from galactose-induced cultures were separated by velocity sedimentation over a continuous 7% to 47% sucrose gradient. Protein input (IN) from each gradient and fractions collected across the gradient are denoted at the top, with 1 containing the lowest and 7 containing the highest sucrose concentration. Representative western blots of ≥3 replicates are shown. α-Ty1′ primary antibody was used to detect Ty1′ Gag, and α-6xhis tag primary antibody was used to detect Drt2. Molecular weight markers are indicated alongside the blots. A) 227.2 drt2Δ strain containing pGTy1′his3-AI and empty vector plasmid shows Ty1′ Gag sedimentation in the absence of Drt2. B) 227.2 drt2Δ strain containing empty vector plasmid and pGDRT2 shows Drt2 sedimentation in the absence of Ty1′ proteins. C) 227.2 drt2Δ strain containing pGTy1′his3-AI and pGDRT2 shows Drt2 sedimentation in the presence of Ty1′ proteins.
Fig. 7.
Fig. 7.
DRT2 can function as a Ty1′ GAG CA-CTD. A) Schematic of constructs used to determine chimeric element retromobility. Predicted alpha helices in the CA-CTD region are indicated with those participating in dimer-1 formation (blue) and those participating in dimer-2 formation (green). The location of side chain substitutions relative to Ty1′ Gag CA-CTD (from S288c YBLWTy1-1) is indicated with circles. Substitutions are described in supplementary fig. S4, Supplementary Material online. B) Schematic to determine retromobility of Ty1′-Gag CA-CTD variants in strain 227.2 drt2Δ. WT, chimeric, or mutant Ty1′ reporter elements are under the control of the GAL1 promoter and contain his3-AI (PGTy1′). C) Western analysis of whole cell extracts from cells induced for expression to detect Gag protein with an α-Drt2 primary antibody. Black star indicates a nonspecific band. D) Quantitative retromobility for WT, chimeric, and mutant Ty1′ elements. Bars represent the average ≥4 independent measurements with each measurement shown as a circle. Standard deviation represented by error bars. Fold change compared with WT shown above bars. Statistical significance was measured with Welch's t-test comparison of YBLWTy1-1 with each mutant construct. N.S., not significant. ****P < 0.0001 with exact values reported in supplementary table S4, Supplementary Material online.
Fig. 8.
Fig. 8.
Ty1′ lacks self-encoded CNC. The 227.2 drt2Δ strains were populated with either Ty1′ (YBLWTy1-1) or Ty1c (Ty1-H3) elements. Ty1′ and Ty1c copy number was estimated by southern blotting (supplementary fig. S6, Supplementary Material online). A) Retromobility of pGTy1′his3-AI and pGTy1chis3-AI was determined in the naïve strains in triplicate. B) Retromobility of pGTy1′his3-AI and pGTy1chis3-AI was measured in triplicate in the populated strains. Fold change in retromobility of populated versus naïve strains is indicated. Retromobility measurements and statistics are reported in supplementary table S4, Supplementary Material online. C) Western blot analysis of whole cell extracts from strains induced for expression was used to detect the level of Gag in populated strains. Ty1′ Gag was detected with α-Drt2 (black star indicates nonspecific band). Ty1c Gag was detected with α-Ty1c p18.

Similar articles

References

    1. Ahn HW, Tucker JM, Arribere JA, Garfinkel DJ. Ribosome biogenesis modulates Ty1 copy number control in Saccharomyces cerevisiae. Genetics 2017:207(4):1441–1456. 10.1534/genetics.117.300388. - DOI - PMC - PubMed
    1. Alani E, Kleckner N. A new type of fusion analysis applicable to many organisms: protein fusions to the URA3 gene of yeast. Genetics 1987:117:5–12. 10.1093/genetics/117.1.5. - DOI - PMC - PubMed
    1. Anders S, Pyl PT, Huber W. HTSeq–a Python framework to work with high-throughput sequencing data. Bioinformatics. 2015:31(2):166–169. 10.1093/bioinformatics/btu638. - DOI - PMC - PubMed
    1. Armezzani A, Varela M, Spencer TE, Palmarini M, Arnaud F. “Menage a trois”: the evolutionary interplay between JSRV, enJSRVs and domestic sheep. Viruses-Basel. 2014:6(12):4926–4945. 10.3390/v6124926. - DOI - PMC - PubMed
    1. Basile A, De Pascale F, Bianca F, Rossi A, Frizzarin M, De Bernardini N, Bosaro M, Baldisseri A, Antoniali P, Lopreiato R, et al. Large-scale sequencing and comparative analysis of oenological Saccharomyces cerevisiae strains supported by nanopore refinement of key genomes. Food Microbiol. 2021:97:103753. 10.1016/j.fm.2021.103753. - DOI - PubMed