

Worldwide trends in underweight and obesity from 1990 to 2022: a pooled analysis of 3663 population-representative studies with 222 million children, adolescents, and adults
- PMID: 38432237
- PMCID: PMC7615769
- DOI: 10.1016/S0140-6736(23)02750-2
Worldwide trends in underweight and obesity from 1990 to 2022: a pooled analysis of 3663 population-representative studies with 222 million children, adolescents, and adults
Abstract
Background: Underweight and obesity are associated with adverse health outcomes throughout the life course. We estimated the individual and combined prevalence of underweight or thinness and obesity, and their changes, from 1990 to 2022 for adults and school-aged children and adolescents in 200 countries and territories.
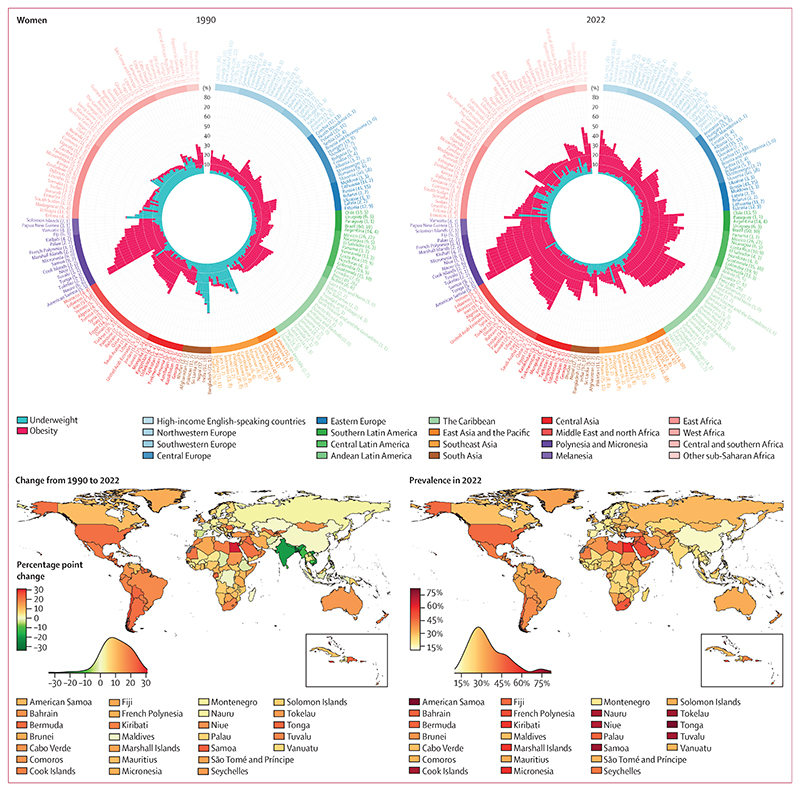
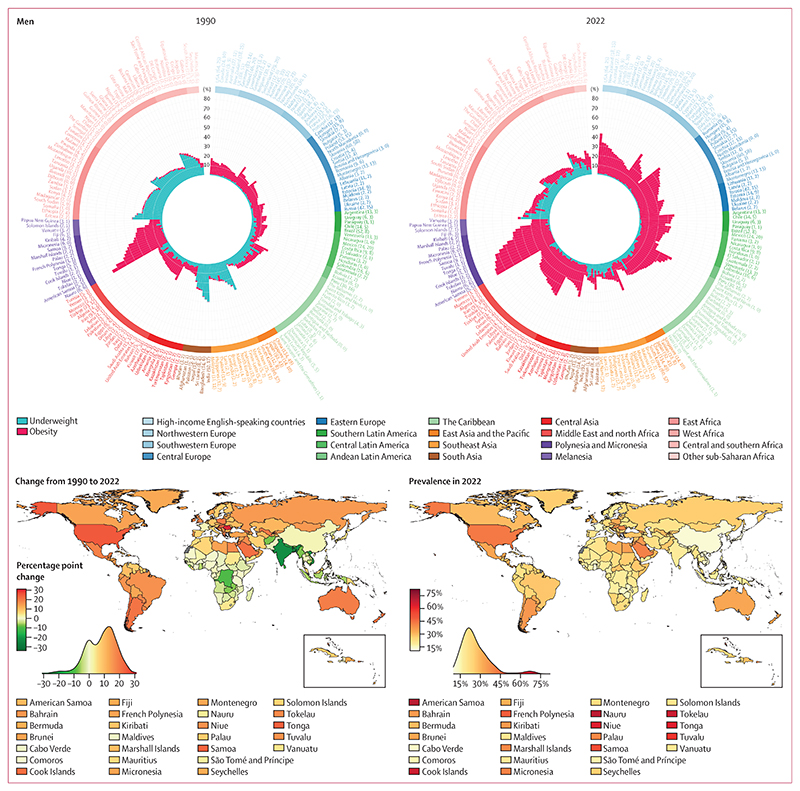
Methods: We used data from 3663 population-based studies with 222 million participants that measured height and weight in representative samples of the general population. We used a Bayesian hierarchical model to estimate trends in the prevalence of different BMI categories, separately for adults (age ≥20 years) and school-aged children and adolescents (age 5-19 years), from 1990 to 2022 for 200 countries and territories. For adults, we report the individual and combined prevalence of underweight (BMI <18·5 kg/m2) and obesity (BMI ≥30 kg/m2). For school-aged children and adolescents, we report thinness (BMI <2 SD below the median of the WHO growth reference) and obesity (BMI >2 SD above the median).
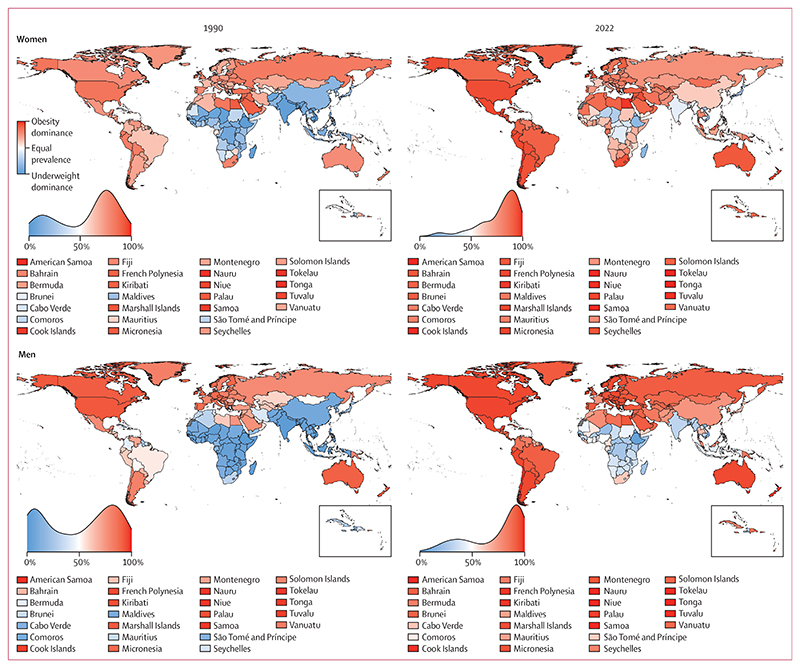
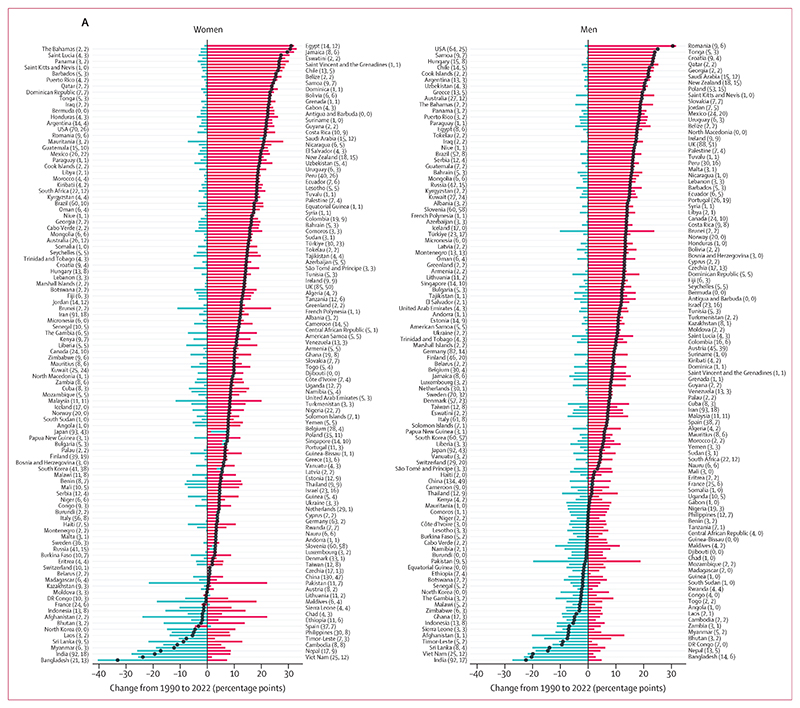
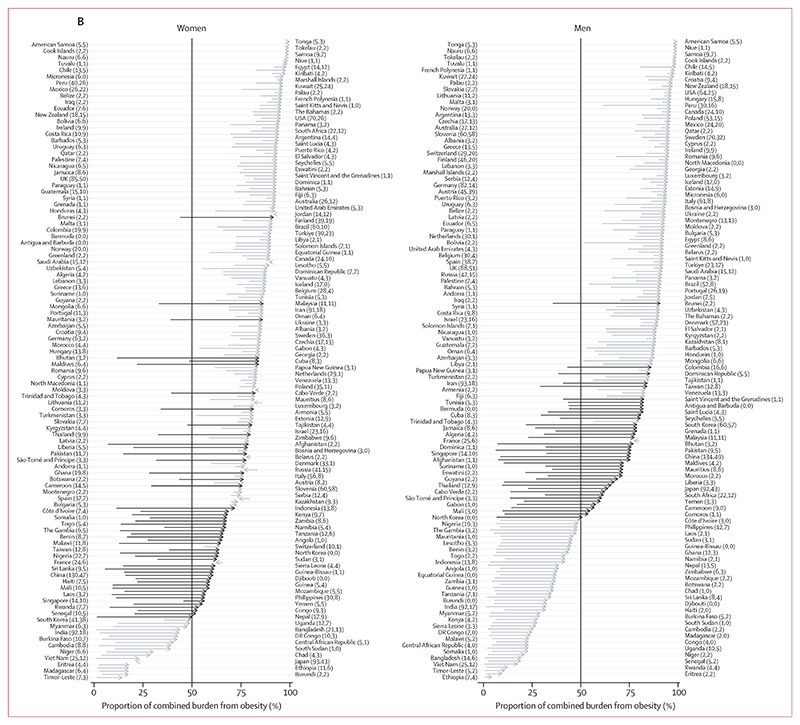
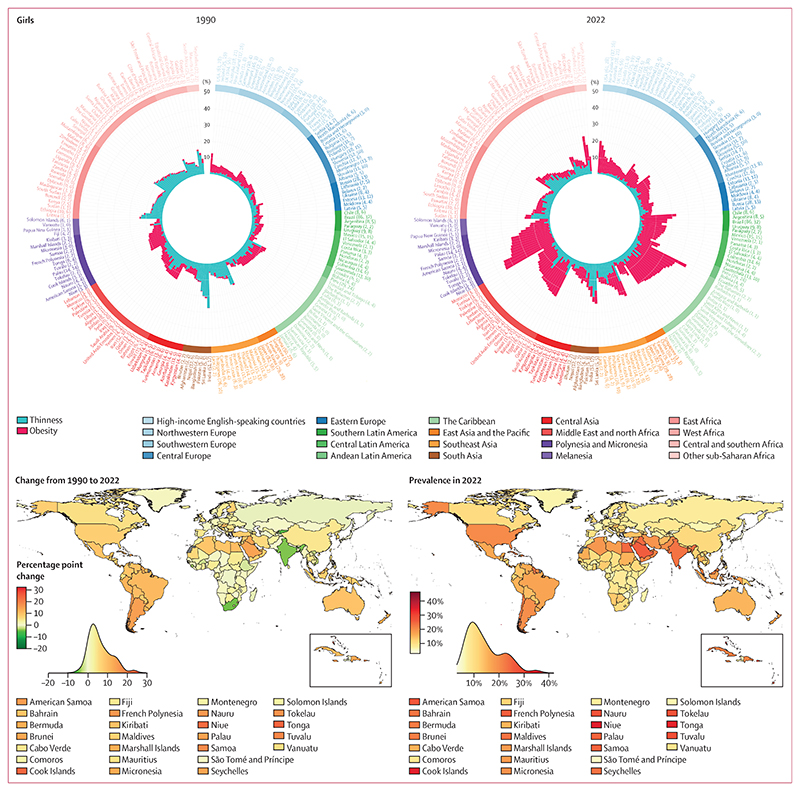
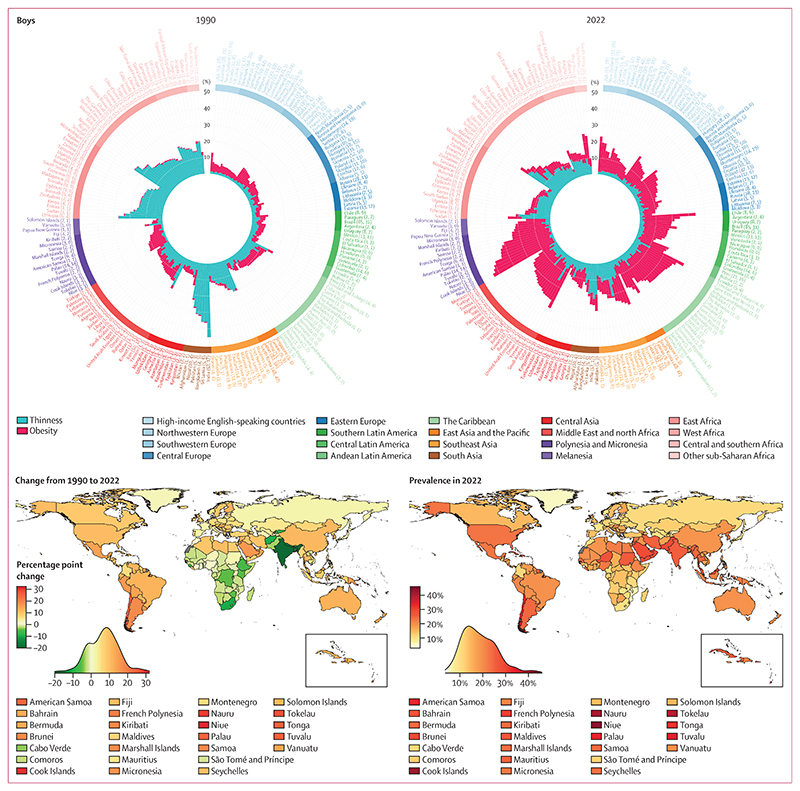
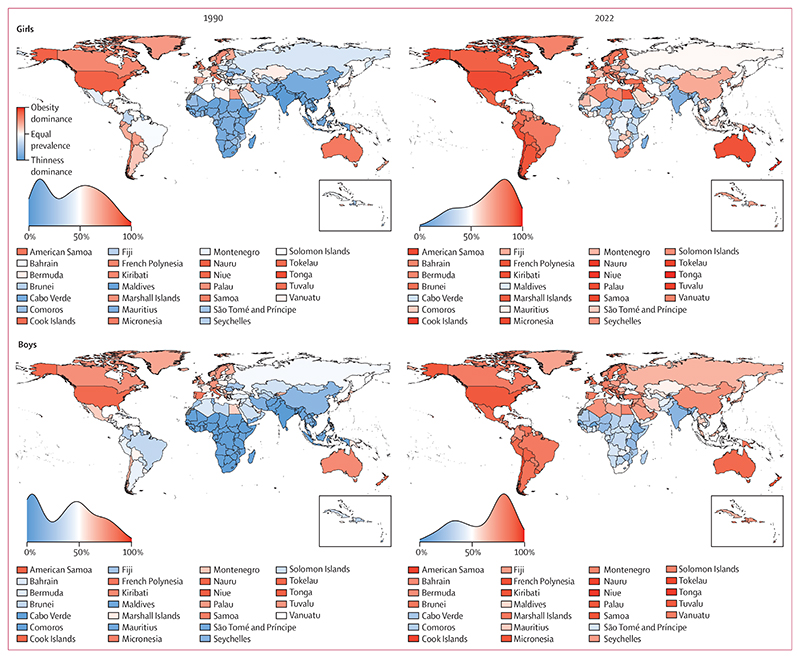
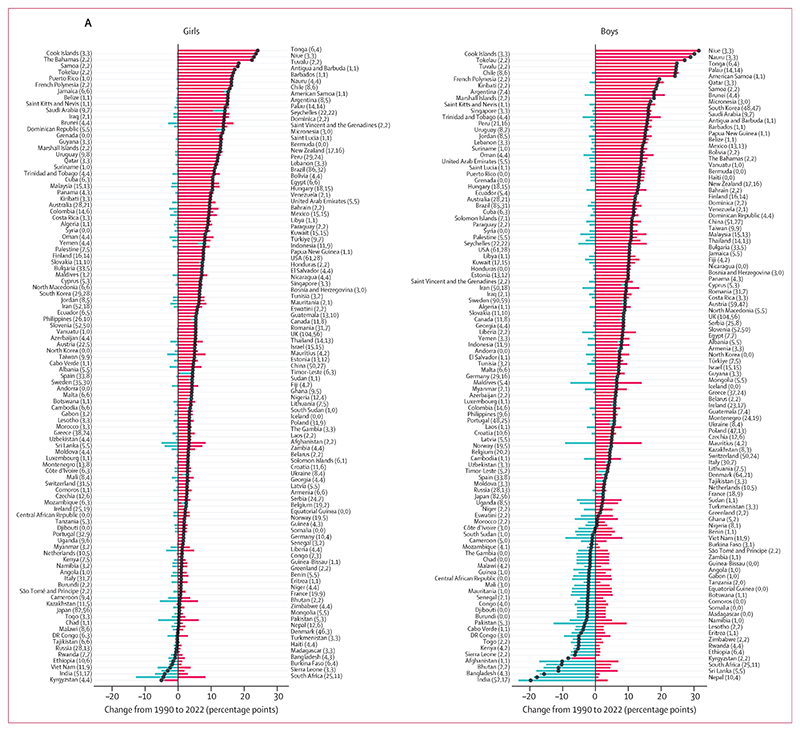
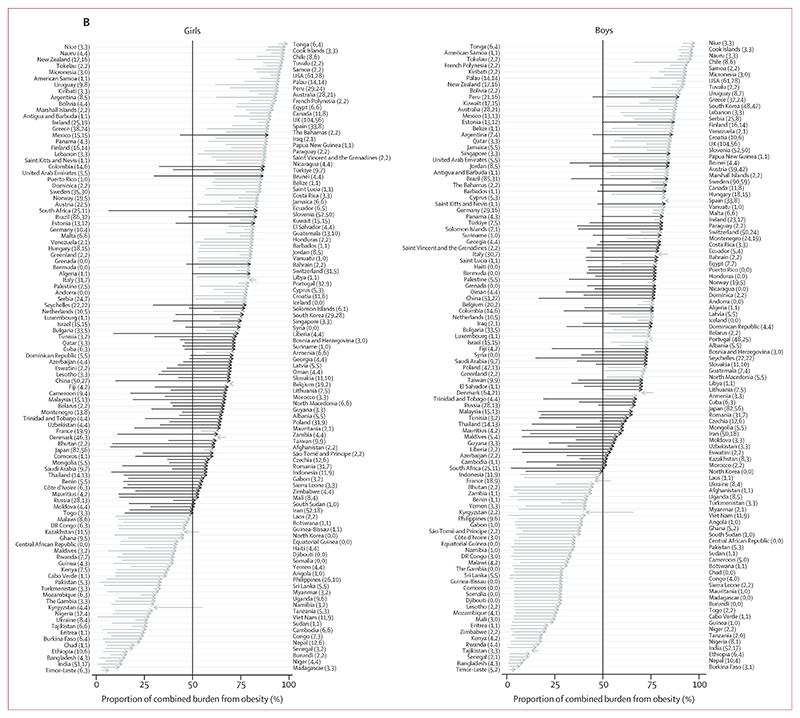
Findings: From 1990 to 2022, the combined prevalence of underweight and obesity in adults decreased in 11 countries (6%) for women and 17 (9%) for men with a posterior probability of at least 0·80 that the observed changes were true decreases. The combined prevalence increased in 162 countries (81%) for women and 140 countries (70%) for men with a posterior probability of at least 0·80. In 2022, the combined prevalence of underweight and obesity was highest in island nations in the Caribbean and Polynesia and Micronesia, and countries in the Middle East and north Africa. Obesity prevalence was higher than underweight with posterior probability of at least 0·80 in 177 countries (89%) for women and 145 (73%) for men in 2022, whereas the converse was true in 16 countries (8%) for women, and 39 (20%) for men. From 1990 to 2022, the combined prevalence of thinness and obesity decreased among girls in five countries (3%) and among boys in 15 countries (8%) with a posterior probability of at least 0·80, and increased among girls in 140 countries (70%) and boys in 137 countries (69%) with a posterior probability of at least 0·80. The countries with highest combined prevalence of thinness and obesity in school-aged children and adolescents in 2022 were in Polynesia and Micronesia and the Caribbean for both sexes, and Chile and Qatar for boys. Combined prevalence was also high in some countries in south Asia, such as India and Pakistan, where thinness remained prevalent despite having declined. In 2022, obesity in school-aged children and adolescents was more prevalent than thinness with a posterior probability of at least 0·80 among girls in 133 countries (67%) and boys in 125 countries (63%), whereas the converse was true in 35 countries (18%) and 42 countries (21%), respectively. In almost all countries for both adults and school-aged children and adolescents, the increases in double burden were driven by increases in obesity, and decreases in double burden by declining underweight or thinness.
Interpretation: The combined burden of underweight and obesity has increased in most countries, driven by an increase in obesity, while underweight and thinness remain prevalent in south Asia and parts of Africa. A healthy nutrition transition that enhances access to nutritious foods is needed to address the remaining burden of underweight while curbing and reversing the increase in obesity.
Funding: UK Medical Research Council, UK Research and Innovation (Research England), UK Research and Innovation (Innovate UK), and European Union.
Copyright © 2024 The Author(s). Published by Elsevier Ltd. This is an Open Access article under the CC BY 4.0 license. Published by Elsevier Ltd.. All rights reserved.
Conflict of interest statement
Conflicts of interest JLB reports personal fees from Novo Nordisk Denmark and voluntary work at the European Association for the Study of Obesity, outside the submitted work. All other authors declare no competing interests.
Figures
Similar articles
-
Worldwide trends in diabetes prevalence and treatment from 1990 to 2022: a pooled analysis of 1108 population-representative studies with 141 million participants.Lancet. 2024 Nov 23;404(10467):2077-2093. doi: 10.1016/S0140-6736(24)02317-1. Epub 2024 Nov 13. Lancet. 2024. PMID: 39549716 Free PMC article.
-
Trends in adult body-mass index in 200 countries from 1975 to 2014: a pooled analysis of 1698 population-based measurement studies with 19·2 million participants.Lancet. 2016 Apr 2;387(10026):1377-1396. doi: 10.1016/S0140-6736(16)30054-X. Lancet. 2016. PMID: 27115820 Free PMC article. Review.
-
Defining the optimum strategy for identifying adults and children with coeliac disease: systematic review and economic modelling.Health Technol Assess. 2022 Oct;26(44):1-310. doi: 10.3310/ZUCE8371. Health Technol Assess. 2022. PMID: 36321689 Free PMC article.
-
National-level and state-level prevalence of overweight and obesity among children, adolescents, and adults in the USA, 1990-2021, and forecasts up to 2050.Lancet. 2024 Dec 7;404(10469):2278-2298. doi: 10.1016/S0140-6736(24)01548-4. Epub 2024 Nov 14. Lancet. 2024. PMID: 39551059 Free PMC article.
-
Mobile health (m-health) smartphone interventions for adolescents and adults with overweight or obesity.Cochrane Database Syst Rev. 2024 Feb 20;2(2):CD013591. doi: 10.1002/14651858.CD013591.pub2. Cochrane Database Syst Rev. 2024. PMID: 38375882 Review.
Cited by
-
Breaking our daily "ultra-processed" bread.PLoS Med. 2024 Jul 25;21(7):e1004437. doi: 10.1371/journal.pmed.1004437. eCollection 2024 Jul. PLoS Med. 2024. PMID: 39052689 Free PMC article.
-
Cryptotanshinone promotes brown fat activity by AMPK activation to inhibit obesity.Nutr Res Pract. 2024 Aug;18(4):479-497. doi: 10.4162/nrp.2024.18.4.479. Epub 2024 May 23. Nutr Res Pract. 2024. PMID: 39109201 Free PMC article.
-
Acupuncture for obesity:study protocol for a randomised controlled trial.BMJ Open. 2024 Aug 26;14(8):e083158. doi: 10.1136/bmjopen-2023-083158. BMJ Open. 2024. PMID: 39187279 Free PMC article.
-
Effect of a Low-Glycemic Index Nutritional Intervention on Body Weight and Selected Cardiometabolic Parameters in Children and Adolescents with Excess Body Weight and Dyslipidemia.Nutrients. 2024 Jul 3;16(13):2127. doi: 10.3390/nu16132127. Nutrients. 2024. PMID: 38999875 Free PMC article. Clinical Trial.
-
Associations of Obstructive Sleep Apnea Risk with Obesity, Body Composition and Metabolic Abnormalities in School-Aged Children and Adolescents.Nutrients. 2024 Jul 25;16(15):2419. doi: 10.3390/nu16152419. Nutrients. 2024. PMID: 39125300 Free PMC article.
References
-
- Stamler J. Epidemic obesity in the United States. Arch Intern Med. 1993;153:1040–44. - PubMed
MeSH terms
Grants and funding
LinkOut - more resources
Full Text Sources
Medical
